Download presentation
Presentation is loading. Please wait.

1
Population Dynamics

2
Objectives The student will investigate and understand dynamic equilibrium within populations, communities, and ecosystems. Key concepts include: interactions within and among populations including carrying capacities, limiting factors, and growth curves; Although several species may share a habitat they each have their own niche. A niche is a very narrow range where a species fits within a habitat.

3
Population Dynamics Population: all the individuals of a species that live together in an area Demography: the statistical study of populations, make predictions about how a population will change Although several species may share a habitat they each have their own niche. A niche is a very narrow range where a species fits within a habitat.

4
3 Key Features of Populations
Size Density Dispersion (clumped, even/uniform, random) Although several species may share a habitat they each have their own niche. A niche is a very narrow range where a species fits within a habitat.
 Although several species may share a habitat they each have their own niche. A niche is a very narrow range where a species fits within a habitat.")
5
3 Key Features of Populations
1. Size: number of individuals in an area Although several species may share a habitat they each have their own niche. A niche is a very narrow range where a species fits within a habitat.

6
3 Key Features of Populations
Growth Rate Birth Rate (natality) - Death Rate (mortality) How many individuals are born vs. how many die Birth rate (b) − death rate (d) = rate of natural increase (r). Although several species may share a habitat they each have their own niche. A niche is a very narrow range where a species fits within a habitat.
 - Death Rate (mortality) How many individuals are born vs. how many die. Birth rate (b) − death rate (d) = rate of natural increase (r). Although several species may share a habitat they each have their own niche. A niche is a very narrow range where a species fits within a habitat.")
7
Factors That Affect Future Population Growth
Immigration + + - Population Mortality Natality - Emigration

8
Population Dynamics Addition of individuals to populations
Removal of individuals from populations

9
3 Key Features of Populations
2. Density: measurement of population per unit area or unit volume Formula: Dp= N Pop. Density = # of individuals ÷ unit of space S Although several species may share a habitat they each have their own niche. A niche is a very narrow range where a species fits within a habitat.

10
Factors that Affect Density
Immigration- movement of individuals into a population Emigration- movement of individuals out of a population

11
Factors that Affect Density
Density-dependent factors- Biotic factors in the environment that have an increasing effect as population size increases Ex. disease competition parasites

12
Humans Are Not Exempt from Nature’s Population Controls
Ireland Potato crop in 1845 Bubonic plague Fourteenth century AIDS Global epidemic

13
Factors that Affect Density
Density-independent factors- Abiotic factors in the environment that affect populations regardless of their density Ex. temperature storms habitat destruction drought

14
Density-Independent Factors (e.g., weather)
Good Times! (in Australia)
")
15
3 Key Features Populations
3. Dispersion: describes their spacing relative to each other clumped even or uniform random Although several species may share a habitat they each have their own niche. A niche is a very narrow range where a species fits within a habitat.

16
clumped even (uniform) random
Although several species may share a habitat they each have their own niche. A niche is a very narrow range where a species fits within a habitat. random

17
Clumped Dispersion of Population
Clumped dispersion implies some sort of cohesive force, e.g., either individuals seek other individuals out, or individuals are limited in where then can reside

18
Uniform Dispersion of Population
Uniform dispersion implies some sort of antagonistic interaction, e.g., either individuals actively repel other individuals

19
Random Dispersion of Population
Random dispersion implies a minimum of interspecific interactions that impact where individuals reside

20
Other Factors That Affect Population Growth
Limiting factor- any biotic or abiotic factor that restricts the existence of organisms in a specific environment. EX.- Amount of water Amount of food Temperature

21
Limiting Factor- Zone of Tolerance
Few organisms present None Few organisms present None Many organisms present Although several species may share a habitat they each have their own niche. A niche is a very narrow range where a species fits within a habitat.

22
Other Factors that Affect Population Growth
Carrying Capacity- the maximum population size that can be supported by the available resources There can only be as many organisms as the environmental resources can support Although several species may share a habitat they each have their own niche. A niche is a very narrow range where a species fits within a habitat.

23
No Population Can Continue to Increase in Size Indefinitely
Biotic Potential = Intrinsic growth rate: Maximum potential for growth –occurs where there is unlimited resources

24
Logistic Growth of a Sheep Population on the Island of Tasmania, 1800–1925
Oscillations about K (the carrying capacity)_
_.")
25
Exponential Growth, Overshoot, and Population Crash of a Reindeer
Irruptive Population Curve

26
Population Cycles for the Snowshoe Hare and Canada Lynx
Boom and Bust Population Curve

27
2 Life History Patterns r Strategists short life span small body size
reproduce quickly have many young little parental care Ex: cockroaches, weeds, bacteria

28
2 Life History Patterns K Strategists long life span large body size
reproduce slowly have few young provides parental care Ex: humans, elephants

29
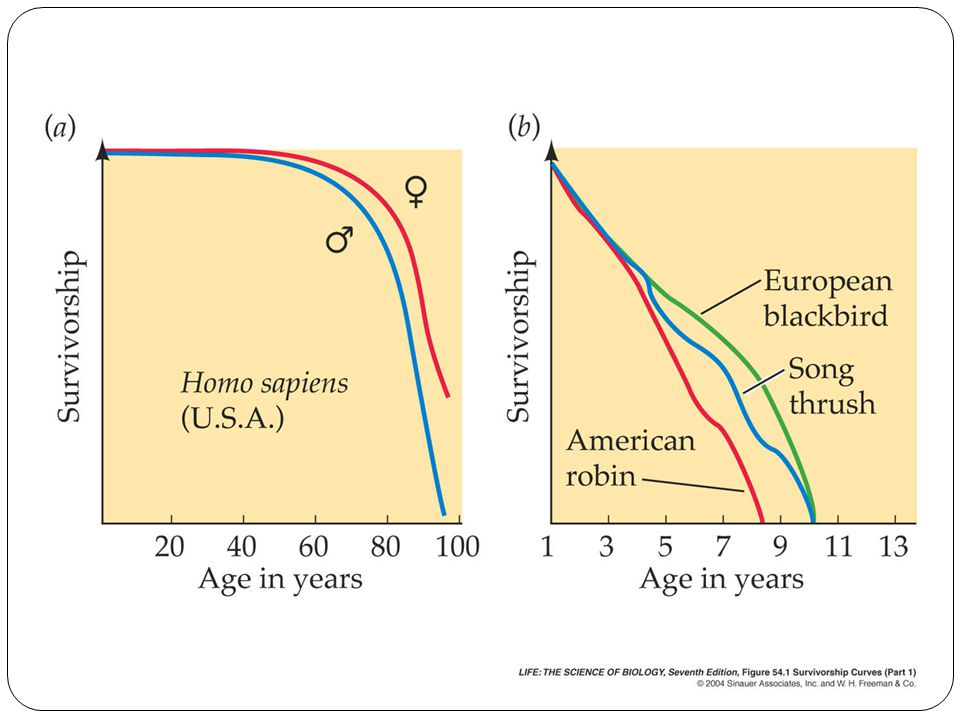
Idealized Survivorship curves

30
Survivorship Curves Three types of survivorship curves
late loss (Type I) Example: Humans constant loss (Type II) Examples: Birds, Fish early loss (Type III) Example: Mice
 Example: Humans. constant loss (Type II) Examples: Birds, Fish. early loss (Type III) Example: Mice.")
33
How is Population Data Gathered?
Births minus Deaths Immigration and Emigration 1,345 – 645= 700 natural increase Age structure Diagrams Tag and Recapture

34
The Human Population Define the following vocabulary
a. Total fertility level b. Replacement level fertility c. Infant mortality rate d. Doubling time e. Zero population growth

35
The Human Population Who was Thomas Malthus and what did he predict?

36
Human Population Growth http://www. populationconnection
Hyperlink to World Population Video

38
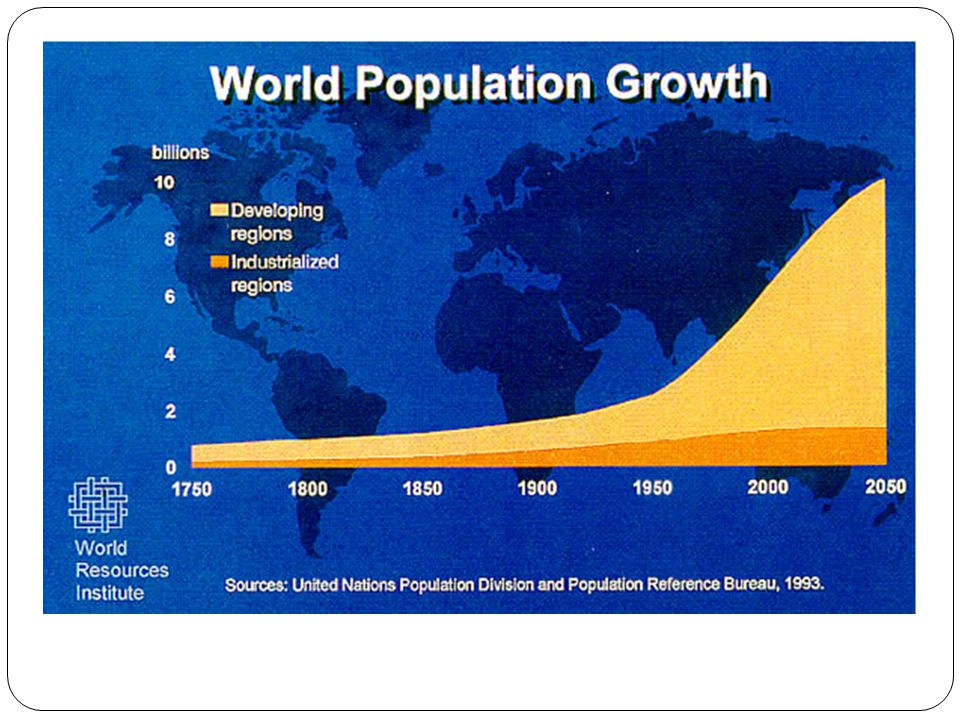
Human Population Growth

39
-

40
Growth Rate What is the formula for finding natural increase (growth rate)? r = b – d r = 26/ /1000 r = – = 0.021 0.021 X 100 = 2.1% per year OR (the easy way) r = 26/10 - 5/10 r = = 2.1 or 2.1% per year
 r = 26/10 - 5/10. r = = 2.1. or 2.1% per year.")
41
Doubling Time Rule of 70 – determines the number of years it will take a country’s population to double. Doubling time = 70/%growth rate Growth rate = 70/doubling time Let’s practice: A country’s growth rate is 1.5%. How many years will it take that country’s population to double? 70/1.5 = 46.7 years

42
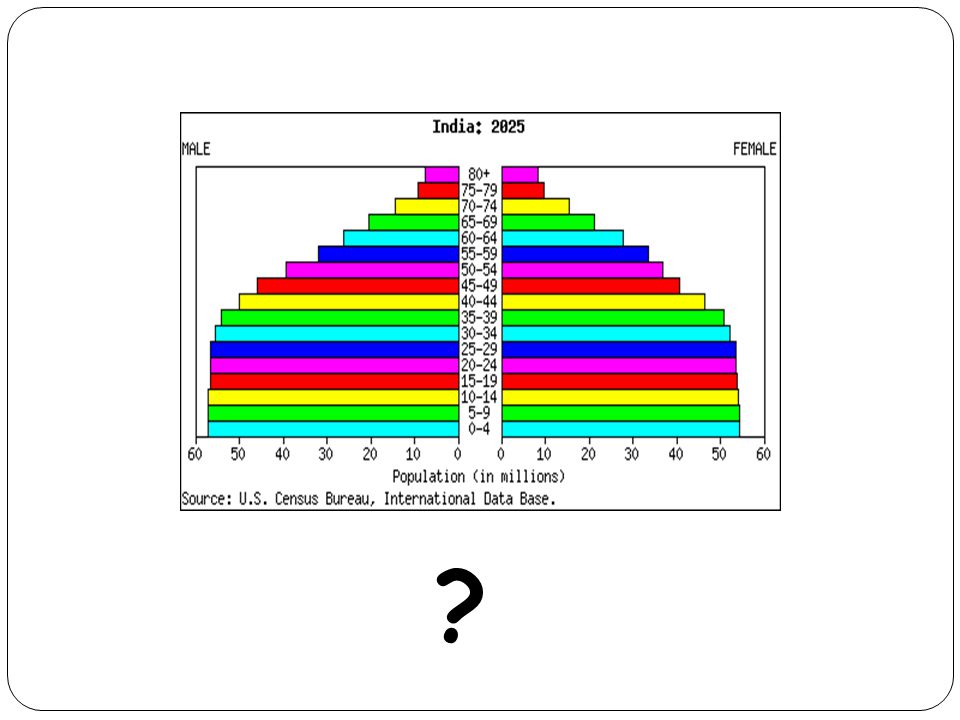
How do population pyramids help us learn about population?

43
POST-REPRODUCTIVE REPRODUCTIVE PRE-REPRODUCTIVE

44
Population in millions
Population pyramids are used to show information about the age and gender of people in a specific country. Male Female There is also a high Death Rate. In this country there is a high Birth Rate Population in millions This population pyramid is typical of countries in poorer parts of the world (LEDCs.)
")
45
In some LEDCs the government is encouraging couples to have smaller families. This means the birth rate has fallen.

46
Population in millions
Male Female Population in millions The largest category of people were born about 40 years ago. In this country the number of people in each age group is about the same. In this country there is a low Birth Rate and a low Death Rate. This population pyramid is typical of countries in the richer parts of the world (MEDCs.)
")
47
Population in millions
Male Female Population in millions In the future the elderly people will make up the largest section of the population in this country. In this country the birth rate is decreasing. This is happening more and more in many of the world’s richer countries.

48
Population in thousands
Male Female Population in thousands This country has a large number of temporary workers. These are people who migrate here especially to find a job.

49
Population pyramid for Mozambique.
Population pyramid for Iceland.

50
What happens next?

52
What is going to happen to Japan’s population in the future?
Why does this matter?

53
?

54
?
55
?

56
You decide!

59
What is the Demographic Transition?
The shift from high to low mortality and fertility A sign of socio-economic progress? Time Natural increase Birth rate Death rate Note: Natural increase is produced from the excess of births over deaths. The shift from high mortality and fertility to low mortality and fertility is known as the “demographic transition.” It is based on the experience of Western Europe, in particular England and Wales. This model was first described by the American demographer Warren Thompson in 1929. In 1945, Frank W. Notestein further developed this theory and suggested that there was a relationship between population change and industrialization. A debate continues questioning if population growth must decline for economic development or if economic progress (or industrialization) leads to slower population growth. In light of this debate, the completion of the demographic transition has come to be associated with socioeconomic progress. [FYI – The factors that drive childbearing trends—such as the economy, education, gender relations, and access to family planning—are numerous and complex. These same factors are signs of socioeconomic development.]
 leads to slower population growth. In light of this debate, the completion of the demographic transition has come to be associated with socioeconomic progress. [FYI – The factors that drive childbearing trends—such as the economy, education, gender relations, and access to family planning—are numerous and complex. These same factors are signs of socioeconomic development.]")
60
Demographic Transition
Read pages What is the definition of demographic transition? Identify the characteristics of each stage. Stage Description First Stage – Pre Industrial Second Stage -- Transitional Third Stage -- Industrial Fourth Stage – Post Industrial

61
Demographic Transition in Sweden and Mexico
Sources: B.R. Mitchell, European Historical Statistics (1976): table B6; Council of Europe, Recent Demographic Developments in Europe 2001 (2001): tables T3.1 and T4.1; CELADE, Boletin demografico 69 (2002): tables 4 and 7; Francisco Alba-Hernandez, La poblacion de Mexico (1976): 14; and UN Population Division, World Population Prospects: The 2002 Revision (2003): 326. Births/Deaths per 1,000 1750 Compare the transitions between these two countries to the classic model. Why are the two countries so different? [A: The short answer is that Sweden’s transition occurred gradually over 150 years. Mexico experienced rapid declines in death rates due to rapid implementation of better health care and sanitation technologies. The result was that Mexico’s population boomed during this period. It took time for the decline in birth rates to catch up. At the same time, this boom created its own momentum as all these new families have children of their own. Eventually Mexico’s population will likely stabilize (or even shrink), but at a much greater overall population. This pattern was repeated in many nations in the 20th Century, fueling a global population explosion. However, we’re also seeing in several countries – including Sweden – birth rates have dropped below death rates leading to population decline in most of Europe, Japan, and some other nations.]
: table B6; Council of Europe, Recent Demographic Developments in Europe 2001 (2001): tables T3.1 and T4.1; CELADE, Boletin demografico 69 (2002): tables 4 and 7; Francisco Alba-Hernandez, La poblacion de Mexico (1976): 14; and UN Population Division, World Population Prospects: The 2002 Revision (2003): 326. Births/Deaths per 1, Compare the transitions between these two countries to the classic model. Why are the two countries so different [A: The short answer is that Sweden’s transition occurred gradually over 150 years. Mexico experienced rapid declines in death rates due to rapid implementation of better health care and sanitation technologies. The result was that Mexico’s population boomed during this period. It took time for the decline in birth rates to catch up. At the same time, this boom created its own momentum as all these new families have children of their own. Eventually Mexico’s population will likely stabilize (or even shrink), but at a much greater overall population. This pattern was repeated in many nations in the 20th Century, fueling a global population explosion. However, we’re also seeing in several countries – including Sweden – birth rates have dropped below death rates leading to population decline in most of Europe, Japan, and some other nations.]")
Similar presentations