Download presentation
Presentation is loading. Please wait.

1
Chapter 4 Ecosystems & Energy

2
Your Responsibilities for Ch.4
Ecosystems & Energy Introduction p Photosynthesis & Respiration p.69 Life Without the Sun, p.69-70 How Humans Have Affected the Antarctic Food Web, p.74-75 Envirobriefs p74, 75 hint..hint..

3
BIOLOGY REVIEW….. Biotic Abiotic Ecology Species Population Community Ecosystem Landscape Biosphere

5
Energy of Life Pages 67-69

6
Energy Energy = capacity or ability to do work. Forms:
Chemical = stored in chemical bonds of molecules (food) Radiant / Solar = transported from the sun (electromagnetic waves) Heat = thermal energy that flows from an object with a higher temp to one with a lower temp (source to sink!)
 Radiant / Solar = transported from the sun. (electromagnetic waves) Heat = thermal energy that flows from an object with a higher temp to one with a lower temp. (source to sink!)")
7
Mechanical = movement of matter
Nuclear = inside atomic nuclei Electrical = flows as charged particles

9
Energy Usually expressed as units of work (kJ) or units of heat energy (kcal) 1kcal = kJ Can exist as potential energy or kinetic energy Energy can change forms! Study of energy & its transformations = THERMODYNAMICS!

10
Thermodynamics Some lingo… Three types of systems:
“System” refers to the object being studied. “Surroundings” are… You guessed it… the surroundings! Three types of systems: Closed System Open System Isolated …. Does that exist??? NOTE: systems are relative to what you’re studying…

11
1st Law of Thermodynamics
Energy cannot be created or destroyed, but it can be transformed. The energy of a system and its surroundings is always constant… Energy can flow in/out of the system, but overall, the entire system’s energy remains the same. How is it transformed? Ex: Chemical energy (stored in food) is transformed into mechanical energy (for us to move).
 is transformed into mechanical energy. (for us to move).")
12
2nd LAW of THERMODYNAMICS
When energy is transformed, some usable energy is lost to the environment as heat. Less-usable energy is more diffuse/disorganized. Entropy = measure of disorder or randomness. Organized, usable energy = _____ entropy Disorganized, unusable energy = _____ entropy (heat) Entropy is always increasing over time NO process requiring energy transformation is ever 100% efficient. Much of it is dispersed as heat. Ex: automobile engine is 20-30% efficient Organisms are highly organized and as they grow they remain organized. Why doesn’t this refute the 2nd law?
 Entropy is always increasing over time NO process requiring energy transformation is ever 100% efficient. Much of it is dispersed as heat. Ex: automobile engine is 20-30% efficient. Organisms are highly organized and as they grow they remain organized. Why doesn’t this refute the 2nd law")
13
A cup of hot coffee left on a table eventually cools, but a cup of cool coffee in the same room never gets hot by itself…. The high-temperature energy of the coffee is degraded (transformed into a less useful form at a lower temperature) once it is transferred to the surrounding air. How does cartoon exhibit entropy?
 once it is transferred to the surrounding air. How does cartoon exhibit entropy")
14
Photosynthesis & Cellular Respiration…
They are one big cycle!!! PHOTOSYNTHESIS 6CO H2O + Radiant Energy C6H12O6 + 6H2O + 6O2 C6H12O6 + 6H2O + 6O2 Energy + 6CO H2O CELLULAR RESPIRATION

15
Photosynthesis v.s. Chemosynthesis

16
??? QUESTIONS

17
The Flow of Energy Through Ecosystems
Pages 70-73

18
Who’s Smarter than Me??? You have received a chart of vocabulary terms. You have 5 minutes to write a short definition of each term that you already know. Leave all others blank! Go! Now, spend the next 5 minutes finding people who are “smarter than you”… Find someone who knows one definition you don’t.

19
Here’s your little vocabulary lesson…
Be ready… I’m going to fly through this!!!

20
Flow of Energy through Ecosystems
ENERGY FLOW = movement of energy in a one-way direction through an ecosystem. PRODUCER = manufacture complex organic molecules from simple inorganic substances (CO2 and H2O), usually using radiant energy. AUTOTROPH = same as a producer. Auto = “self” Troph = “nourishment” Use either photosynthesis or chemosynthesis
, usually using radiant energy. AUTOTROPH = same as a producer. Auto = self Troph = nourishment Use either photosynthesis or chemosynthesis.")
21
Flow of Energy through Ecosystems
CONSUMER = use bodies of other organisms as a source of food energy and bodybuilding materials. (ex: animals) HETEROTROPH = same as a consumer. Hetero = “different” Troph = “nourishment” 3 types: PRIMARY CONSUMER / HERBIVORE SECONDARY CONSUMER TERTIARY CONSUMER CARNIVORE = 2° and 3° consumers OMNIVORE = eats plants & animals
 HETEROTROPH = same as a consumer. Hetero = different Troph = nourishment 3 types: PRIMARY CONSUMER / HERBIVORE. SECONDARY CONSUMER. TERTIARY CONSUMER. CARNIVORE = 2° and 3° consumers. OMNIVORE = eats plants & animals.")
22
Flow of Energy through Ecosystems
DETRITUS = organic matter that includes animal carcasses, leaf litter, and feces. DETRITUS FEEDER / DETRITIVORE Ex: snails, crabs, clams, worms, termites, beetles, millipedes DECOMPOSER / SAPROTROPH = microbial heterotrophs that break down dead organic material and use the decomposition products for energy. Release simple inorganic molecules (CO2 + mineral salts) that producers reuse. Sapro = “rotten” Troph = “nourishment” Ex: bacteria and fungi Difference between Detritivore and Decomposer: Detritivores actually EAT dead/decaying matter. Decomposers secrete enzymes that digest the organic matter, and then absorb the remaining molecules for nutrition.
 that producers reuse. Sapro = rotten Troph = nourishment Ex: bacteria and fungi. Difference between Detritivore and Decomposer: Detritivores actually EAT dead/decaying matter. Decomposers secrete enzymes that digest the organic matter, and then absorb the remaining molecules for nutrition.")
23
3 Ecological Categories
Producers Consumers Decomposers

24
Flow of Energy through Ecosystems
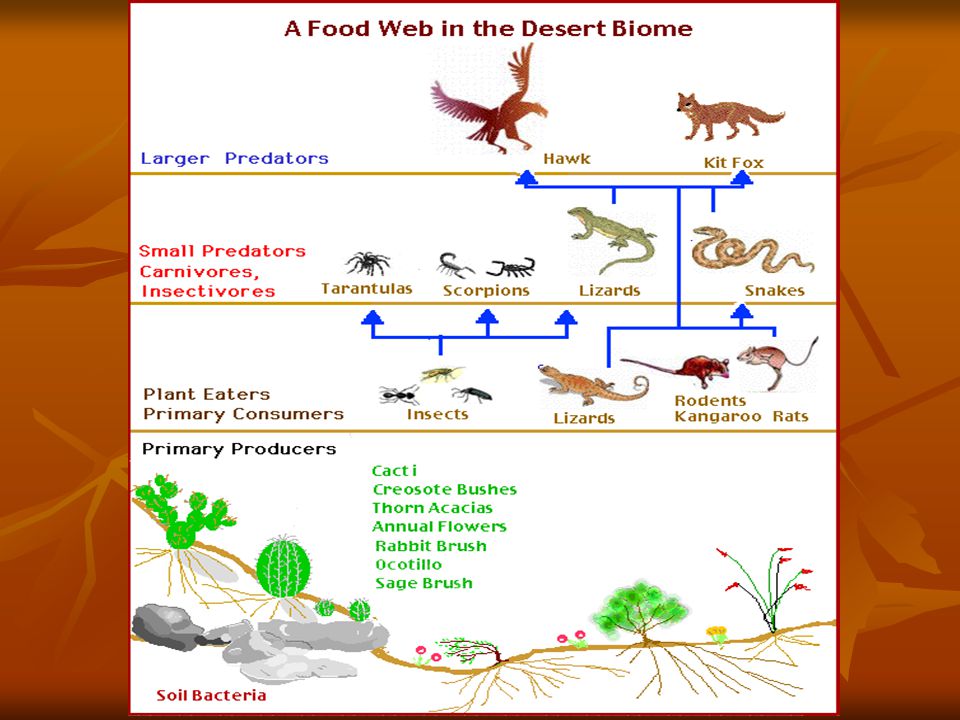
FOOD CHAIN = energy from food passes from one organism to the next in a sequence. TROPHIC LEVEL = each level in the chain.

25
Flow of Energy through Ecosystems
Simple foodchains are rare in nature! Why?? FOOD WEB = complex of interconnected food chains in an ecosystem. Food webs are much more realistic than food chains. Note: Energy flow is always linear. Energy lost as heat is unavailable to other organisms.

27
You should be READING through the CHAPTER!!!
Don’t Forget…. You should be READING through the CHAPTER!!!

28
BREAK!!! BRAIN

29
Ecological Pyramids Pages 75-76

30
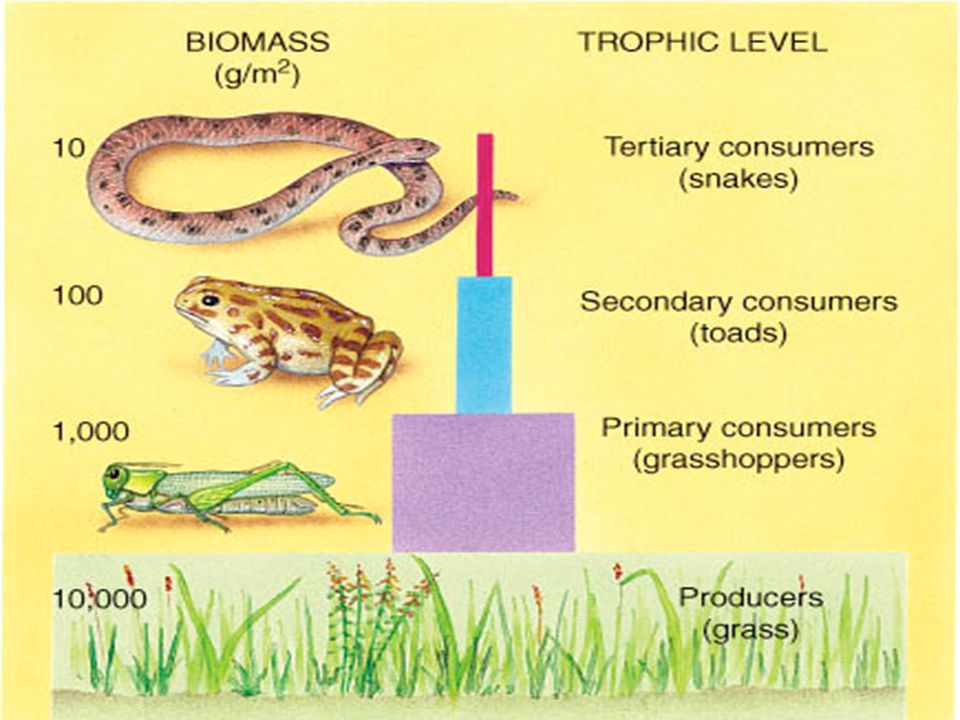
Ecological Pyramids A diagram that shows the relative amount of energy in different trophic levels 3 types:

31
Energy Pyramid Total Energy at each trophic level
Energy is lost as: heat, life functions, waste, not all parts of each animal/plant are consumed Ecological Efficiency: the percentage of energy transferred from one trophic level to another LAW of 10% : when all the energy loss is added up, only 10% of the energy entering one trophic level forms new biomass Reason for 5 or less trophic levels in a web

32
Total energy at each trophic level.
Energy lost as: Heat Life Functions Waste Not all parts consumed

34
Biomass Pyramid Shows the DRY weight of organic matter in each trophic level Represents the chemical energy stored in the organic matter of a trophic level. Usually follows the 10% law 1/10 Lbs Pike- Tertiary consumers Bass- Secondary consumers 1 Lb Minnows- Secondary consumers 10 Lbs Copepods- Primary consumers 100 Lbs 1000 Lbs Algae- producer

36
Pyramid of Numbers Total number of organisms at each level
Decreases as you go up trophic levels 1 Hawk 5 Woodpeckers 40 Grasshoppers 175 blades of grass

37
1000 metric tons of grass supports:
27,000,000 grasshoppers 90,000 Frogs 300 Trout 1 person for 30 days If… You eliminate trout from the flow, 30 people could survive for 30 days by consuming 100 frogs a day You eliminate frogs from the flow, 900 people could survive for 30 days by eating 1,000 grasshoppers a day.

38
NO YES YES Exceptions? Are there exceptions to: Pyramid of Energy?
Pyramid of Biomass? Pyramid of Numbers? NO YES YES

39
ARE THERE ANY EXCEPTIONS
TO THIS PYRAMID???

40
Productivity of Producers
Pages 76-78

41
Productivity of Producers
Gross Primary Productivity (GPP) The rate at which energy is captured during photosynthesis. But… plants must respire to use that energy for metabolic processes… So, the plant’s respiration acts as a drain on its photosynthesis. Net Primary Productivity (NPP) The rate at which organic matter is actually incorporated into plant tissues for growth. NPP = GPP – RP Net Primary Gross Primary Plant Productivity = Productivity Respiration (plant growth per unit (total photosynthesis per (per unit area area per unit time) unit area per unit time) per unit time)
 The rate at which energy is captured during photosynthesis. But… plants must respire to use that energy for metabolic processes… So, the plant’s respiration acts as a drain on its photosynthesis. Net Primary Productivity (NPP) The rate at which organic matter is actually incorporated into plant tissues for growth. NPP = GPP – RP. Net Primary Gross Primary Plant. Productivity = Productivity - Respiration. (plant growth per unit (total photosynthesis per (per unit area. area per unit time) unit area per unit time) per unit time)")
42
GPP & NPP Only the energy represented by NPP is available for consumers, and remember: they only use a portion of it! The Earth’s total NPP is the upper limit determining the planet’s carrying capacity for all species. GPP & NPP are expressed as: Energy per unit area per unit time (kcal/m2/yr) Dry weight (g carbon/m2/yr) IMPORTANT!
 Dry weight (g carbon/m2/yr) IMPORTANT!")
43
Humans & Ecosystem Productivity
Tropical Rainforests Most nutrients are in the vegetation, not in the soil. The land will therefore lose nutrients quickly when they’re cleared for growing crops. Then, it’s $$$$$$ to add lots of fertilizers! Agricultural Land Highly modified and managed Goal: increase the NPP and biomass by adding water and nutrients like nitrates and phosphates. Does it work?? Humans use, waste, or destroy ~27% of Earth’s total potential NPP, and 40% of Earth’s land NPP.

44
NPP for selected ecosystems
Not all ecosystems have the same NPP. Some are much more productive than others! WHAT MONTH IS THIS? WHAT MONTH IS THIS?

45
SECONDARY PRODUCTIVITY

46
Calculating Ecosystem Productivity
First, read the paragraphs and understand the pyramid and food web at the bottom of the page. Then, spend 10 minutes working on the calculations BY YOURSELF. The formulas are included to help you. Plug and Chug! Then, you’ll get time to work with a neighbor to understand the calculations. Finish ALL of these calculations for homework.

47
ECOSYSTEM PRODUCTIVITY
Step by Step For Class Review

48
Productivity and Respiration in Three Theoretical Ecosystems
Useful formulas: Net Primary Productivity (NPP) = Gross Primary Productivity (GPP) - Plant Respiration (Rp) Net Ecosystem Productivity (NEP) = NPP - Consumer Respiration (Rc) Net Ecosystem Respiration (R) = Rp + Rc
 = Gross Primary Productivity (GPP) - Plant Respiration (Rp) Net Ecosystem Productivity (NEP) = NPP - Consumer Respiration (Rc) Net Ecosystem Respiration (R) = Rp + Rc.")
49
Which ecosystem has the greatest gross primary productivity?
....the greatest net primary productivity? …..the greatest net ecosystem productivity? 2. Which ecosystem has the highest ratio of productivity to respiration? ….has the lowest? 3. What does a ratio of 1.0 mean? This means that 100% of the ecosystem’s production is being used in respiration… basically, the ecosystem is maintaining the status quo, neither growing nor shrinking. Deciduous Forest Alfalfa Field Alfalfa Field Alfalfa Field Deciduous Forest

50
4. What source(s) of respiration has been omitted from the table?
3. The forest and prairie ecosystems are unmanaged, and the alfalfa field is managed for agricultural purposes. What are some of the differences between agricultural and unmanaged ecosystems? Agricultural lands are managed to drastically increase production so that they can be harvested for a profit. Lands that are unmanaged will naturally have a lower productivity, because nobody is there to help increase the production. Managed lands will have lower consumption rates so that the net production is higher. 4. What source(s) of respiration has been omitted from the table? Decomposers 5. If this (these) factor(s) were taken into account, how would the GPP/R be affected? Considering decomposers’ respiration, the R would be higher, causing the Growth Efficiency (GPP/R) to be lower.
 of respiration has been omitted from the table Decomposers. 5. If this (these) factor(s) were taken into account, how would the GPP/R be affected Considering decomposers’ respiration, the R would be higher, causing the Growth Efficiency (GPP/R) to be lower.")
51
1. Calculate the net primary productivity if the gross productivity of the grasses is 500,000 kJ/m2/yr and their annual respiration is 340,000 kJ/m2/yr. NPP = ? GPP = 500,000 kJ/m2/yr RP = 340,000 kJ/m2/yr NPP = GPP – RP NPP = 500,000 kJ/m2/yr – 340,000 kJ/m2/yr NPP = 160,000 kJ/m2/yr

52
2. Calculate the net ecosystem productivity if the gross productivity of the grasses is 500,000 kJ/m2/yr and the ecosystem organisms’ respiration rates are as follows: Grasses: 340,000 kJ/m2/yr Mice: 80,000 kJ/m2/yr Cats: 60,000 kJ/m2/yr Wolves: 40,000 kJ/m2/yr Total R = RP = 340,000 kJ/m2/yr RC = 180,000 kJ/m2/yr NEP = ? GPP = 500,000 kJ/m2/yr RC = 180,000 kJ/m2/yr NEP = GPP – R NEP = 500,000 kJ/m2/yr – 520,000 kJ/m2/yr NEP = -20,000 kJ/m2/yr 520,000 kJ/m2/yr OR… NEP = NPP – RC NEP = (GPP – RP) - RC NEP = 500, , ,000 NEP = -20,000 kJ/m2/yr
 - RC. NEP = 500, , ,000. NEP = -20,000 kJ/m2/yr.")
53
3. What does your answer to the previous question say about the ecosystem? What’s happening to it?
NPP is GPP – RP. So, since the NEP is negative, the ecosystem is using more than it is producing. An ecosystem in such a state is losing biomass.

54
2. Explain how there can be two equations for NEP in the box above.
The first equation includes the RP in the NPP The second equation is putting it in a different place: in the total Respiration, which is R = RP + RC

55
3. Calculate the % trophic level efficiency of the wolves if the productivity of the cats eaten by the wolves is 96,000 kJ/m2/yr and the productivity of the wolves is 9,000 kJ/m2/yr. % TLE = ? Production(cats) = 96,000 kJ/m2/yr Production(wolves) = 9,000 kJ/m2/yr Consumption(wolves) = Production(cats) % TLE = ( Prod(wolves) / Cons(wolves) ) * 100 % TLE = ( 9,000 kJ/m2/yr / 96,000 kJ/m2/yr ) * 100 % TLE = 9.38%
 = 96,000 kJ/m2/yr. Production(wolves) = 9,000 kJ/m2/yr. Consumption(wolves) = Production(cats) % TLE = ( Prod(wolves) / Cons(wolves) ) * 100. % TLE = ( 9,000 kJ/m2/yr / 96,000 kJ/m2/yr ) * 100. % TLE = 9.38%")
56
4. What is the % growth efficiency of the mouse population in this ecosystem if they consume 50,800 kJ/m2/yr of grass and grow (produce) 1500 kJ/m2/yr? % GE = ? Consumption(mouse) = 50,800 kJ/m2/yr of grass Production(mouse) = 1,500 kJ/m2/yr % GE = ( Prod(wolves) / Cons(wolves) ) * 100 % GE = (1,500 kJ/m2/yr /50,800 kJ/m2/yr)*100 % GE = 2.95%
 = 50,800 kJ/m2/yr of grass. Production(mouse) = 1,500 kJ/m2/yr. % GE = ( Prod(wolves) / Cons(wolves) ) * 100. % GE = (1,500 kJ/m2/yr /50,800 kJ/m2/yr)*100. % GE = 2.95%")
57
Steps 1. Convert 250 kg g 2. Find 30% & 70% of that
1. What is the energy content of a tree that weighs 250 kg and is composed of 30% roots and 70% wood? Steps 1. Convert 250 kg g 2. Find 30% & 70% of that 3. Convert roots g & wood g to kJ/g using the chart 4. Add kJ together

58
STEP 1 250 Kg g = 250,000g tree Kg STEP 2 250,000 (.70) = 175,000 g wood 250,000 (.30) = 75,000 g Roots
 = 75,000 g Roots.")
59
STEP 3 75,000 g 19 kJ = 1,425,000 kJ X g 175,000g 17kJ = 2,975,000 kJ X g STEP 4 1,425,000 kJ + 2,975,000 kJ= 4,400,000 kJ

60
Any activity where energy is transformed from one form to another.
2.Give an example of an everyday scenario which demonstrates the First Law of Thermodynamics. EXPLAIN your answer. Any activity where energy is transformed from one form to another.

61
3.Give an example of an everyday scenario which demonstrates the Second Law of Thermodynamics. EXPLAIN your answer. Anything you do that gives off heat

62
4.If the production of herbivorous rabbits is 1100kJ/m2/year, and the production of the grasses they feed upon annually is 12,000 kJ/m2, then what is the % trophic level efficiency? 1100 kJ/m2/yr (100) = % (about 10 % energy) 12,000 kJ/m2/yr
 = 9.16% (about 10 % energy) 12,000 kJ/m2/yr.")
63
5. The biological production and biomass at each higher tropic level decreases. What factors account for this? Loss of energy due to biological functions/work

64
Old slides from this point on….

65
Photosynthesis Light energy from the sun is transformed into chemical energy in carbohydrates. Chlorophyll Green pigment that absorbs radiant energy. Most of the Chlorophyll is green, so what does it do with the light? Reflects green back to you, absorbs all other colors. 6CO H2O + Radiant Energy C6H12O6 + 6H2O + 6O2

66
Why Photosynthesis??? Who photosynthesizes?
Plants Some bacteria Algae A FEW Animals Why do these organisms photosynthesize? To make chemical energy for themselves Recall from Bio: Carbohydrates (sugars) = quick energy! To make chemical energy for other organisms who eat them as food
 = quick energy! To make chemical energy for other. organisms who eat them as food.")
67
C6H12O6 + 6H2O + 6O2 6CO2 + 12 H2O + Energy
Cellular Respiration Chemical energy in glucose & food is transformed into energy to be used for biological work (growing, reproduction, movement, etc) ALL ORGANISMS RESPIRE! But some organisms don’t use O2 C6H12O6 + 6H2O + 6O2 6CO H2O + Energy
 ALL ORGANISMS RESPIRE! But some organisms don’t use O2. C6H12O6 + 6H2O + 6O2 6CO H2O + Energy.")
Similar presentations


 Consumer:>")


