Download presentation
Presentation is loading. Please wait.

1
Multi-Dimensional Data Visualization
cs5764: Information Visualization Chris North

2
Review What is the Visualization Pipeline?
What are the steps of Visual Mapping? What is the Info Vis Mantra?

3
Information Types Multi-dimensional: databases,… 1D: timelines,…
2D: maps,… 3D: volumes,… Hierarchies/Trees: directories,… Networks/Graphs: web, communications,… Document collections: digital libraries,…

4
The Simple Stuff Univariate Bivariate Trivariate

5
Univariate Dot plot Bar chart (item vs. attribute) Tukey box plot
Histogram

6
Bivariate Scatterplot

7
Trivariate 3D scatterplot, spin plot 2D plot + size (or color…)
")
8
Multi-Dimensional Data
Each attribute defines a dimension Small # of dimensions easy Data mapping, Cleveland’s rules What about many dimensional data? n-D What does 10-D space look like?

9
Projection map n-D space onto 2-D screen

10
Glyphs: Chernoff Faces
10 Parameters: Head Eccentricity Eye Eccentricity Pupil Size Eyebrow Slope Nose Size Mouth Vertical Offset Eye Spacing Eye Size Mouth Width Mouth Openness

11
Glyphs: Stars d1 d2 d7 d3 d6 d4 d5

12
Multiple Views with Brushing-and-linking

13
Scatterplot Matrix All pairs of attributes Brushing and linking

14
… on steroids

15
Different Arrangements of Axes
Axes are good Lays out all points in a single space “position” is 1st in Cleveland’s rules Uniform treatment of dimensions Space > 3D ? Must trash orthogonality

16
Parallel Coordinates Inselberg, “Multidimensional detective” (parallel coordinates)
")
17
Parallel Coordinates Bag cartesian (0,1,-1,2)= x y z w
= x y z w")
18
Star Plot 1 8 2 7 3 4 6 5 Parallel Coordinates with axes arranged radially

19
Star Coordinates Kandogan, “Star Coordinates”

20
Star Coordinates Cartesian Star Coordinates
P=(v1,v2,v3,v4,v5,v6,v7,v8) P=(v1, v2) d1 d1 d8 d2 v3 v4 p v2 v1 v5 v2 d7 d3 d2 v1 p v8 v6 d6 v7 Mapping: Items → dots Σ attribute vectors → (x,y) d4 d5
 P=(v1, v2) d1. d1. d8. d2. v3. v4. p. v2. v1. v5. v2. d7. d3. d2. v1. p. v8. v6. d6. v7. Mapping: Items → dots. Σ attribute vectors → (x,y) d4. d5.")
21
Analysis

22
Table Lens Rao, “Table Lens”

23
FOCUS / InfoZoom Spenke, “FOCUS”

24
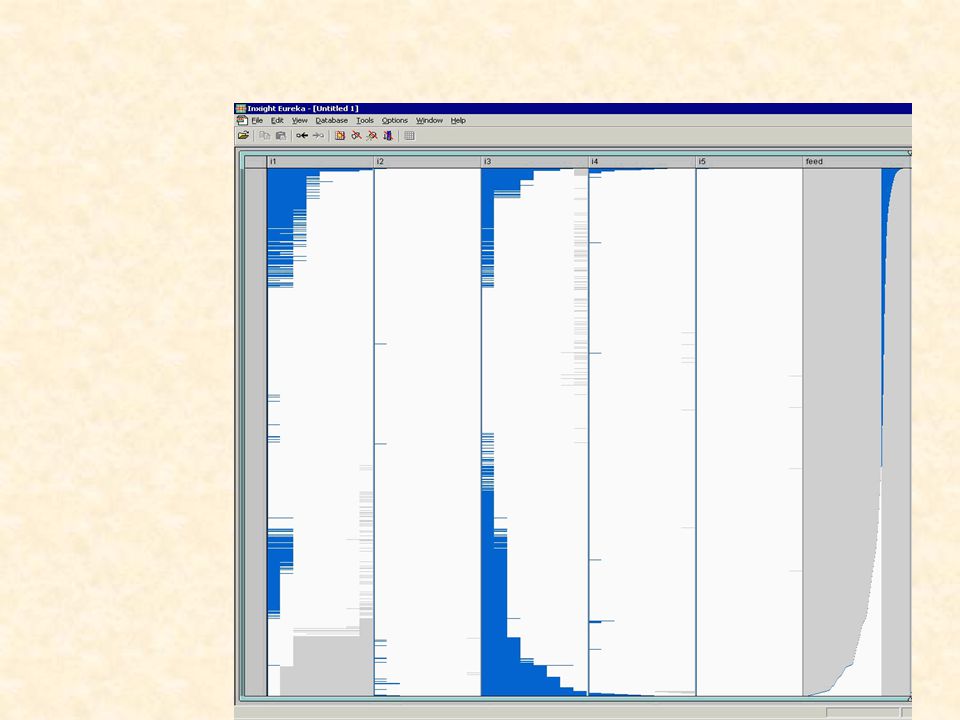
VisDB Keim, “VisDB”

25
Pixel Bar Charts Keim
![]()
26
Comparison of Techniques

27
Comparison of Techniques
ParCood: <1000 items, <20 attrs Relate between adjacent attr pairs StarCoord: <1,000,000 items, <20 attrs Interaction intensive TableLens: similar to par-coords more items with aggregation Relate 1:m attrs (sorting), short learn time Visdb: 100,000 items with 10 attrs Items*attrs = screenspace, long learn time, must query Spotfire: <1,000,000 items, <10 attrs (DQ many) Filtering, short learn time
, short learn time. Visdb: 100,000 items with 10 attrs. Items*attrs = screenspace, long learn time, must query. Spotfire: <1,000,000 items, <10 attrs (DQ many) Filtering, short learn time.")
28
Multi-Dimensional Functions
cs5764: Information Visualization Chris North

29
Multi-Dimensional Functions
y = f(x1, x2, x3, …, xn) Continuous: E.g. y = x13 + 2x22 - 9x3 Discrete: xi are uniformly sampled in a bounded region E.g. xi = [0,1,2,…,100] E.g. measured density in a 3D material under range of pressures and room temperatures.
 Continuous: E.g. y = x13 + 2x22 - 9x3. Discrete: xi are uniformly sampled in a bounded region. E.g. xi = [0,1,2,…,100] E.g. measured density in a 3D material under range of pressures and room temperatures.")
30
Relations vs. Functions
R(A, B, C, D, E, F) All dependent variables (1 ind.var.?) Sparse points in multi-d dep.var. space Functions: R(A, B, C, D, E, F, Y) : Y=f(A, B, C, D, E, F) Many independent variables Defined at every point in multi-d ind.var. space (“onto”) Huge scale: 6D with 10 samples/D = 1,000,000 data points
 All dependent variables (1 ind.var. ) Sparse points in multi-d dep.var. space. Functions: R(A, B, C, D, E, F, Y) : Y=f(A, B, C, D, E, F) Many independent variables. Defined at every point in multi-d ind.var. space ( onto ) Huge scale: 6D with 10 samples/D = 1,000,000 data points.")
31
Multi-D Relation Visualizations…
Don’t work well for multi-D functions Example: Parallel coords 5D func sampled on 1-9 for all ind.vars.

32
Typically want to encode ind.vars. as spatial attrs

33
1-D: Easy b = f(a) a x b y b a
 a x b y b a")
34
2-D: Easy c = f(a, b) Height field: a x b y c z c b a
 Height field: a x b y c z c b a")
35
2-D: Easy c = f(a, b) Heat map: a x b y c color b a c
 Heat map: a x b y c color b a c")
36
3-D: Hard d = f(a, b, c) Color volume: a x b y c z d color
What’s inside? c b a

37
4D: Really Hard y = f(x1, x2, x3, x4, …, xn)
What does a 5D space look like? Approaches: Hierarchical axes (Mihalisin) Nested coordinate frames (Worlds within Worlds) Slicing (HyperSlice) Radial Focus+Context (PolarEyez, Sanjini)
 Nested coordinate frames (Worlds within Worlds) Slicing (HyperSlice) Radial Focus+Context (PolarEyez, Sanjini)")
38
Hierarchical Axes 1D view of 3D function: (Mihalisin et al.)
f(x1, x2, x3) x3 x2 x1
 x3. x2. x1.")
39
as in TableLens 5D 9 samp/D

41
Hierarchical Axes 2D view of 4D function (using heat maps)
y = f(x1, x2, x3, x4) Discrete: xi = [0,1,2,3,4] x3 x1 x2 y = f(x1,x2,0,0) as color x4
 Discrete: xi = [0,1,2,3,4] x3. x1. x2. y = f(x1,x2,0,0) as color. x4.")
42
Hierarchical Axes Scale? For more dimensions:
6d = 3 levels in the 2d approach 10 samples/d = 1,000,000 data points = 1 screen For more dimensions: zoom in on “blocks” reorder dimensions

43
5D 9 sample/D

44
Nested Coordinate Frames
Feiner, “Worlds within Worlds”

45
Slicing Van Wijk, “HyperSlice”

46
Radial Focus+Context Jayaraman, “PolarEyez” infovis.cs.vt.edu x3 x2 x4

47
Comparison Hierarchical axes (Mihalisin):
Nested coordinate frames (Worlds in Worlds) Slicing (HyperSlice): Radial Focus+Context (PolarEyez)
 Slicing (HyperSlice): Radial Focus+Context (PolarEyez)")
48
Comparison Hierarchical axes (Mihalisin):
< 6d by 10 samples, ALL slices, view 2d at a time Nested coordinate frames (Worlds in Worlds) < 5-8d, continuous, no overview, 3d hardware Slicing (HyperSlice): < 10d by 100 samples, 2d slices Radial Focus+Context (PolarEyez) < 10d by 1000 samples, overview, all D uniform, rays
 < 5-8d, continuous, no overview, 3d hardware. Slicing (HyperSlice): < 10d by 100 samples, 2d slices. Radial Focus+Context (PolarEyez) < 10d by 1000 samples, overview, all D uniform, rays.")
49
cs5764: Information Visualization Chris North
Dynamic Queries cs5764: Information Visualization Chris North

50
HomeFinder

51
Spotfire

52
Limitations Scale: “AND” queries only
Scatterplot screen space: 10,000 – 1,000,000 Data structures & algorithms: < 50,000 Poor screen drawing on Filter-out A Solution: Query Previews! “AND” queries only Arbitrary boolean queries? A solution: Filter Flow

53
erases items underneath too
DQ Algorithm Idea: incremental algorithm only deal with data items that changed state When slider moves: Calculate slider delta Search in data structure for data items in the delta region If slider moved inward (filter out): Erase data items from visualization Else slider moved outward (filter in): Draw data items on visualization Problem! Overlapped items, erases items underneath too
: Erase data items from visualization. Else slider moved outward (filter in): Draw data items on visualization. Problem! Overlapped items, erases items underneath too.")
54
DQ Data Structures (1) Sorted array of the data for each slider
Need counter for each data item = # sliders that filter it Attribute Explorer visualizes these counters too! O(delta) Year: Delta
 Year: Delta.")
55
DQ Data Structures (2) Multi-dimensional data structure
E.g.: K-d tree, quad-tree, … Recursively split space, store in tree structure Enables fast range search, O()
")
56
DQ Data Structures (2) Multi-dimensional data structure
E.g.: K-d tree, quad-tree, … Recursively split space, store in tree structure Enables fast range search, O(logn) Delta
 Delta.")
57
Erasure Problem Each pixel has counter = number of items Z-buffer?
Can visualize this for density! Z-buffer? Redraw local area only
![]()
58
Filter-Flow Betty Catherine Edna Freda Grace Hilda Judy Marcus Tom

59
Influence/Attribute Explorer
Tweedie, Spence, “Externalizing Abstract Mathematical Models” (Influence/Attribute Explorer)
")
60
Query Previews Doan, “Query Previews”

Similar presentations