Download presentation
Presentation is loading. Please wait.

1
Are biological variation data fit for puRpose?
Dr Bill Bartlett Joint Clinical Director Diagnostics Group Biochemical Medicine Ninewells Hospital & Medical School NHS Tayside Scotland UK

2
What is their purpose?

3
As a Laboratory Medicine Specialists?
Diagnosis Prognosis Monitoring Screening Assessment of Risk

4
Utility of the result of a measurement depends upon:
The metrology An understanding of its relativity to a point of reference Unusual Change Lot of effort on metrology. Ideas about analytical goals Abnormality dealt with by theory of reference values Biological variation has a role here in that in enables utility of the approach to be identified and allows the quality standards to be set. Much of our work however is about monitoring once diagnosed therefore sinificance of change is an imperative .

5
Sources of Biological Variation
Biological Rhythms (time) Homeostasis Age Sex Ethnicity Pathology Response to Stimuli
 Homeostasis. Age. Sex. Ethnicity. Pathology. Response to Stimuli.")
6
eGFR > 60 in a 30 year old white female: Changing renal function?

7
NEQAS Distribution 740

8
Reference Values Grasbeck & Saris 1969
Introduced the term “reference value”: The mode of generation of such values is known with respect to: - Selection of subjects Assessment of state of health Population characteristics, age, sex, Specimen collection and storage Analytical technique and performance characteristics Data handling techniques.

9
IFCC Expert panel on the Theory of Reference Values
The Concept of Reference Values. 1987;25: The selection of Individuals for the Production of reference values. 1987;25: Preparation of individuals and collection of specimens for the production of reference intervals. 1988;26: Control of analytical variability in the production of reference values. 1991;29: Statistical treatment of collected reference limits. 1987;25: Presentation of observed values related to reference values. 1987;25: J Clin Chem Clin Biochem

10
This looks nice so far , but what is the use of biological variation data?

11
Components of Variance in Clinical Chemistry Measurements
Analytical variance (CVA ). Within Subject biological variance (CVI ). Between Subject biological variance (CVG ).. s2Total = s2Analytical + s2Individual + s2Group
. Within Subject biological variance (CVI ). Between Subject biological variance (CVG ).. s2Total = s2Analytical + s2Individual + s2Group.")
12
Current Applications of BV Data
Setting of analytical goals (CVgoal). Quality specifications for : total allowable error (TEA) Bias (BA ) Evaluating the significance of change in serial results (RCV). Assessing the utility of reference intervals (Index of Individuality). Assessing number of specimens required to estimate homeostatic set points. Choice of specimen type. Timing of specimens.
. Quality specifications for : total allowable error (TEA) Bias (BA ) Evaluating the significance of change in serial results (RCV). Assessing the utility of reference intervals (Index of Individuality). Assessing number of specimens required to estimate homeostatic set points. Choice of specimen type. Timing of specimens.")
13
Comments on Biological Variation Data
These fundamental data have many applications that under-pin our practice. We need to have confidence in the data and understand its limitations. Should we not have standards for their production and characterisation?

14
Identification the nature of biological variation.
What is meant by the term biological variation in the context of clinical biochemistry? A component of the variance in biochemical measurements determined by the physiology of the subjects observed.

16
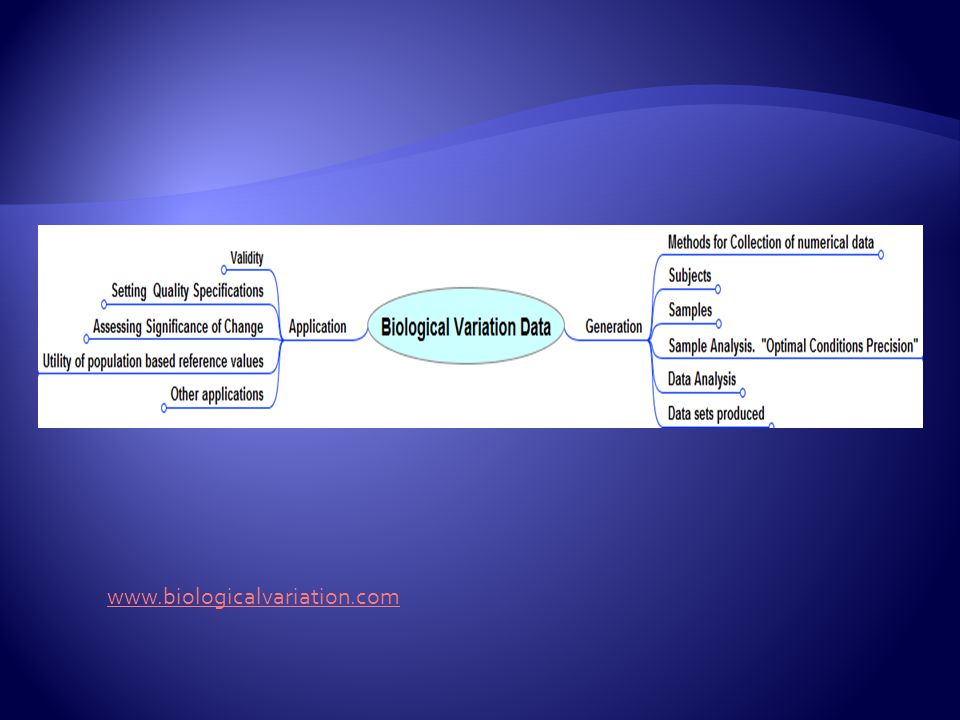
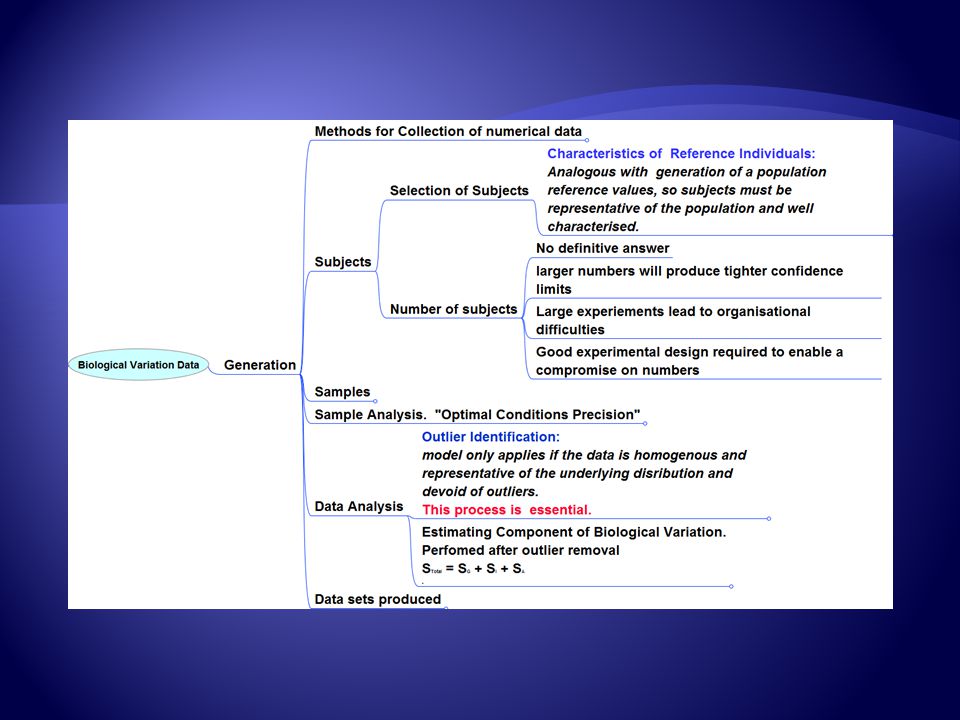
Generation and Application of data on Biological Variation in Clinical Chemistry: -
Fraser CG, Harris EK. Crit Rev Clin Lab Sci 1989:27,(5), Optimal Conditions Precision.
, Optimal Conditions Precision.")
18
Assay Characteristics
Experimental Design Data Analysis Assay Characteristics Uncertainty

19
Need fo a Critical Appraisal Checklist?
Purpose of study Experimental Design Characterisation of the methods Data analysis Confidence limits

20
Biological Variation Data
What are the potential impacts of error in the data?

21
Serum Creatinine Biological Variation Database
CVI = 5.3% CVG = 14.2%

22
Quality Specifications
Desirable CVA < 0.5 x CVI BA< 0.25 x (CVI2 + CVG2)0.5 Tea < 1.65 x 0.5 x CVI x (CVI2 + CVG2)0.5 Optimum CVA < 0.25 x CVI BA< x (CVI2 + CVG2)0.5 Tea < 1.65 x 0.5 x CVI x (CVI2 + CVG2)0.5 Minimum CVA < 0.75 x CVI BA< x (CVI2 + CVG2)0.5 Tea < 1.65 x 0.5 x CVI x (CVI2 + CVG2)0.5
0.5. Tea < 1.65 x 0.5 x CVI x (CVI2 + CVG2)0.5. Optimum. CVA < 0.25 x CVI. BA< x (CVI2 + CVG2)0.5. Tea < 1.65 x 0.5 x CVI x (CVI2 + CVG2)0.5. Minimum. CVA < 0.75 x CVI. BA< x (CVI2 + CVG2)0.5. Tea < 1.65 x 0.5 x CVI x (CVI2 + CVG2)")
23
Number of Specimens to Estimate Homeostatic Set Point
n = [Z * (CVA2 + CVI2)/D] 2 D = % of closeness required
/D] 2 D = % of closeness required")
24
Biological variation data simulator. WWW.biologicalvariation.com

25
CVI = 5.3 % CVG = 14.2% CVA =2.7%

26
CVI = 5.3 % CVG = 14.2%

27
Index of individuality = 0.4

28
Creatinine Biological Variation
Biological Variation Serum Creatinine: Average within subject (CVI) = 4.1% Gowans & Fraser. Ann Clin Biochem 1988:25:
 = 4.1% Gowans & Fraser. Ann Clin Biochem 1988:25:")
29
Biological Variation Serum Creatinine: Gowans & Fraser
Biological Variation Serum Creatinine: Gowans & Fraser. Ann Clin Biochem 1988:25: Quantity Units Group Mean CVI CVG Index of Individuality Serum Creatinine µmol/L Male (7) 83.9 3.4 6.8 0.54 Fraser Female (8) 71.4 4.9 11.8 0.41 µmol/L* Whole (15) 4.1 14.1 0.29 ? 5.3 14.2 0.4 BioV Site µmol/L** N= 20 Female(13) 77 4.7 14.4 0.33 Reinhard et al * Jaffe ** Enzymatic
 Fraser. Female (8) µmol/L* Whole (15) BioV Site. µmol/L** N= 20. Female(13) Reinhard et al. * Jaffe. ** Enzymatic.")
31
M G F

32
M G F CVG =14.1 CVG =4.1

33
Creatinine µmol/L Probability (%) Starting Creatinine 96 µmol/L
 Starting Creatinine 96 µmol/L")
34
Creatinine µmol/L Probability (%) Starting Creatinine 96 µmol/L
 Starting Creatinine 96 µmol/L")
35
Observations: Creatinine
Upper Reference Limits: - Male = 106 µmol/L Female = 80 µmol/L RCV larger for men than for women.

36
Implications. If True: -
Clinically important as disease progression needs to be monitored and appropriate actions taken (e.g. Acute on Chronic Kidney failure). Tighter analytical performance characteristics to be applied for females. Impact will be greater on eGFR
. Tighter analytical performance characteristics to be applied for females. Impact will be greater on eGFR.")
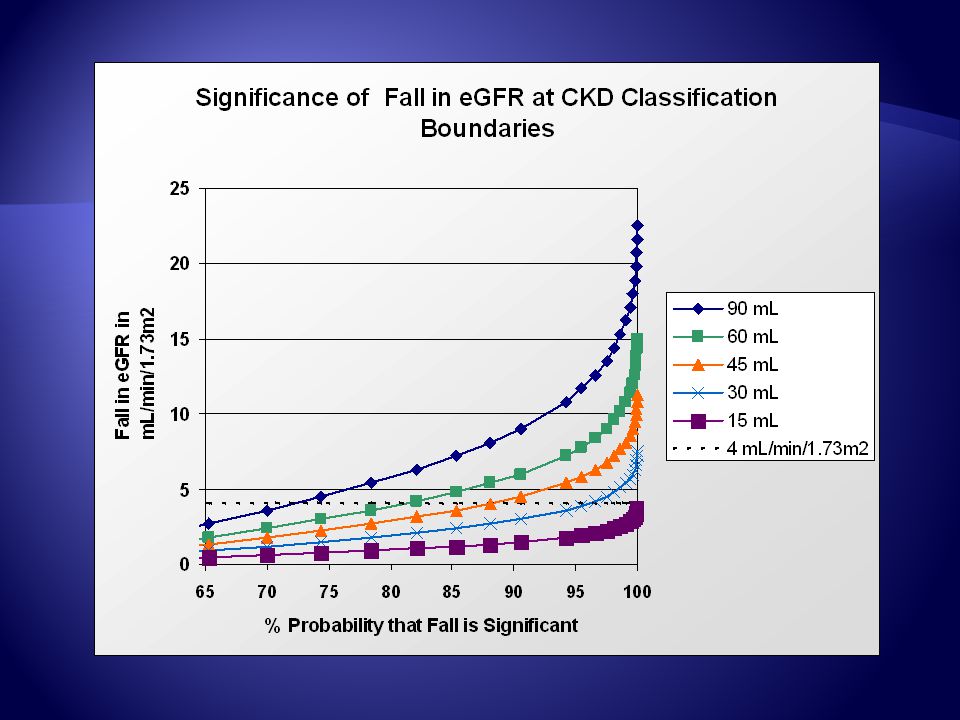
37
RCV for eGFR and Creatinine: -
% Change at % Probability CVI 95% 99% Rise in Creatinine 4.3 10.3% 14.6% 5.3 12.6% 17.8% Fall in eGFR 12.8% 15.4% 6.8 16.0% 22.6% Assumes a CVA = 1%

41
Proposal Use eGFR for initial classification of CKD stage.
Use creatinine to follow patients with RCV indicator flag? More Precise? Difficulty is that there is a suggestion that creatinine CVI is variable in disease. Therefore which CVI?

42
Reported CVI for Serum Creatinine
State of Health CVI Number of Subjects Length of Studies (days) Number Samples/Sub Healthy Median? 4.3 CRF 5.3 17 21 8 Type 1 DM 5.9 27 56 Impaired renal function 6.9 9 2 11 6.5 Post renal transplant 11.5 41 90 Acute MI 13.4 20 4 19.5 CKD children 13.0 54 540 Ricos et al Ann Clin Biochem 2007;44:
 Number Samples/Sub. Healthy Median 4.3. CRF Type 1 DM Impaired renal function Post renal transplant Acute MI CKD children Ricos et al Ann Clin Biochem 2007;44:")
43
Returning question are these conclusions based on fit for purpose data?

44
What are the quality standards for BV Data? What is the uncertainty?
Experimental Design Data Analysis Assay Characteristics What are the quality standards for BV Data? What is the uncertainty?

45
Translated into databases
40 years of data Do the data travel through time Method developments Quality Enough reported detail. Good Design? Commutable Population demographics. Healthy? Diseased? Translated into databases Excellent Resources Granular enough? Data archetype required? The Literature 212 references 319 Constituents: 90 entries based on 1 Paper

46
Time ISSUES Non-complex v complex molecules.
Improved assay specificity. Creatinine PTH

47
PTH Assays Longish history of evolving assay systems with differing analytical performance characteristics and specificities. 1970s – C-Terminal RIA Late 80s – Sandwich IRMA Assay 1990 – 98 Nichols IRMA assays dominate Late 1990s – variety of “intact” sandwich assays on a number of different analytical platforms. 2004 – Bioactive PTH assay Adapted from M Scott Focus 2010

48
Different Assays React With Different Fragments
Much evidence in the literature indicating that assays react to varying extents with the variety of PTH fragments present in Serum. M Scott Focus 2010

49
Impact of assay specificity
If clearance of fragments is not identical in all patients and non diseased patients the apparent biological variation will vary and be assay specific. Assay specificity an important BV qualifier?

50
Two studies Ankrah Tet et al. Ann Clin Biochem 2008;45: PTH = Nichols Advantage 4 Males 6 Females “Normals” Gardham et al . Clin J Am Soc Nephrol ePress May 24th 2010 Abbot Architect Intact PTH Immunotopics Inc. Biointact PTH “Normals” 22 Haemodialysis patients

51
PTH Biological Variation
Subjects n Assay PTH ng/L CVI CVG CVA RCV (%) N-Set* “Normal” 10 Nichols 51.7 25.9 23.8 5.0 72.3 27 12 Abbott 51.9 19.2 3.5 54.0 15 Immunotopics Bio-intact 1-84 27.5 4.2 67.0 22 Dialysis 303.0 25.6 3.6 72.0 26 131.0 30.2 6.3 86.0 37 * Number of Specimens Required to estimate homeostatic point within 10% with a probability of 95%
 N-Set* Normal 10. Nichols Abbott Immunotopics. Bio-intact Dialysis * Number of Specimens Required to estimate homeostatic point within 10% with a probability of 95%")
52
Time: Length of Studies
Data in chronic stable disease “often can be considered constant over time and geography” “Same order of magnitude in disease and health”

53
Within Subject Variation (CVI,%) for Serum Sodium and Urea
No. of Time Sex status Na+ Urea subjects h m H 11 8 h m H 62 1 d H 11 2 weeks m H 10 4 weeks m H 14 8 weeks F H weeks m H 37 22 weeks m H 274 6 months - H 15 40 weeks - H 9 2 d - RF 15 6 weeks F HP 16 8 weeks m DM Fraser 2001

54
Within subject Biological variation in disease: collated data and clinical consequences. Rico et al Ann Clin Biochem 2007:44: 66 quantities 34 disease with 45 references. “For the majority of quantities studied CVI of same order as diseased. “ Disease specific RCVs may be necessary in some cases. Effect of variability in variability not quantitatively studied. “Heterogeneity in study designs and methods compiled”

55
Quality of Studies Enough reported detail.

57
Population description Ankrah Tet et al:
I’m healthy and normal ! I’m a biochemist! “Blood samples were taken at weekly intervals from 10 healthy subjects (4 men and 6 women, median age 21 years, range 19–27 years; mean body mass index 21.3, range 19.0–25.9) for six weeks at the same time of the day (between 12:30 and 14:30 h),”
 for six weeks at the same time of the day (between 12:30 and 14:30 h),")
58
Are biological variation data fit for purpose?
Need to assess on a case by case basis. Questions around uncertainty. What are the implications for their application? Can the impact of uncertainty be quantified and reduced where necessary. Accepted standard needed for their production. Critical appraisal checklist required to enable veracity of existing and new publications. Meta-analysis of data Questions to be addressed by the EFCC biological Variation Working group

59
Production of reference values The Process: -
Define the purpose for which they are to be used. Only meaningful and transferable if defined for the population or individual in terms of: - Inclusion and exclusion criteria Intake of food & drugs Physiological and environmental conditions Specimen collection criteria Performance characteristics of the analytical method The statistical methods used for estimation of the limits

60
Production of reference values
State of health defined. WHO Defn: - “ a state of complete physical mental and social well being and not merely the absence of disease or infirmity” Disease is a state of health. Conceptually different in different countries. The term “Reference” should be accompanied or preceded by a word qualifying the state of health. E.g diabetic, hospitalised diabetic, ambulatory diabetic, Healthy laboratory worker?

62
Reference Change Values

63
The reference change value: a proposal to interpret laboratory reports in serial testing based on biological variation. C. RICO´ et al Scand J Clin Lab Invest 2004; 64: 175 – 184 “The RCV data in this study are presented as a point of departure for a widely applicable objective guide to interpret changes in serial results.” HL7 recognised concept Requests for additional flags pending

64
Have I answered the Question?
Fit for Purpose?

65
Kinoull Hill, Perth Scotland. Ruth Bartlett

Similar presentations