Download presentation
Presentation is loading. Please wait.

1
Ken Jaworski - V.P. of Planning & Env. Services
Martenson & Eisele, Inc., Menasha, WI Comprehensive ‘Smart Growth’ Planning TRENDS & REALITIES December 9, 2014

2
“It’s tough to make predictions, especially about the future”
2 “It’s tough to make predictions, especially about the future” Trends & Realities Yogi Berra

3
Comprehensive Planning Requirements
New statewide comprehensive planning requirements signed into law in 1999 as a part of the governor’s budget bill; SS required that, starting in 2010, any and all levels of government who make zoning or land division decisions must be based on an adopted comprehensive plan as defined in the law (consistency provision); Requires: Development of a nine-element comprehensive plan document; A separately developed Public Participation Plan; Ten-year updates of the plans.
; Requires: Development of a nine-element comprehensive plan document; A separately developed Public Participation Plan; Ten-year updates of the plans.")
4
Trends and Realities The Bubble Bursts
Recession: A significant decline in economic activity spread across the economy, lasting more than a few months, normally visible in real GDP, real income, employment, industrial production, and wholesale-retail sales.

5
2008 - The Great Recession Businesses and jobs were lost;
Stable neighborhoods became unstable with foreclosures; Development slowed, if not stopped altogether; Agriculture, on the other hand, survived the recession quite well with strong commodity prices; For the first time in decades, the disparity between the prices of land for development vs the price of land for farming began to close.

6
Socio-Economic Trends
From a socio-economic perspective, developing trends cannot be overlooked during the planning process. Demographic changes drive needs and demands. DO NOT IGNORE THEM!

7
Socio-Economic Trends
Population projections for many communities have been throttled back. Person per household size continues to decline. For some communities, mostly rural, which have seen little new housing development, this could mean an actual decrease in population. Many lots within platted subdivisions now lie vacant, with a good number reverted to agricultural use. Also, for the first time in recorded history, there are now more single adults than married in the U.S.

8
Socio-Economic Trends
The Baby Boomer generation (those people born between 1946 and 1964) population bubble continues to move into retirement; with it, carrying a demanding set of needs. This generation is very independent and the “Me” generation will still demand services they feel entitled to due to a work life of paying taxes. Services and infrastructure like police, fire, garbage, utilities etc. must not be sacrificed. Housing and health care must be affordable to meet retirement incomes.
 population bubble continues to move into retirement; with it, carrying a demanding set of needs. This generation is very independent and the Me generation will still demand services they feel entitled to due to a work life of paying taxes. Services and infrastructure like police, fire, garbage, utilities etc. must not be sacrificed. Housing and health care must be affordable to meet retirement incomes.")
9
Population “Megatrends”
Population growth in metro fringe or ex-urban areas Population decline in rural areas of the state Race/ethnic diversity increasing, primarily in urban counties Dramatic increase in Latino population in both urban & rural communities Pace of aging is accelerating – Age wave is on the horizon Increases in poverty and use of “safety nets” Greater distances between jobs and where people live

10
Patterns of Population Change

11
Patterns of Population Change

12
Wisconsin’s Diversity is Increasing

13
Impacts of Ethnic Diversity
As Hispanic and Asian populations grow as a percentage of the US population, cultural values will change relative to land use. Many of these cultures are used to living in more dense environments. They have little interest in, or financial ability for, suburban type living. Work ethics much different than the suburban raised white populations. These cultures have already made their impacts on local school districts relative to teacher requirements. Social programs offered by larger municipalities and counties have reformed as well.

14
Geographic Patterns of Age and Aging

15
The Age “Wave” Is Coming

16
Housing Trends The future of housing is about to meet some interesting challenges.

17
Housing Trends The impact of the “Baby Boomer” generation on the future housing market is about to see an adjustment. In the coming years, baby boomers will be moving on and will likely want to sell their homes to move closer to services and medical arrangements. Like any seller, they will be hoping there are people behind them to buy their homes. It is estimated there will be 1.5 to 2 million homes coming on the market nationwide every year at the end of this decade from senior households selling off. Who will be behind them to buy? The answer is likely not enough buyers for the amount and types of homes on the market.

18
Housing Trends McMansions are out and smaller is better.
According to data from the American Housing Survey, from 1989 and 2009, 80 percent of new homes built in that era were detached single-family homes. A third of them were larger than 2,500 square feet. Forty (40) percent were built on lots of half an acre to 10 acres in size. This source predicts that 74 percent of new housing demand will come from the people who bought these traditional homes, now empty-nesters, wanting to downsize. It’s basic; smaller family size and more single households will not require large homes on large lots.
 percent were built on lots of half an acre to 10 acres in size. This source predicts that 74 percent of new housing demand will come from the people who bought these traditional homes, now empty-nesters, wanting to downsize. It’s basic; smaller family size and more single households will not require large homes on large lots.")
19
Housing Trends It is likely that a vast majority of future households with children will still want traditional sized houses. Some demand for “traditional” subdivision type single family housing will always be evident. However, it is projected that about a quarter of the buyers will want something else, like condos, rental units and urban townhouses. Historically, that demand was very low, near zero percent in some regions. This is a small share but still a huge shift within the housing market. This trend may lead to why many baby boomers may not find buyers for their original, larger homes, especially in rural areas. The trend may also suggest that buyers will want smaller more reasonably priced homes they will be able to sell quicker in the future.

20
Housing Trends The cost to build versus buying an existing house in an already flooded home market will likely make building a new home a lesser value. To access most of the homes that will hit the market, car travel will still be required. Although a portion of the upcoming home buyers will still want to build new, this percentage will likely decrease. Also, agricultural land prices are at an all-time high. This means the cost to develop subdivisions within more rural areas will be even more expensive, especially in areas of active farming where the demand for farm land is high. Expect to see an increase in households accommodating multiple generations.

21
Agricultural Trends From an agricultural perspective, farming was one of the few industries that survived the Great Recession without major issues. Couple this fact with the almost stagnant housing development market, much land returned to be managed as agriculture. The gap in land values between development and agriculture has closed substantially.

22
Agricultural Trends Wisconsin agriculture will likely stay strong for the foreseeable future. Competition between different agriculture niches like vegetable and grain crops vs dairy has increased the competition for farmland driving up agricultural land prices for purchase and rent. Few agricultural professionals project this trend to change as populations in developing countries grow increasing the demand for food worldwide. Which leads to a fundamental planning question: Will rural governmental units like towns, reverse some of their prior plans which called for “Rural Residential” and now designated them for agriculture use? Most planners have never experienced this type of reversal before.

23
Transportation Trends
The times they are a changin’. Technology, climate change policy, and personal choice are driving the transportation industry like never before. Big changes are in store as these three areas converge in the future.

24
Transportation Trends
The “Millennial” generation is not that into cars as past generations. The Federal Highway Administration (FHWA) indicates a growing number of youth are less interested in obtaining a driver’s license. In 2011, the percentage of 16-to-24 year olds with driver’s licenses dipped to another new low. Just over two-thirds of young Americans (67 percent) were licensed to drive in That’s the lowest percentage since at least 1963. Why are fewer young people are getting driver’s licenses and driving less? Is it the economy? Is it the cost of gas, insurance and vehicle ownership? Are they too busy cuddling with their iPhones and iPads to get behind the wheel?
 indicates a growing number of youth are less interested in obtaining a driver’s license. In 2011, the percentage of 16-to-24 year olds with driver’s licenses dipped to another new low. Just over two-thirds of young Americans (67 percent) were licensed to drive in That’s the lowest percentage since at least Why are fewer young people are getting driver’s licenses and driving less Is it the economy Is it the cost of gas, insurance and vehicle ownership Are they too busy cuddling with their iPhones and iPads to get behind the wheel")
25
Transportation Trends
Millennials will have a significant impact future transportation investments. The transportation behaviors of the Millennials are doubly important because there are so many of them. The youth driving decline now is remarkable since there are now more teenagers and young adults in America than there have been in years. Since 1992, America has gained more than 7.3 million 16-to-24 year olds — an increase of 22 percent — but has added only 1.2 million 16-to-24 year old drivers, 16.4% of the total. If transportation depends on gas tax to generate revenues and future users will consume less gas, how will improvements be funded?

26
Transportation Trends
Increased interest and use of Mass Transit. Millennials seem to be defying their sheltered, suburban upbringing by not purchasing a driver’s license and choosing transit instead. In fact, according to 2013 survey data provided by TransitCenter, transit ridership is at a 50 year high. The reason may be as simple as driving being a barrier to using an iPhone. Obviously, rural communities will not be able to provide the luxury of public transit, but if the Millennials seek or choose it specifically as their mode of choice, rural communities will have a harder time maintaining or growing their future housing base. It’s apparent, the millennial generation appears very attracted to urbanized environments. Most have known no other lifestyle.

27
Environmental Trends Groundwater is becoming more precious and political. Competing uses for groundwater – whether business or personal use – are stressing the supply and quantity of groundwater in some areas of our State. More areas are experiencing problems with drinking water quality – nitrates and e-coli from agricultural sources, naturally occurring arsenic and radium, and now pharmaceuticals being the latest contaminant. The legislative arena continues to debate over high capacity wells impacts. “Water Wars are apt to get more frequent and complex as the years progress. Will local plans be able to have an impact?

28
Environmental Trends Surface Water Quality is of increasing importance . Tens of millions of dollars are spent every year by both public and private sources to protect our water quality in our State. Wisconsin has a long history of having a ‘water ethic’ and it’s clear that our residents enjoy and value their water resources. New paradigms will be emerging to manage point and non-point source pollution such as the WDNR’s Total Maximum Daily Load (TMDL) program. This program would essentially offer up public and private dollars spent on ‘point source’ pollution for rural land management practices that reduce phosphorus inputs to our surface waters.
 program. This program would essentially offer up public and private dollars spent on ‘point source’ pollution for rural land management practices that reduce phosphorus inputs to our surface waters.")
29
Environmental Trends Climate Change will impact man-made and natural systems . Scientist predicted and the public has generally excepted we will experience more extreme events. Floods and drought will become more common. Stormwater and drainage systems will be tested. Bridges, culverts, roads will need to be designed to handle these extreme events increasing costs. Farmers will need to invest in agricultural crops or systems that are more accommodating to extreme events. Invasive species, pests and crop disease will adapt to climate change demanding farmers and agronomist to stay on the cutting edge of innovation.

30
Regionalization Trends
Once thought of as a term related to the government takeover of rights, regionalization as a solution, will grow out of financial necessity. Probably now more than ever, communities, especially rural ones, are realizing they can’t provide everything to all people. The financial resources are just not there to do so and the social desire to pay for them is not strong enough.

31
Regionalization Trends
Younger generations have little interest in where the boundary of one government ends and the other begins. They are “Systems Thinkers”. Like an animal seeking quality habitat to survive and prosper, future inhabitants of communities will be attracted to areas that provide places to walk, bike, shop, receive medical attention, be employed, obtain training/education, socialize and much more. They will want their solutions and needs met instantaneously. Working collectively across community borders will be paramount in providing the nectar in which residents and visitors will find appealing. If the “habitat” is there, they will come. Cities keep the country, country. Towns create the sense of place for cities. They function as a system and rely on the assets of each other to sustain.

32
Regionalization Trends
Increased technology has made the opportunity to provide services across boundaries easier and more efficient. Emergency response and transportation systems have made huge strides in this area. There is no reason to think, utility or other services couldn’t benefit from similar applications in the future. These are exactly the same concepts that private special interest groups and industries have used to break down local control barriers, so why couldn’t governments unite to achieve their desires? The answer is, they can.

33
“The best way to predict the future is to create it”
3 “The best way to predict the future is to create it” Case Studies Unknown

34
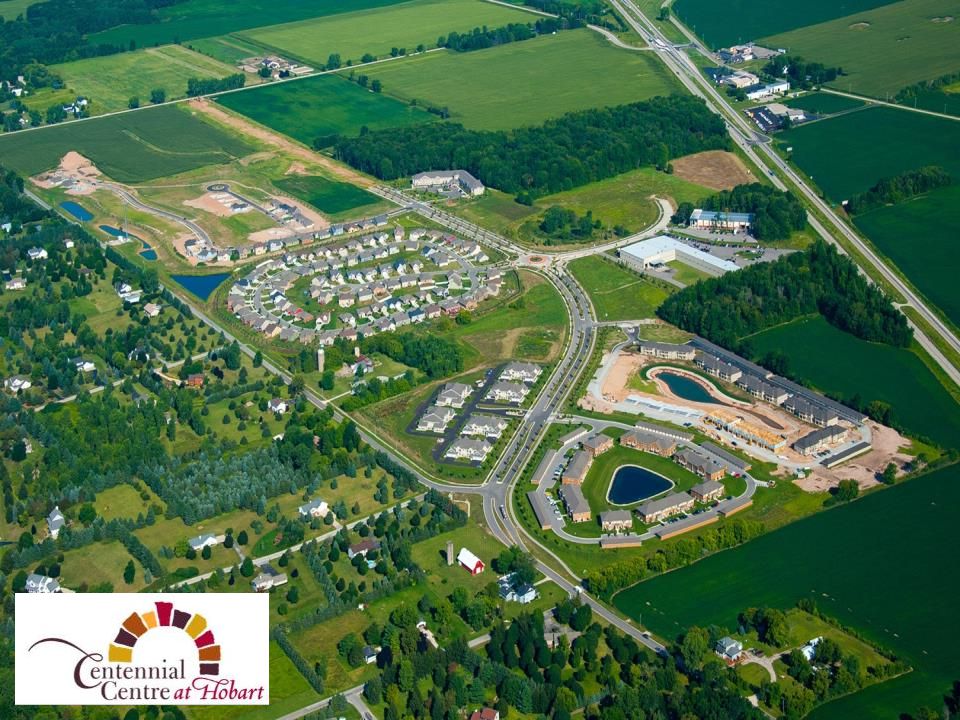
Village of Hobart Centennial Center Brown County, Wisconsin
Pioneers in promoting affordable housing on smaller lots with community amenities; Worked with an established developer to build the desired housing. See, touch, feel, buy concept; Willing to invest in detailed conceptual mixed use planning. Boast “Centennial Centre” are their “Sense of Place”; Result: Since 2010, 23% growth in population, 49.5% since Growth occur right through the Great Recession.

37
Perfect Storm Could we be entering an era where we are experiencing a Planner’s Perfect Storm? More efficient land use patterns designed to meet the future needs and preferences of future users. Livable, healthy, sustainable communities. Local agriculture supporting local demands, creating local jobs. Responsible party environmental protection.

38
THANK YOU! Questions?

39
Tonight’s Process You will be asked to give your answers to two questions: What are Little Chute’s Strengths? (Use Yellow Post It Cards to Record) What are ways to improve Little Chute? (Use Green Post It Cards) Record each answer on a separate “post it” card. There is no limit to the amount of answers you can submit per question. Please hand all your post it cards to the facilitators behind the tables. Once you have handed in all your cards, enjoy some refreshments while the facilitators summarize your answers. Stick around as you will be asked to vote on the responses
 Record each answer on a separate post it card. There is no limit to the amount of answers you can submit per question. Please hand all your post it cards to the facilitators behind the tables. Once you have handed in all your cards, enjoy some refreshments while the facilitators summarize your answers. Stick around as you will be asked to vote on the responses.")
40
Tonight’s Process -Voting
Once the Facilitators have separated all the answers into “like” themes, you will be given six (6) voting dots. Use three voting dots per question and vote for your three favorite choices (themes) per question. Red Dots are your first priority, Green Dots, your second priority and the Yellow Dots your third priority. Once you have voted, you are free to leave or stay. Results will be tabulated after tonight’s meeting and posted on the Village’s web site within a week. Leave your address if you would like the results sent directly to you. Comments don’t stop after tonight. Contact the Village with any additional thoughts you may have. Your opinions are valuable.
 voting dots. Use three voting dots per question and vote for your three favorite choices (themes) per question. Red Dots are your first priority, Green Dots, your second priority and the Yellow Dots your third priority. Once you have voted, you are free to leave or stay. Results will be tabulated after tonight’s meeting and posted on the Village’s web site within a week. Leave your address if you would like the results sent directly to you. Comments don’t stop after tonight. Contact the Village with any additional thoughts you may have. Your opinions are valuable.")
41
Village of Little Chute Strengths- 2003
Weighted Score Safe community, low crime rate 87 Clean community, neighborhoods, streets 70 Excellent schools, teachers, Board, class size 59 New and expanding commercial growth 47 Pride in upkeep of homes 46 River 44 Location/access to Highway 41 41 Central location in the Fox Valley 31 Strong family ties (heritage) 30 Nice parks 28 Strong emphasis on maintaining quality infrastructure High quality streets 27 Village of Little Chute Strengths Source: Village of Little Chute Issues and Opportunities Workshop – November 6, 2003
 30. Nice parks. 28. Strong emphasis on maintaining quality infrastructure. High quality streets. 27. Village of Little Chute Strengths. Source: Village of Little Chute Issues and Opportunities Workshop – November 6,")
42
Village of Little Chute Improvements-2003
Improvements Weighted Score Work to improve the smell from landfill 82 Continue development of parks and green space 53 More public interest/involvement/input in (village) government 50 More activities for youth – tweeners and teenagers 48 Better maintenance of historical marker 46 More programs for seniors 41 Work to align school and village boundaries 39 Retail businesses that attract attention and dollars from non-residents Reopen lock keeper’s house into historical house/museum 38 More diverse 21st century business base 35 Village of Little Chute Improvements Source: Village of Little Chute Issues and Opportunities Workshop – November 6, 2003
 government. 50. More activities for youth – tweeners and teenagers. 48. Better maintenance of historical marker. 46. More programs for seniors. 41. Work to align school and village boundaries. 39. Retail businesses that attract attention and dollars from non-residents. Reopen lock keeper’s house into historical house/museum. 38. More diverse 21st century business base. 35. Village of Little Chute Improvements. Source: Village of Little Chute Issues and Opportunities Workshop – November 6,")
Similar presentations

 Planned Villages / Communities Includes one (1) Town Center ~41,000 Planned Households.>")


![The Urban Infrastructure Challenge in Canada: Focusing on Housing Affordability and Choice Presentation by CHBA – [Name] to The Municipal Council of [Name]](/17/5358765/big_thumb.jpg "The Urban Infrastructure Challenge in Canada: Focusing on Housing Affordability and Choice Presentation by CHBA – [Name] to The Municipal Council of [Name]>")