Download presentation
Presentation is loading. Please wait.

1
THE COSTS OF PRODUCTION
Chapter 13 1 1

2
The Costs of Production
The Law of Supply ä Firms are willing to produce and sell a greater quantity of a good when the price of the good is high. ä This results in a supply curve that slopes upward. 2 2

3
The Firm’s Objective The economic goal of the firm is to maximize profits. 4 3

4
A Firm’s Total Revenue and Total Cost
ä The amount that the firm receives for the sale of its product. Total Cost ä The amount that the firm pays to buy inputs. 5 4

5
A Firm’s Profit Profit is often referred to as producer surplus.
It is the amount a seller is paid minus costs. Profit = Total revenue - Total cost 5 5

6
Costs as Opportunity Costs
A firm’s costs of production include all the opportunity costs of making its output of goods and services. 8 6

7
Explicit and Implicit Costs
A firm’s cost of production include explicit costs and implicit costs. ä Explicit costs involve a direct money outlay for factors of production. ä Implicit costs do not involve a direct money outlay. 8 7

8
Economic Profit versus Accounting Profit
Economists include all opportunity costs when measuring costs. Accountants measure the explicit costs but often ignore the implicit costs. 9 8

9
Economic Profit versus Accounting Profit
When total revenue exceeds both explicit and implicit costs, the firm earns economic profit. ä Economic profit is smaller than accounting profit. 9 9

10
Economic Profit versus Accounting Profit
How an Economist Views a Firm Economic profit Implicit costs Revenue Total opportunity costs Explicit costs 9 10

11
Economic Profit versus Accounting Profit
How an Economist Views a Firm How an Accountant Views a Firm Revenue Economic profit Accounting profit Implicit costs Revenue Total opportunity costs Explicit costs Explicit costs 9 11

12
Production and Costs A firm’s costs reflect its production process. 9
18

13
The Production Function
The production function shows the relationship between quantity of inputs used to make a good and the quantity of output of that good. 9 19

14
Marginal Product The marginal product of any input into production is the increase in the quantity of output obtained from an additional unit of that input. 9 20

15
Marginal Product The marginal product of any input into production is the increase in the quantity of output obtained from an additional unit of that input. 9 21

16
Diminishing Marginal Product
Diminishing marginal product is the property whereby the marginal product of an input declines as the quantity of the input increases. Example: As more and more workers are hired at a firm, each additional worker contributes less and less to production because the firm has a limited amount of equipment. 22

17
Diminishing Marginal Product
The slope of the production function measures the marginal product of an input, such as a worker. When the marginal product declines, the production function becomes flatter. 23

18
A Production Function Quantity of Output (cookies per hour) 150 140
130 120 110 100 90 80 70 60 50 40 30 20 10 Number of Workers Hired 1 2 3 4 5 Production function 24

19
Production Function and Total Costs
The relationship between the quantity a firm can produce and its costs determines its pricing decisions. The total-cost curve shows this relationship graphically. 25

20
A Production Function and Total Cost
Marginal Number of Output Cost of Cost of Total Cost Product of Workers (Quantity) Factory Workers of Inputs Labor $30 $0 $30 1 50 50 30 10 40 2 90 40 30 20 50 3 120 30 30 30 60 4 140 20 30 40 70 5 150 10 30 50 80 9 26
 Factory. Workers. of Inputs. Labor. $30. $0. $")
21
Total-Cost Curve Total Cost $80 Total-cost curve 70 60 50 40 30 20 10
20 40 60 80 100 120 140 Quantity of Output (cookies per hour) 27
 27.")
22
The Various Measures of Cost
Costs of production may be divided into fixed costs and variable costs. 12 28

23
The Various Measures of Cost
Fixed costs are those costs that do not vary with the quantity of output produced. 12 29

24
The Various Measures of Cost
Variable costs are those costs that do vary with the quantity of output produced. 12 30

25
Family of Total Costs TC = TFC + TVC Total Fixed Costs (TFC)
Total Variable Costs (TVC) Total Costs (TC) TC = TFC + TVC 14 31
 Total Costs (TC) TC = TFC + TVC")
26
Family of Total Costs 14 32

27
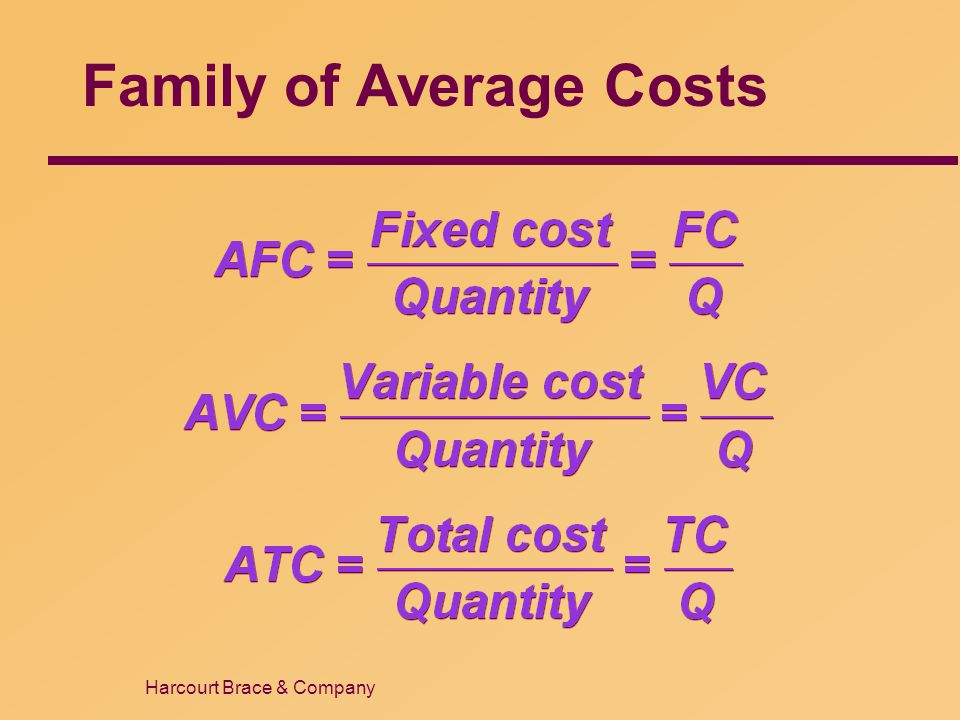
Average Costs Average costs can be determined by dividing the firm’s costs by the quantity of output produced. The average cost is the typical cost of each unit of product. 33

28
Family of Average Costs
Average Fixed Costs (AFC) Average Variable Costs (AVC) Average Total Costs (ATC) 15 34
 Average Variable Costs (AVC) Average Total Costs (ATC)")
29
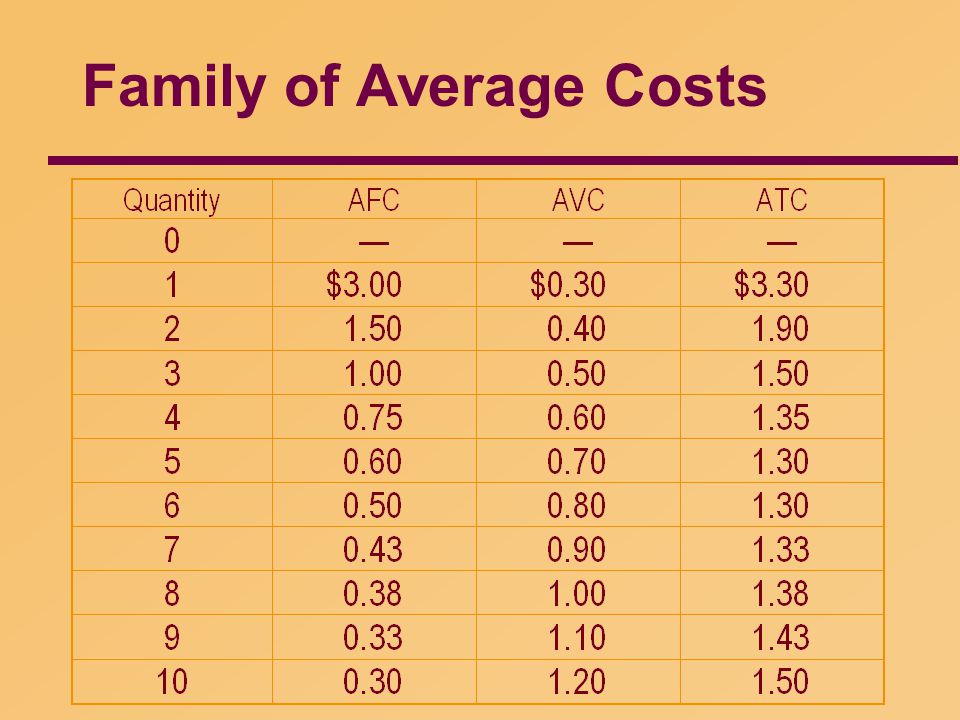
Family of Average Costs
15 35
30
Table 13-3 Various Measures of Cost: Big Bob’s Bagel Bin

31
Family of Average Costs
14 36
32
Marginal Cost Marginal cost (MC) measures the increase in total cost that arises from an extra unit of production. Marginal cost helps answer the following question: ä How much does it cost to produce an additional unit of output? 16 37

33
Marginal Cost 16 38

34
Marginal Cost 16 39

35
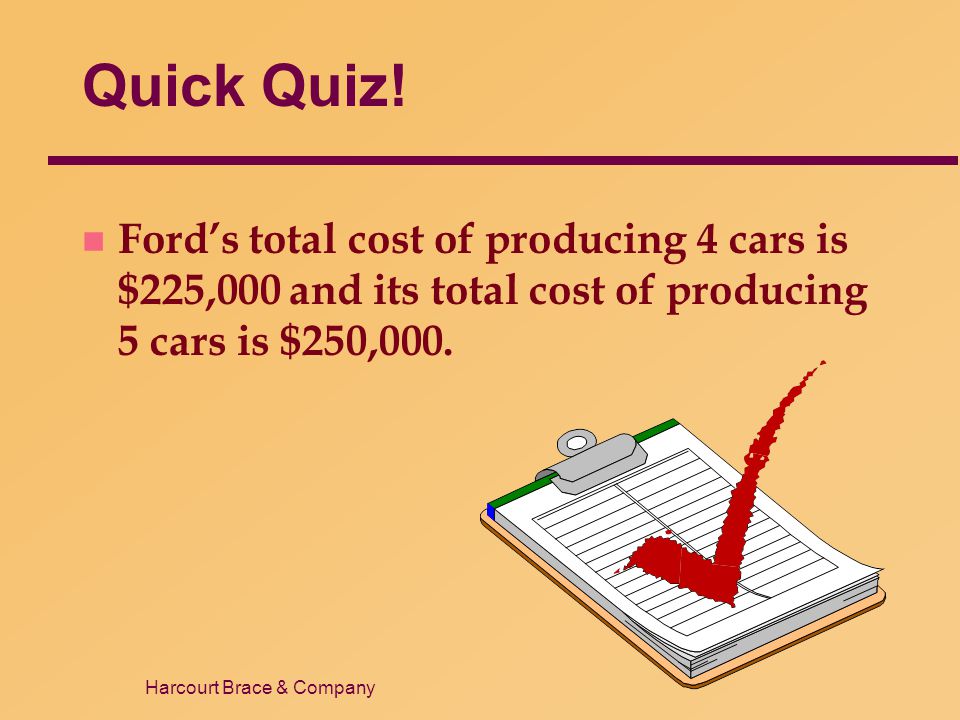
Quick Quiz! Ford’s total cost of producing 4 cars is $225,000 and its total cost of producing 5 cars is $250,000. 18 40
36
Quick Quiz! What is the average total cost and marginal cost of producing the fifth car? 18 41

37
Cost Curves and Their Shapes
Marginal cost rises with the amount of output produced. ä At low levels of output, an increase in production will occur at a relatively small cost. ä Increasing output is more costly when the amount being produced is already high. 19 42

38
Cost Curves and Their Shapes
Costs $3.00 2.75 2.50 2.25 2.00 1.75 1.50 1.25 1.00 0.75 0.50 0.25 1 2 3 4 5 6 7 8 9 10 11 12 13 14 Quantity of Output (bagels per hour) 20 43
")
39
Cost Curves and Their Shapes
Costs $3.00 2.75 2.50 2.25 MC 2.00 1.75 1.50 1.25 1.00 0.75 0.50 0.25 1 2 3 4 5 6 7 8 9 10 11 12 13 14 Quantity of Output (bagels per hour) 20 44
")
40
Cost Curves and Their Shapes
The average total-cost curve is U-shaped. ä At very low levels of output average total cost is high because fixed cost is spread over only a few units. ä Average total cost declines as output increases. ä Average total cost starts rising because average variable cost rises substantially. 19 45

41
Cost Curves and Their Shapes
Costs $3.00 2.75 2.50 2.25 2.00 1.75 1.50 1.25 1.00 0.75 0.50 0.25 1 2 3 4 5 6 7 8 9 10 11 12 13 14 Quantity of Output (bagels per hour) 21 46
")
42
Cost Curves and Their Shapes
Costs $3.00 2.75 2.50 2.25 2.00 1.75 1.50 ATC 1.25 AVC 1.00 0.75 0.50 0.25 AFC 1 2 3 4 5 6 7 8 9 10 11 12 13 14 Quantity of Output (bagels per hour) 21 47
")
43
Relationship Between Marginal Cost and Average Total Cost
Whenever marginal cost is less than average total cost, average total cost is falling. Whenever marginal cost is greater than average total cost, average total cost is rising. 48

44
Relationship Between Marginal Cost and Average Total Cost
The marginal-cost curve crosses the average-total-cost curve at the efficient scale. ä Efficient scale is the quantity that minimizes average total cost. 19 49

45
Relationship Between Marginal Cost and Average Total Cost
Costs $3.00 2.75 2.50 2.25 2.00 1.75 1.50 1.25 1.00 0.75 0.50 0.25 1 2 3 4 5 6 7 8 9 10 11 12 13 14 Quantity of Output (bagels per hour) 29 50
")
46
Relationship Between Marginal Cost and Average Total Cost
Costs $3.00 2.75 2.50 2.25 2.00 1.75 1.50 ATC 1.25 1.00 0.75 0.50 0.25 1 2 3 4 5 6 7 8 9 10 11 12 13 14 Quantity of Output (bagels per hour) 29 51
")
47
Relationship Between Marginal Cost and Average Total Cost
Costs $3.00 2.75 2.50 2.25 MC 2.00 1.75 1.50 ATC 1.25 1.00 0.75 0.50 0.25 1 2 3 4 5 6 7 8 9 10 11 12 13 14 Quantity of Output (bagels per hour) 29 52
")
48
Costs in the Long Run For many firms, the division of total costs between fixed and variable costs depends on the time horizon being considered. ä In the short run some costs are fixed. ä In the long run fixed costs become variable costs. 24 53

49
Costs in the Long Run Because many costs are fixed in the short run but variable in the long run, a firm’s long-run cost curves differ from its short-run cost curves. 24 54

50
U-Shaped Long-Run Average Total Cost
Economies of scale occur when long-run average total cost falls as the quantity of output increases. 24 55

51
U-Shaped Long-Run Average Total Cost
Diseconomies of scale occur when long-run average total cost rises as the quantity of output increases. 24 56

52
U-Shaped Long-Run Average Total Cost
Constant returns to scale occur when long-run average total cost stays the same as the quantity of output increases. 24 57

53
U-Shaped Long-Run Average Total Cost
Quantity of Cars per Day 24 58

54
U-Shaped Long-Run Average Total Cost
ATC in short run with small factory Cost Quantity of Cars per Day 24 59

55
U-Shaped Long-Run Average Total Cost
ATC in short run with medium factory ATC in short run with small factory Cost Quantity of Cars per Day 24 60

56
U-Shaped Long-Run Average Total Cost
ATC in short run with medium factory ATC in short run with large factory ATC in short run with small factory Cost Quantity of Cars per Day 24 61

57
U-Shaped Long-Run Average Total Cost
Quantity of Cars per Day 24 62

58
U-Shaped Long-Run Average Total Cost
ATC in long run Quantity of Cars per Day 24 63

59
U-Shaped Long-Run Average Total Cost
ATC in long run Economies of scale Quantity of Cars per Day 24 64

60
U-Shaped Long-Run Average Total Cost
ATC in long run Economies of scale Constant returns to scale Quantity of Cars per Day 24 65

61
U-Shaped Long-Run Average Total Cost
ATC in long run Economies of scale Constant returns to scale Diseconomies of scale Quantity of Cars per Day 24 66

62
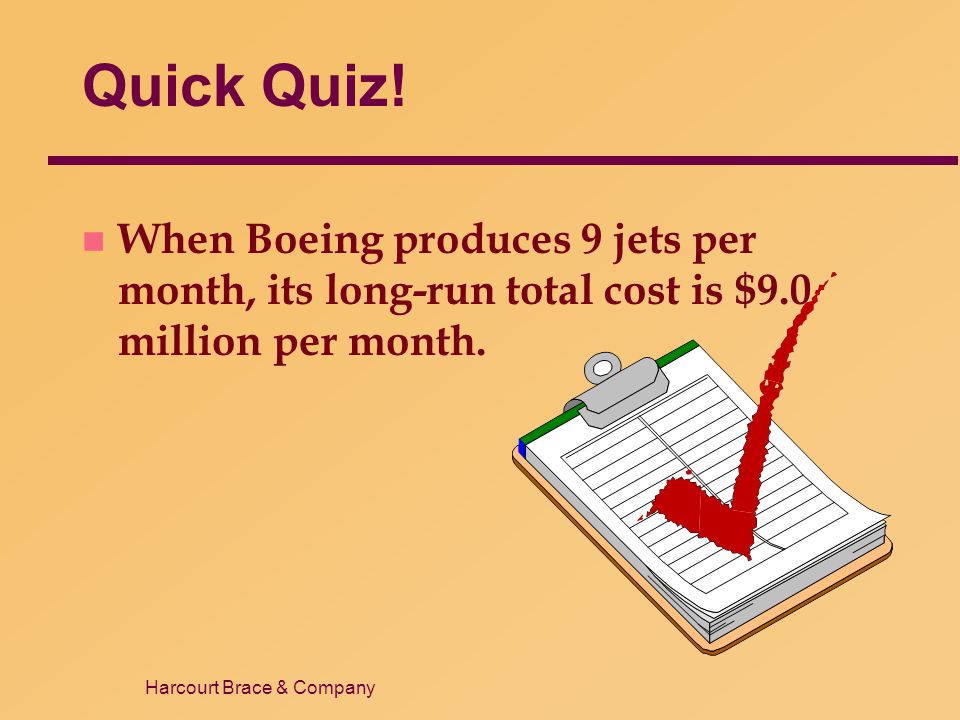
Quick Quiz! When Boeing produces 9 jets per month, its long-run total cost is $9.0 million per month. 18 67
63
Quick Quiz! When Boeing produces 10 jets per month, its long-run total cost is $9.5 million per month. 18 68
64
Quick Quiz! Does Boeing exhibit economies or diseconomies of scale? 18
69

65
Conclusion The goal of firms is to maximize profit, which equals total revenue minus total cost. Some costs are explicit. Other costs, such as opportunity costs, are implicit. A firm has fixed and variable costs. Fixed costs don’t vary with quantities produced; variable costs do.

66
Conclusion Average total cost is total cost divided by the quantity of output. Marginal cost is the amount total cost rises if output is increased by one unit. Marginal cost generally rises with the quantity of output; average total cost first falls as output increases and then eventually rises with further output.

67
Conclusion A firm’s costs often depend on the time horizon being considered. Many costs are fixed in the short run but variable in the long run. When the level of production changes, average total cost may rise more in the short run than in the long run.

68
THE COSTS OF PRODUCTION
End of Chapter 13 1 70

Similar presentations


 HAPPY MARCH… ONE WEEK UNTIL SPRING BREAK>>>>")
>")
