Download presentation
Presentation is loading. Please wait.

1
Unit 2: Supply, Demand, and Consumer Choice

2
This is the most important cow all year!

3
Connection to Circular Flow Model
Do individuals supply or demand? Do business supply or demand? Who demands in the product market? Who supplies in the product market?

6
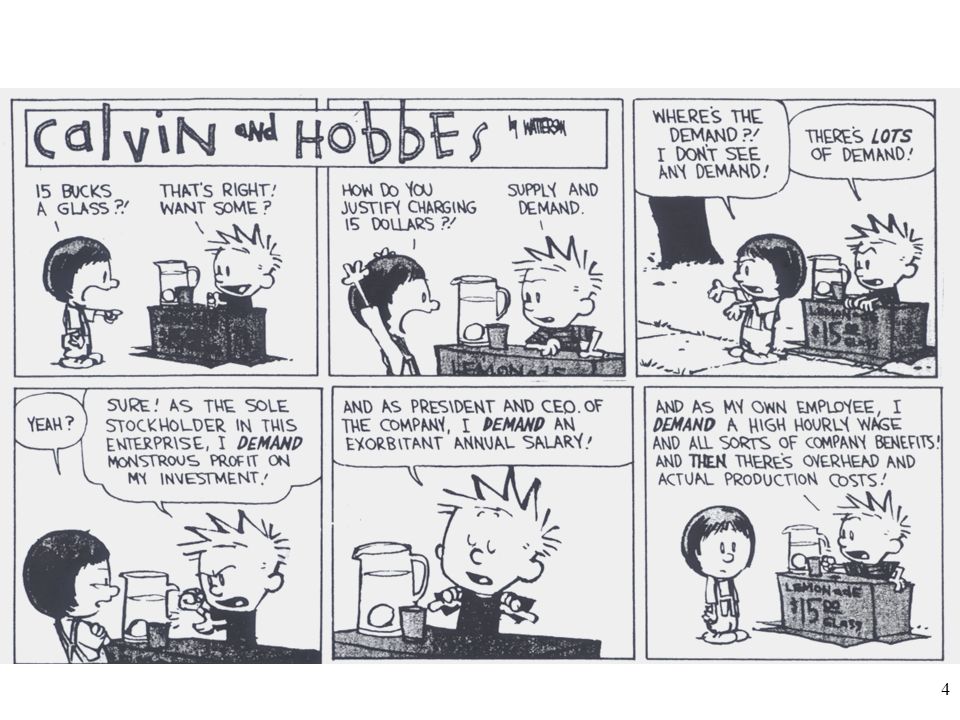
DEMAND DEFINED What is Demand? What is the Law of Demand?
Demand is the different quantities of goods that consumers are willing and able to buy at different prices. (Ex: Bill Gates is able to purchase a Ferrari, but if he isn’t willing he has NO demand for one) What is the Law of Demand? There is an INVERSE relationship between price and quantity demanded
 What is the Law of Demand There is an INVERSE relationship between price and quantity demanded.")
7
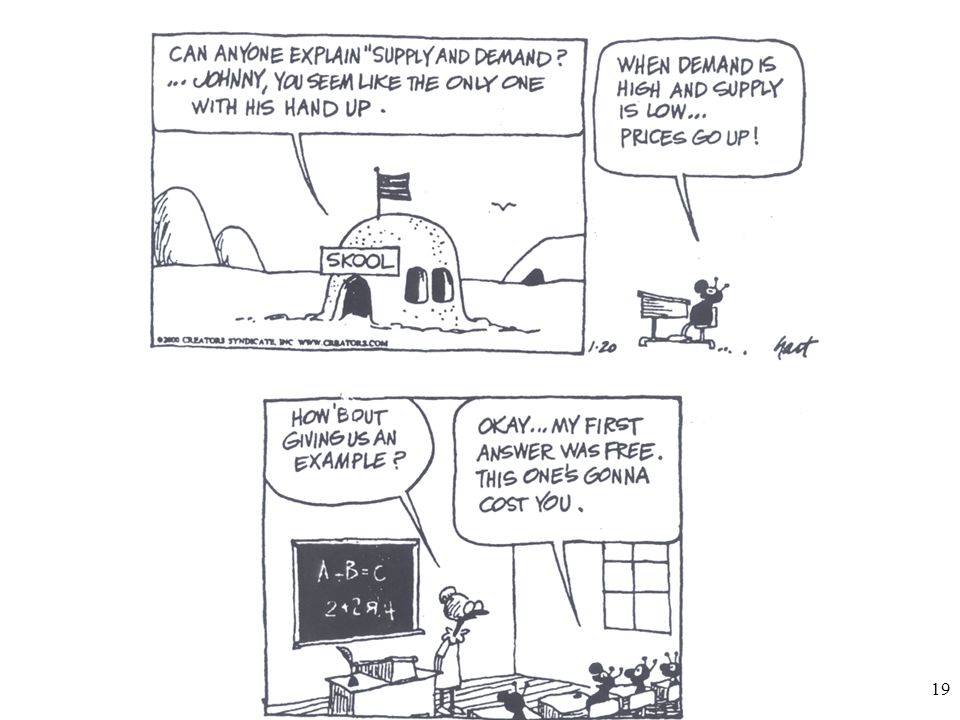
LAW OF DEMAND As Price Falls… …Quantity Demanded Rises As Price Rises…
…Quantity Demanded Falls Quantity Demanded Price

8
Example of Demand I am willing to sell several A’s in AP Economics. How much will you pay? Price Quantity Demanded Demand Schedule

9
Why does the Law of Demand occur?
The law of demand is the result of three separate behavior patterns that overlap: The Substitution effect The Income effect The Law of Diminishing Marginal Utility We will define and explain each…

10
Why does the Law of Demand occur?
1. The Substitution Effect If the price goes up for a product, consumer buy less of that product and more of another substitute product (and vice versa) 2. The Income Effect If the price goes down for a product, the purchasing power increases for consumers -allowing them to purchase more.
 2. The Income Effect. If the price goes down for a product, the purchasing power increases for consumers -allowing them to purchase more.")
11
Why does the Law of Demand occur?
3. Law of Diminishing Marginal Utility U- TIL- IT- Y Utility = Satisfaction We buy goods because we get utility from them The law of diminishing marginal utility states that as you consume more units of any good, the additional satisfaction from each additional unit will eventually start to decrease In other words, the more you buy of ANY GOOD the less satisfaction you get from each new unit. Discussion Questions: What does this have to do with the Law of Demand? How does this effect the pricing of businesses?

12
Can you see the Law of Diminishing Marginal Utility in Disneyland’s pricing strategy?
Change N/A $54 $33 $15 $10 $5

13
The Law of Diminishing Marginal Utility

14
Graphing Demand

15
Let’s draw a new demand curve for cereal…
The Demand Curve A demand curve is a graphical representation of a demand schedule. The demand curve is downward sloping showing the inverse relationship between price (on the y-axis) and quantity demanded (on the x-axis) When reading a demand curve, assume all outside factors, such as income, are held constant. (This is called ceteris paribus) Let’s draw a new demand curve for cereal…
 and quantity demanded (on the x-axis) When reading a demand curve, assume all outside factors, such as income, are held constant. (This is called ceteris paribus) Let’s draw a new demand curve for cereal…")
16
GRAPHING DEMAND Draw this large in your notes Demand Schedule
Price of Cereal Draw this large in your notes $5 4 3 2 1 Price Quantity Demanded $5 10 $4 20 $3 30 $2 50 $1 80 o Q Quantity of Cereal

17
GRAPHING DEMAND Demand Schedule Price of Cereal $5 10 $4 20 $3 30 $2
Quantity Demanded $5 10 $4 20 $3 30 $2 50 $1 80 Demand o Q Quantity of Cereal 17

18
Where do you get the Market Demand?
Billy Jean Other Individuals Market Price Q Demd $5 1 $4 2 $3 3 $2 5 $1 7 Price Q Demd $5 $4 1 $3 2 $2 3 $1 5 Price Q Demd $5 9 $4 17 $3 25 $2 42 $1 68 Price Q Demd $5 10 $4 20 $3 30 $2 50 $1 80 P P P P $3 $3 $3 $3 D D D D Q Q Q Q 3 2 25 30

Similar presentations


 PDN, PgDED CMB, M.A CMB, Ph.D The.>")


 What is the law of demand? How do the substitution effect and income effect influence decisions? What is a demand schedule?>")


