Download presentation
Presentation is loading. Please wait.

1
Optimizing Nutrition Delivery in the Critically Ill
Daren K. Heyland Professor of Medicine Queen’s University, Kingston General Hospital Kingston, ON Canada Add data from iatrogenic malnutrition slides

3
Critical Care Nutrition
The right nutrient/nutritional strategy The right timing The right patient The right intensity (dose/duration) With the right outcome!
 With the right outcome!")
6
A Continuous Quality Improvement Effort
What ought to be done? RCTs, Systematic Reviews, and Evidence-based practice guidelines How to change? “KT strategies” What is done? Survey results What do we need to do differently? “Gaps” - site reports

7
Early and Adequate EN Best for the Patient!
Role of Supplemental PN

8
Loss of Gut Epithelial Integrity
Underlying Pathophysiology of Critical Illness Loss of Gut Epithelial Integrity INTESTINAL EPITHELIUM SIRS Bacteria DISTAL ORGAN INJURY (Lung, Kidneys) via thoracic duct lymphocytes
 via thoracic duct. lymphocytes.")
9
Disuse Causes Loss of Functional and Stuctural Integrity Increased Gut Permeability
Characteristics : Time dependent Correlation to disease severity Consequences: Risk of infection Risk of MOFS

10
Feeding Supports Gastrointestinal Structure and Function
Maintenance of gut barrier function Increased secretion of mucus, bile, IgA Maintenance of peristalsis and blood flow Attenuates oxidative stress and inflammation Supports GALT Improves glucose absorption Alverdy (CCM 2003;31:598) Kotzampassi Mol Nutr Food Research 2009 Nguyen CCM 2011
 Kotzampassi Mol Nutr Food Research Nguyen CCM")
11
Effect of Early Enteral Feeding on the Outcome of Critically ill Mechanically Ventilated Medical Patients Retrospective analysis of multiinstitutional database 4049 patients requiring mech vent > 2 days Categorized as “Early EN” if rec’d feeds within 48 hours of admission (n=2537, 63%) P=0.007 P=0.02 P=0.0005 Artinian Chest 2006:129;960
 P= P=0.02. P= Artinian Chest 2006:129;960.")
12
Effect of Early Enteral Feeding on the Outcome of Critically ill Mechanically Ventilated Medical Patients Data evaluating the effect of n-3 FFAs on clinical outcomes is relatively sparse, and in this study, is confounded by the fact that they combined fish oils with antioxidants. Artinian Chest 2006:129;960 12

13
Early EN (within 24-48 hrs of admission) is recommended!
…associated with large reductions in infections and mortality Updated CPGs, see

14
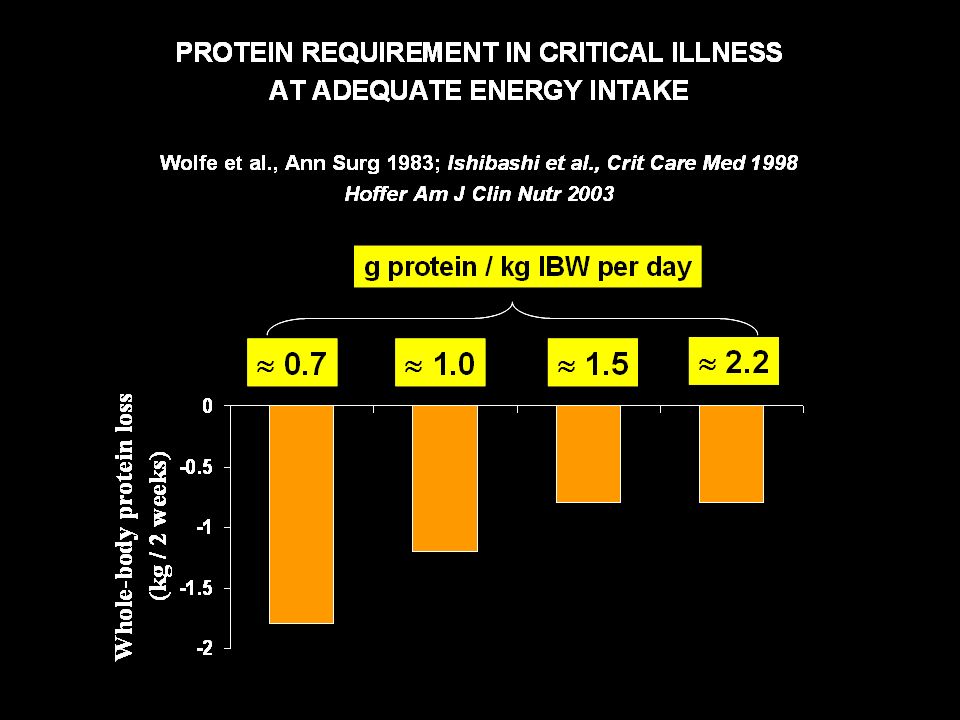
Optimal Amount of Protein and Calories for Critically Ill Patients

15
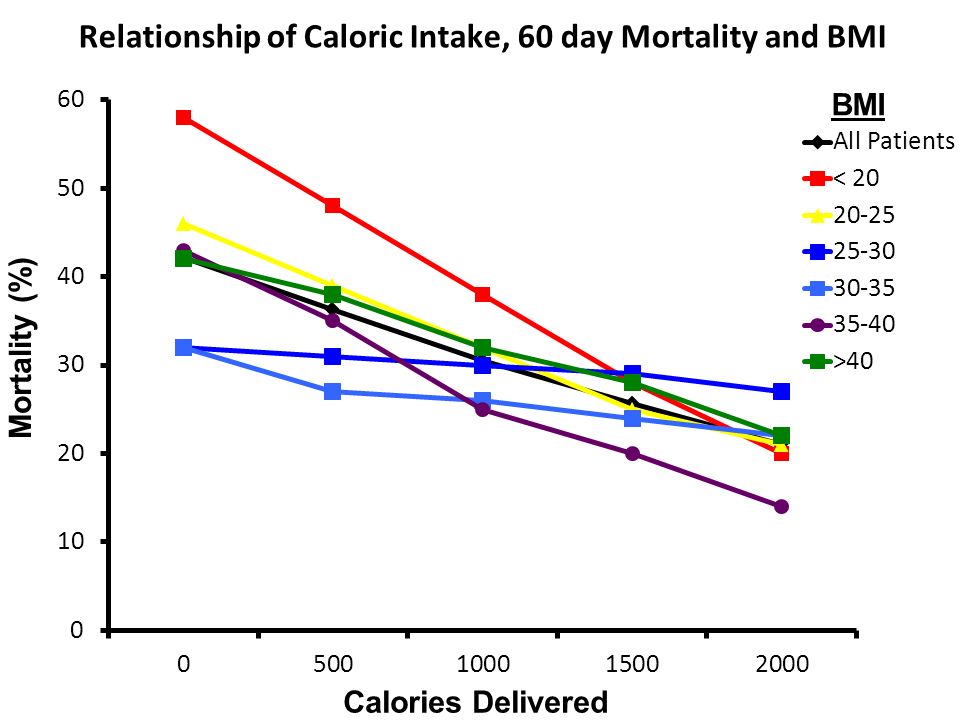
Caloric debt associated with:
Increasing Calorie Debt Associated with worse Outcomes Caloric Debt Adequacy of EN Caloric debt associated with: Longer ICU stay Days on mechanical ventilation Complications Mortality Rubinson CCM 2004; Villet Clin Nutr 2005; Dvir Clin Nutr 2006; Petros Clin Nutr 2006

16
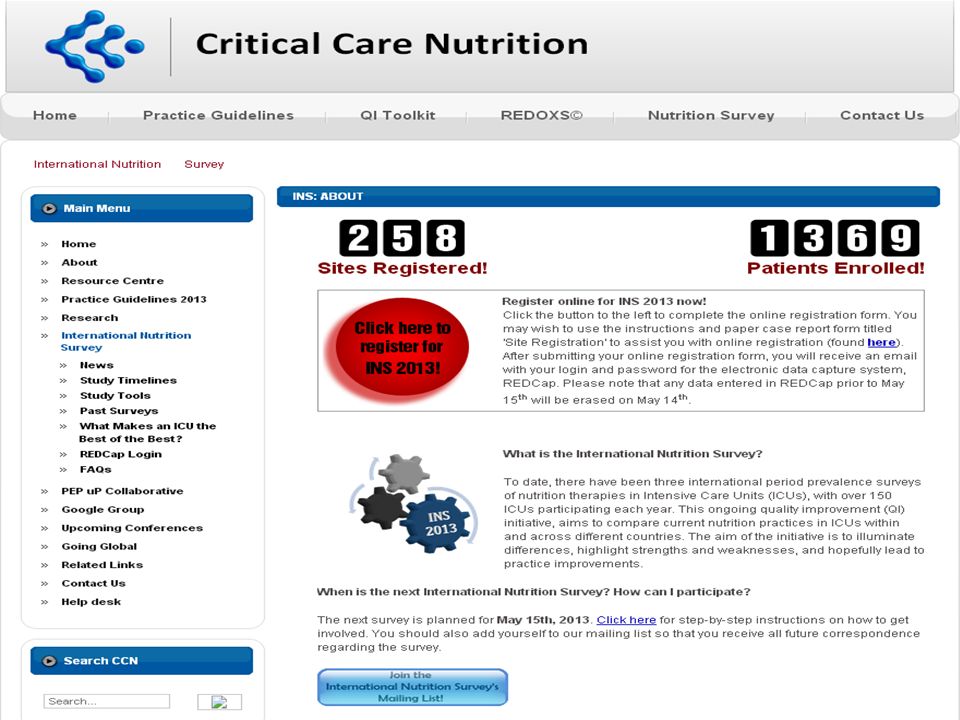
Point prevalence survey of nutrition practices in ICU’s around the world conducted Jan. 27, 2007
Enrolled 2772 patients from 158 ICU’s over 5 continents Included ventilated adult patients who remained in ICU >72 hours

18
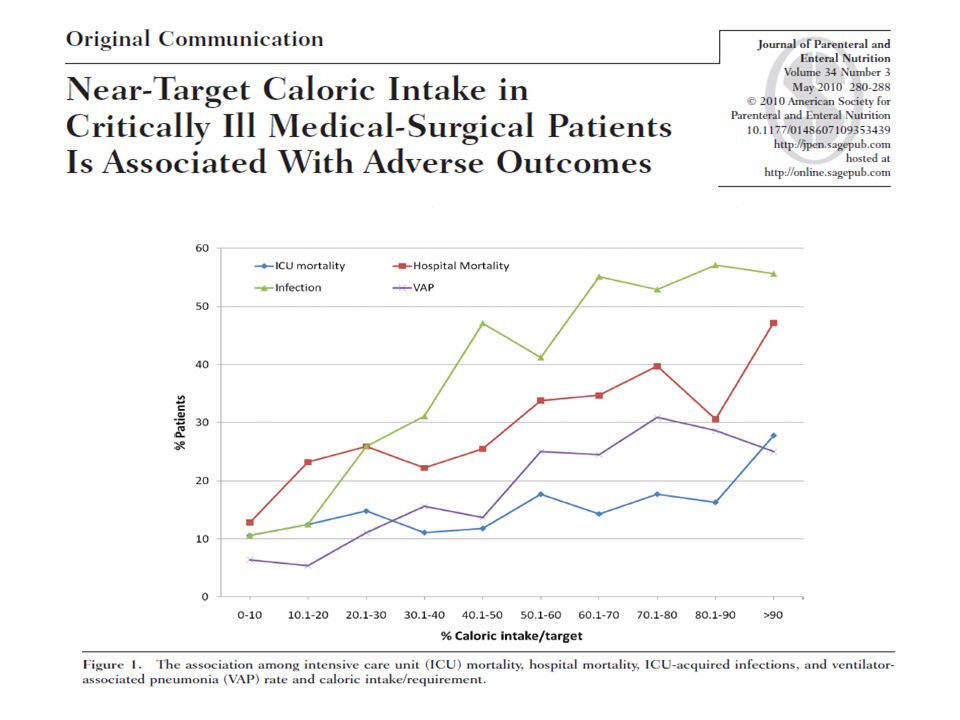
for increase of 1000 cal/day, OR of infection at 28 days
Effect of Increasing Amounts of Calories from EN on Infectious Complications Multicenter observational study of 207 patients >72 hrs in ICU followed prospectively for development of infection for increase of 1000 cal/day, OR of infection at 28 days Heyland Clinical Nutrition 2010

19
Relationship between increased nutrition intake and physical function (as defined by SF-36 scores) following critical illness For every 1000 kcal/day received: Model * Estimate (CI) P values At 3 months PHYSICAL FUNCTIONING 3.2 (-1.0, 7.3) P=0.14 ROLE PHYSICAL 4.2 (-0.0, 8.5) P=0.05 STANDARDIZED PHYSICAL COMPONENT SCALE 1.8 (0.3, 3.4) P=0.02 At 6 months 0.8 (-3.6, 5.1) P=0.73 2.0 (-2.5, 6.5) P=0.38 0.70 (-1.0, 2.4) P=0.41 for increase of 30 gram/day, OR of infection at 28 days Unpublished data from Multicenter RCT of glutamine and antioxidants (REDOXS Study); n=364
 P values. At 3 months. PHYSICAL FUNCTIONING. 3.2 (-1.0, 7.3) P=0.14. ROLE PHYSICAL. 4.2 (-0.0, 8.5) P=0.05. STANDARDIZED PHYSICAL COMPONENT SCALE. 1.8 (0.3, 3.4) P=0.02. At 6 months. 0.8 (-3.6, 5.1) P= (-2.5, 6.5) P= (-1.0, 2.4) P=0.41. for increase of 30 gram/day, OR of infection at 28 days. Unpublished data from Multicenter RCT of glutamine and antioxidants. (REDOXS Study); n=364.")
20
Mechancially Vent’d patients >7days (average ICU LOS 28 days)
Faisy BJN 2009;101:1079

21
113 select ICU patients with sepsis or burns
On average, receiving 1900 kcal/day and 84 grams of protein No significant relationship with energy intake but…… Clinical Nutrition 2012

22
How do we set optimal targets?

24
Methods to Determine Energy Requirements
60% Weight based 39% Complex formula 1% Indirect calorimetry Unpublished observations INS 2011

25
Small intestinal glucose absorption in the critically ill and health
ICU patients n = 28 Healthy subjects n = 16 Median (IQR) 3-OMG (mmol/L) P<0.05 glucose absorption (using 3-OMG as a marker; 3-OMG absorbed via same transporters as glucose, but renally excreted. Acccordingly, this OVERESTIMATES glucose absorption in the critically ill. Time (mins) Deane, et al. Crit. Care Med .(2011)
 3-OMG. (mmol/L) P<0.05. glucose absorption (using 3-OMG as a marker; 3-OMG absorbed via same transporters as glucose, but renally excreted. Acccordingly, this OVERESTIMATES glucose absorption in the critically ill. Time (mins) Deane, et al. Crit. Care Med .(2011)")
26
Malabsorption studies: faeces
Strack van Schijndel, et al. Clin. Nutr. 2006

27
More (and Earlier) is Better!
If you feed them (better!) They will leave (sooner!)
 They will leave (sooner!)")
29
Optimal Amount of Calories for Critically Ill Patients: Depends on how you slice the cake!
Objective: To examine the relationship between the amount of calories recieved and mortality using various sample restriction and statistical adjustment techniques and demonstrate the influence of the analytic approach on the results. Design: Prospective, multi-institutional audit Setting: 352 Intensive Care Units (ICUs) from 33 countries. Patients: 7,872 mechanically ventilated, critically ill patients who remained in ICU for at least 96 hours. Heyland Crit Care Med 2011
 from 33 countries. Patients: 7,872 mechanically ventilated, critically ill patients who remained in ICU for at least 96 hours. Heyland Crit Care Med")
30
Association between 12 day average caloric adequacy and
60 day hospital mortality (Comparing patients rec’d >2/3 to those who rec’d <1/3) A. In ICU for at least 96 hours. Days after permanent progression to exclusive oral feeding are included as zero calories* B. In ICU for at least 96 hours. Days after permanent progression to exclusive oral feeding are excluded from average adequacy calculation.* C. In ICU for at least 4 days before permanent progression to exclusive oral feeding. Days after permanent progression to exclusive oral feeding are excluded from average adequacy calculation.* D. In ICU at least 12 days prior to permanent progression to exclusive oral feeding* Remove the 1/3-2/3 data *Adjusted for evaluable days and covariates,covariates include region (Canada, Australia and New Zealand, USA, Europe and South Africa, Latin America, Asia), admission category (medical, surgical), APACHE II score, age, gender and BMI.
 A. In ICU for at least 96 hours. Days after permanent progression to exclusive oral feeding are included as zero calories* B. In ICU for at least 96 hours. Days after permanent progression to exclusive oral feeding are excluded from average adequacy calculation.* C. In ICU for at least 4 days before permanent progression to exclusive oral feeding. Days after permanent progression to exclusive oral feeding are excluded from average adequacy calculation.* D. In ICU at least 12 days prior to permanent progression to exclusive oral feeding* Remove the 1/3-2/3 data. *Adjusted for evaluable days and covariates,covariates include region (Canada, Australia and New Zealand, USA, Europe and South Africa, Latin America, Asia), admission category (medical, surgical), APACHE II score, age, gender and BMI.")
31
Association Between 12-day Caloric Adequacy and 60-Day Hospital Mortality
Optimal amount= 80-85% Heyland CCM 2011

32
RCT Level of Evidence that More EN= Improved Outcomes
RCTs of aggressive feeding protocols Results in better protein-energy intake Associated with reduced complications and improved survival Taylor et al Crit Care Med 1999; Martin CMAJ 2004 Meta-analysis of Early vs Delayed EN Reduced infections: RR 0.76 (.59,0.98),p=0.04 Reduced Mortality: RR 0.68 (0.46, 1.01) p=0.06
,p=0.04. Reduced Mortality: RR 0.68 (0.46, 1.01) p=")
33
More (and Earlier) is Better!
If you feed them (better!) They will leave (sooner!)
 They will leave (sooner!)")
35
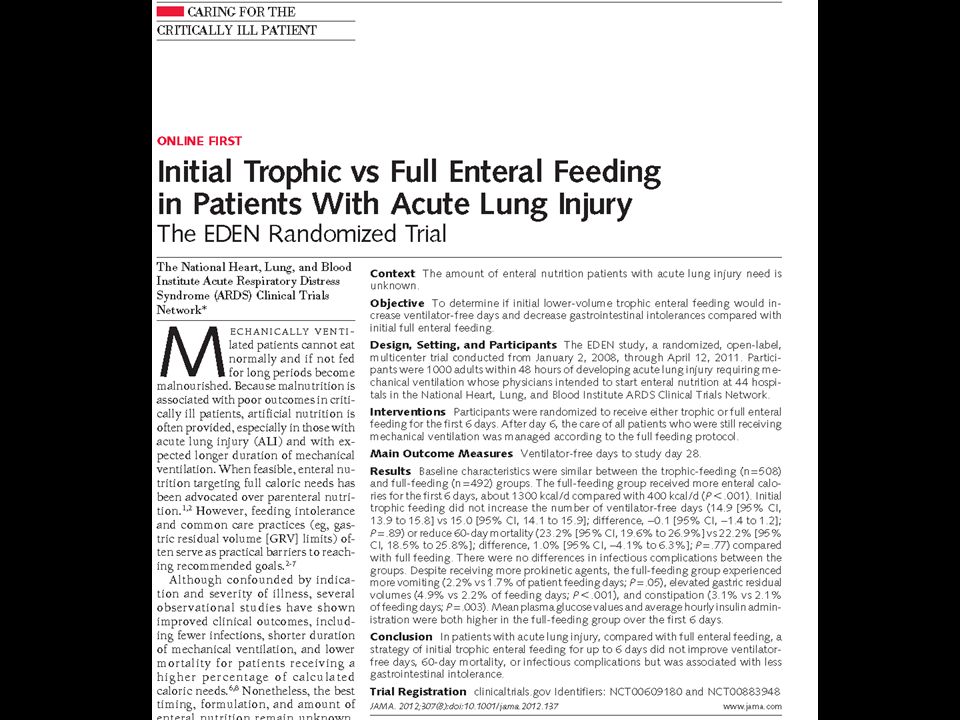
Rice et al. JAMA 2012;307

36
Still no measure of physical function!
Rice et al. JAMA 2012;307

37
Enrolled 12% of patients screened
Rice et al. JAMA 2012;307

38
No effect in young, healthy, overweight patients who have short stays!
Trophic vs. Full enteral feeding in critically ill patients with acute respiratory failure Average age 52 Few comorbidities Average BMI 29-30 All fed within 24 hrs (benefits of early EN) Average duration of study intervention 5 days No effect in young, healthy, overweight patients who have short stays!
 Average duration of study intervention 5 days. No effect in young, healthy, overweight patients who have short stays!")
39
ICU patients are not all created equal…should we expect the impact of nutrition therapy to be the same across all patients?

40
How do we figure out who will benefit the most from Nutrition Therapy?
Need picture of malnourshed child

41
A Conceptual Model for Nutrition Risk Assessment in the Critically Ill
Chronic Recent weight loss BMI? Acute Reduced po intake pre ICU hospital stay Starvation Nutrition Status micronutrient levels - immune markers - muscle mass Inflammation Acute IL-6 CRP PCT Chronic Comorbid illness

42
Multi institutional data base of 598 patients
The Development of the NUTrition Risk in the Critically ill Score (NUTRIC Score). When adjusting for age, APACHE II, and SOFA, what effect of nutritional risk factors on clinical outcomes? Multi institutional data base of 598 patients Historical po intake and weight loss only available in 171 patients Outcome: 28 day vent-free days and mortality Heyland Critical Care 2011, 15:R28
. When adjusting for age, APACHE II, and SOFA, what effect of nutritional risk factors on clinical outcomes Multi institutional data base of 598 patients. Historical po intake and weight loss only available in 171 patients. Outcome: 28 day vent-free days and mortality. Heyland Critical Care 2011, 15:R28.")
43
What are the nutritional risk factors associated with clinical outcomes? (validation of our candidate variables) Non-survivors by day 28 (n=138) Survivors by day 28 (n=460) p values Age 71.7 [60.8 to 77.2] 61.7 [49.7 to 71.5] <.001 Baseline APACHE II score 26.0 [21.0 to 31.0] 20.0 [15.0 to 25.0] Baseline SOFA 9.0 [6.0 to 11.0] 6.0 [4.0 to 8.5] # of days in hospital prior to ICU admission 0.9 [0.1 to 4.5] 0.3 [0.0 to 2.2] Baseline Body Mass Index 26.0 [22.6 to 29.9] 26.8 [23.4 to 31.5] 0.13 Body Mass Index 0.66 <20 6 ( 4.3%) 25 ( 5.4%) ≥20 122 ( 88.4%) 414 ( 90.0%) # of co-morbidities at baseline 3.0 [2.0 to 4.0] 3.0 [1.0 to 4.0] <0.001 Co-morbidity Patients with 0-1 co-morbidity 20 (14.5%) 140 (30.5%) Patients with 2 or more co-morbidities 118 (85.5%) 319 (69.5%) C-reactive protein¶ 135.0 [73.0 to 214.0] 108.0 [59.0 to 192.0] 0.07 Procalcitionin¶ 4.1 [1.2 to 21.3] 1.0 [0.3 to 5.1] Interleukin-6¶ 158.4 [39.2 to ] 72.0 [30.2 to 189.9] 171 patients had data of recent oral intake and weight loss (n=32) (n=139) % Oral intake (food) in the week prior to enrolment 4.0[ to ] 50.0[ to ] 0.10 % of weight loss in the last 3 month 0.0[ to ] 0.0[ to ] 0.06
 Survivors by day 28. (n=460) p values. Age [60.8 to 77.2] 61.7 [49.7 to 71.5] <.001. Baseline APACHE II score [21.0 to 31.0] 20.0 [15.0 to 25.0] Baseline SOFA. 9.0 [6.0 to 11.0] 6.0 [4.0 to 8.5] # of days in hospital prior to ICU admission. 0.9 [0.1 to 4.5] 0.3 [0.0 to 2.2] Baseline Body Mass Index [22.6 to 29.9] 26.8 [23.4 to 31.5] Body Mass Index <20. 6 ( 4.3%) 25 ( 5.4%) ≥ ( 88.4%) 414 ( 90.0%) # of co-morbidities at baseline. 3.0 [2.0 to 4.0] 3.0 [1.0 to 4.0] < Co-morbidity. Patients with 0-1 co-morbidity. 20 (14.5%) 140 (30.5%) Patients with 2 or more co-morbidities. 118 (85.5%) 319 (69.5%) C-reactive protein¶ [73.0 to 214.0] [59.0 to 192.0] Procalcitionin¶ 4.1 [1.2 to 21.3] 1.0 [0.3 to 5.1] Interleukin-6¶ [39.2 to ] 72.0 [30.2 to 189.9] 171 patients had data of recent oral intake and weight loss. (n=32) (n=139) % Oral intake (food) in the week prior to enrolment. 4.0[ 1.0 to 70.0] 50.0[ 1.0 to 100.0] % of weight loss in the last 3 month. 0.0[ 0.0 to 2.5] 0.0[ 0.0 to 0.0]")
44
The Development of the NUTrition Risk in the Critically ill Score (NUTRIC Score).
Variable Range Points Age <50 50-<75 1 >=75 2 APACHE II <15 15-<20 20-28 >=28 3 SOFA <6 6-<10 >=10 # Comorbidities 0-1 2+ Days from hospital to ICU admit 0-<1 1+ IL6 0-<400 400+ AUC 0.783 Gen R-Squared 0.169 Gen Max-rescaled R-Squared 0.256 BMI, CRP, PCT, weight loss, and oral intake were excluded because they were not significantly associated with mortality or their inclusion did not improve the fit of the final model.

45
The Validation of the NUTrition Risk in the Critically ill Score (NUTRIC Score).
.")
46
The Validation of the NUTrition Risk in the Critically ill Score (NUTRIC Score).
.")
47
Interaction between NUTRIC Score and nutritional adequacy (n=211)*
The Validation of the NUTrition Risk in the Critically ill Score (NUTRIC Score). Interaction between NUTRIC Score and nutritional adequacy (n=211)* P value for the interaction=0.01 Heyland Critical Care 2011, 15:R28
. Interaction between NUTRIC Score and nutritional adequacy (n=211)* P value for the interaction=0.01. Heyland Critical Care 2011, 15:R28.")
48
Who might benefit the most from nutrition therapy?
High NUTRIC Score? Clinical BMI Projected long length of stay Others?

49
Do we have a problem?

50
Preliminary Results of INS 2011 Overall Performance: Kcals
84% 56% 15% N=211

51
Failure Rate % high risk patients who failed to meet minimal quality targets (80% overall energy adequacy) Unpublished observations, Results of 2011 INS

52
Cahill, J Crit Care 2012 Dec;27(6):727-734
:")
53
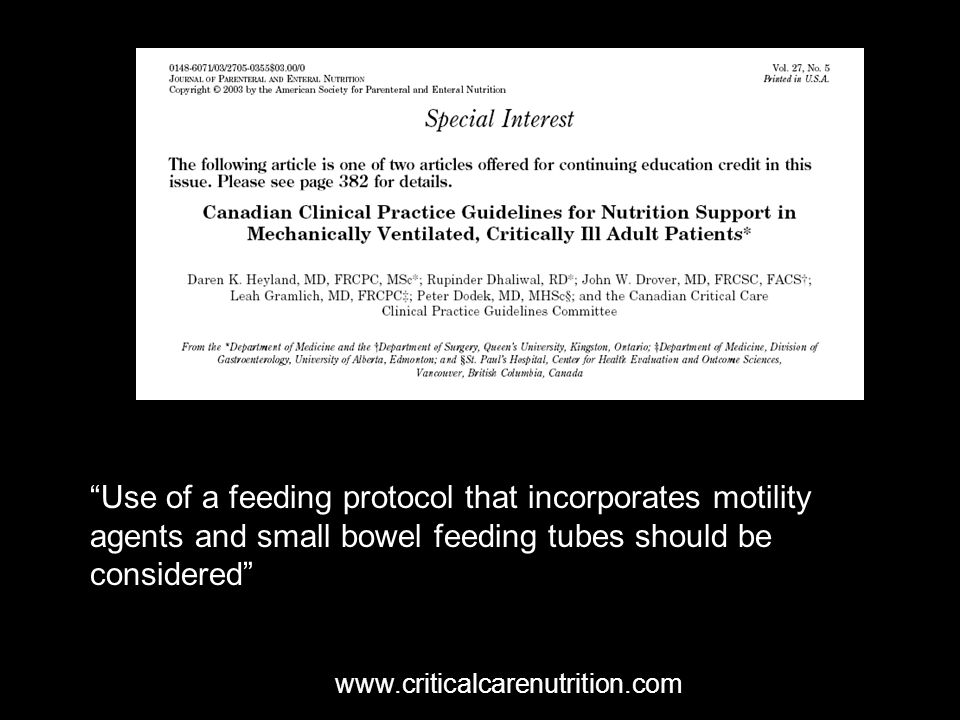
“Use of a feeding protocol that incorporates motility agents and small bowel feeding tubes should be considered”
54
Use of Nurse-directed Feeding Protocols
Start feeds at 25 ml/hr < 250 ml advance rate by 25 ml reassess q 4h > 250 ml hold feeds add motility agent reassess q 4h Check Residuals q4h “Should be considered as a strategy to optimize delivery of enteral nutrition in critically ill adult patients.” 2009 Canadian CPGs

55
Time to start EN from ICU admission:
The Impact of Enteral Feeding Protocols on Enteral Nutrition Delivery: Results of a multicenter observational study P<0.05 Time to start EN from ICU admission: 41.2 in protocolized sites vs 57.1 hours in those without a protocol Patients rec’ing motility agents: 61.3% in protocolized sites vs 49.0% in those without P<0.05 Heyland JPEN Nov 2010

56
The same thinking that got you into this mess won’t get you out of it!
Can we do better? The same thinking that got you into this mess won’t get you out of it!

57
Daren K. Heyland Enhanced Protein-Energy Provision
via the Enteral Route in Critically Ill Patients: The PEP uP Protocol Daren K. Heyland Professor of Medicine Queen’s University, Kingston General Hospital Kingston, ON Canada

58
A Major Paradigm Shift in How we Feed Enterally
The Efficacy of Enhanced Protein-Energy Provision via the Enteral Route in Critically Ill Patients: The PEP uP Protocol! Different feeding options based on hemodynamic stability and suitability for high volume intragastric feeds. In select patients, we start the EN immediately at goal rate, not at 25 ml/hr. We target a 24 hour volume of EN rather than an hourly rate and provide the nurse with the latitude to increase the hourly rate to make up the 24 hour volume. Start with a semi elemental solution, progress to polymeric Tolerate higher GRV threshold (300 ml or more) Motility agents and protein supplements are started immediately Nurse reports daily on nutritional adequacy. A Major Paradigm Shift in How we Feed Enterally
 Motility agents and protein supplements are started immediately. Nurse reports daily on nutritional adequacy. A Major Paradigm Shift in How we Feed Enterally.")
59
The Efficacy of Enhanced Protein-Energy Provision via the Enteral Route in Critically Ill Patients: The PEP uP Protocol! Adequacy of Calories from EN (Before Group vs. After Group on Full Volume Feeds) Day 1 Day 2 Day 3 Day 4 Day 5 Day 6 Day 7 Total P-value 0.08 0.0003 0.10 0.19 0.48 0.18 0.11 <0.0001 Heyland Crit Care 2010
 Day 1. Day 2. Day 3. Day 4. Day 5. Day 6. Day 7. Total. P-value < Heyland Crit Care")
60
% calories received/prescribed
Change of nutritional intake from baseline to follow-up of all the study sites (intervention group only) % calories received/prescribed Heyland CCM 2013 (in press)
 % calories received/prescribed. Heyland CCM 2013 (in press)")
61
Other Strategies to Maximize the Benefits and Minimize the Risks of EN
Liberalization of gastric residual volumes Motility agents started at initiation of EN rather that waiting till problems with High GRV develop. Small bowel feeding tubes Elevation of head of the bed Have nurse report on nutritional adquacy during daily ward rounds

62
Health Care Associated Malnutrition
What if you can’t provide adequate nutrition enterally? … to add PN or not to add PN, that is the question!

63
Early vs. Late Parenteral Nutrition in Critically ill Adults
4620 critically ill patients Randomized to early PN Rec’d 20% glucose 20 ml/hr then PN on day 3 OR late PN D5W IV then PN on day 8 All patients standard EN plus ‘tight’ glycemic control Results: Late PN associated with 6.3% likelihood of early discharge alive from ICU and hospital Shorter ICU length of stay (3 vs 4 days) Fewer infections (22.8 vs 26.2 %) No mortality difference Cesaer NEJM 2011
 Fewer infections (22.8 vs 26.2 %) No mortality difference. Cesaer NEJM")
64
Early vs. Late Parenteral Nutrition in Critically ill Adults
? Applicability of data No one give so much IV glucose in first few days No one practice tight glycemic control Right patient population? Majority (90%) surgical patients (mostly cardiac-60%) Short stay in ICU (3-4 days) Low mortality (8% ICU, 11% hospital) >70% normal to slightly overweight Not an indictment of PN Early group only rec’d PN for 1-2 days on average Late group –only ¼ rec’d any PN Cesaer NEJM 2011
 surgical patients (mostly cardiac-60%) Short stay in ICU (3-4 days) Low mortality (8% ICU, 11% hospital) >70% normal to slightly overweight. Not an indictment of PN. Early group only rec’d PN for 1-2 days on average. Late group –only ¼ rec’d any PN. Cesaer NEJM")
65
Lancet Dec 2012

66
Lancet Dec 2012

67
Lancet Dec 2012

68
Adult patients were eligible for enrollment within 24 hours of ICU admission if they were expected to remain in the ICU on the calendar day after enrollment, were considered ineligible for enteral nutrition by the attending clinician due to a short-term relative contraindication and were not expected to PN or oral nutrition Doig, ANZICS, JAMA May 2013

69
Who were these patients?
Overall, standard care group remained unfed for 2.8 days after randomization 40% of standard care group never rec’d any artificial nutrition; remained in ICU 3.5 days

70
Intervention not intense enough?
40% of both groups got EN (delayed) 40% of standard care group got PN for an average of 3.0 days Average PN use in early PN group was 6.0 days
 40% of standard care group got PN for an average of 3.0 days. Average PN use in early PN group was 6.0 days.")
71
Main inference: No harm by early PN (in contrast to EPaNIC)
Doig, ANZICS, JAMA May 2013

72
What if you can’t provide adequate nutrition enterally?
… to TPN or not to TPN, that is the question! Case by case decision Maximize EN delivery prior to initiating PN Use early in high risk cases

73
Start PEP UP within 24-48 hrs
At 72 hrs >80% of Goal Calories? YES No NO Yes Anticipated Long Stay? High Risk? Yes Carry on! No Maximize EN with motility agents and small bowel feeding No problem YES Yes NO Tolerating EN at 96 hrs? No Supplemental PN? No problem

74
R The TOP UP Trial Primary Outcome 60-day mortality PN for 7 days
Stratified by: Site BMI Med vs Surg ICU patients R BMI <25 60-day mortality BMI >35 Fed enterally Control

75
Muscle Outcome Assessments in TOP UP
Measures of muscle mass and function mitochondrial complex I activity US of femoral quad (baseline and follow up CTs when available) Hand grip strength 6 min walk test SF 36 (RP and PCS)
 Hand grip strength. 6 min walk test. SF 36 (RP and PCS)")
76
Reliability of US measure of Quad Muscle Layer Thickness
46 pairs of within operator measurements with an ICC of .98 73 pairs of operator 1 to operator 2 measurements with an ICC of .94. There was a small but statistically significant difference between the operator 1 and 2 results Mean (operator 1-2) (95% CI) = cm ( to ), p=
 (95% CI) = cm ( to ), p=")
77
Lancet 2009;273:

78
In Conclusion Health Care Associate Malnutrition is rampant
Not all ICU patients are the same in terms of ‘risk’ Iatrogenic underfeeding is harmful in some ICU patients or some will benefit more from aggressive feeding (avoiding protein/calorie debt) BMI and/or NUTRIC Score is one way to quantify that risk Need to do something to reduce iatrogenic malnutrition in your ICU! Audit your practice first! PEP uP protocol in all Selective use of small bowel feeds then sPN in high risk patients
 BMI and/or NUTRIC Score is one way to quantify that risk. Need to do something to reduce iatrogenic malnutrition in your ICU! Audit your practice first! PEP uP protocol in all. Selective use of small bowel feeds then sPN in high risk patients.")
79
Questions?

Similar presentations