Download presentation
Presentation is loading. Please wait.

1
Unit 7 Economics Macroeconomics
December 2, 2013

2
What is Economics?

3
The study of scarcity, or how society tries to satisfy unlimited wants through the use of limited resources.

4
Words to Know: Scarcity: the gap between what the consumers would like (UNLIMITED) and what the consumers can get (LIMITED). Trade Off: the process of giving up one desire in order to satisfy another desire. Opportunity Cost: the value of what we give up in order to get or do something else. (LOST)
")
5
Trade Offs &Opportunity Costs
Two highly talented athletes want to compete for Coach ‘M’ who has only 1 opening on the team. Each are equally talented. Since he can only keep one, he must choose: he decides to keep athlete ‘X’ because he is also a good student and is highly ‘coachable’. What was the trade off? What is the opportunity cost?

6
Opportunity cost is what you lost!

7
Need: something that is required
Examples: Want: something that is desired Good: a tangible product Service: a treatment (you cannot touch it!)
")
8
Production: the process of making goods or services.
Consumer: a buyer Examples: Producer: The seller Production: the process of making goods or services.

9
December 3, 2013

10
Review Budgeting Wage: $11.00 How much do they make an hour?
How much do they make a week? How much do they make a month? How much do they make a year? Salary: $110,000. How much do they make an hour? How much do they make a week? How much do they make a month? How much do they make a year?

11
Review, Opportunity Cost
On Saturday Ty’Shawn is thinking about going to the Panthers game. If he doesn’t go to the game he might stay home and work on homework, help his neighbor paint his house, or hang out and watch TV. What is an opportunity cost of Ty’shawn choosing to help his neighbor? What is the opportunity cost of choosing to go to college?

12
Review, Opportunity Cost
The North Carolina government decides to build more prisons at the cost of $20.5 Billion. In order to do this they will increase the sales tax. The state decided to build prisons instead of much needed schools, rehabilitation programs, and gun safety programs. John decided to go a party Friday night instead of studying for his Civics and Economics Test. Studying increases his chances of passing the Goal 6 test. He could have studied for his test, or gone to the movies.

13
Review, Opportunity Cost
Tom chose to get a massage this week instead of getting new sneakers or pay for his cell phone bill and cable bills. Carrie decided to spend her last $3.00 on a bottle of lotion. During lunch the next day she is unable to buy herself any food. She is hungry the rest of the day. She gets into her car and her gas light is on E. Jaquan studied all night for his Geometry Test. He wanted to go out with is friends and go see the new Happy Feet Movie. He passed his test with a 97%.

14
Personal Financial Literacy
Online!!!!! Visit Select ‘Login’ (on the top right) Select ‘Sign-Up’(on the top right) Put in Information you will remember!!!!! When you create a LOG-IN! REMEMBER YOUR INFORMATION! WRITE IT DOWN! TAKE A PICTURE! REMEMBER IT!!!!!!!!!!!!!!!!!!!!!!!! After you do this, get out a pair of headphones, and Sit tight and wait
 Select ‘Sign-Up’(on the top right) Put in Information you will remember!!!!! When you create a LOG-IN! REMEMBER YOUR INFORMATION! WRITE IT DOWN! TAKE A PICTURE! REMEMBER IT!!!!!!!!!!!!!!!!!!!!!!!! After you do this, get out a pair of headphones, and Sit tight and wait ")
15
3 Basic Economic Questions
What to produce? How to produce? For whom to produce?

16
THE FACTORS OF PRODUCTION What to produce?

17
There are 4 Factors of Production:
Land or Natural Resources Capital Labor Entrepreneurship

18
Land or Natural Resources
Materials that are NATURALLY MADE and transformed into something else Examples: Oil Timber Land Crops Natural gas Milk

19
2 Types of Natural Resources
RENEWABLE Can be replaced or renewed or recycled ex: wood, water, crops NON-RENEWABLE Once used, resource is gone Ex: Oil, Natural Gas, Gold

20
LABOR PEOPLE who work to produce a good or service Example:
Construction worker Teacher Line cook

21
ALWAYS a PERSON!

22
Types of Labor Blue Collar: typically performs “manual” labor (uniform) White Collar: typically performs more “business” like labor Professional: most advanced type of labor- highest educational degrees. Skilled: typically knows a craft

23
Capital PHYSICAL Man-made instruments that assist in making something else Examples: Hammer Robot Book Computer

24
ALWAYS a THING!

25
Capital HUMAN Training programs Skills development Advanced degrees
Investment in knowledge or training for a laborer to become more productive Examples: Training programs Skills development Advanced degrees

26
Entrepreneurs People who RISK time and money ($) to start their own business and organize the other factors of production. Examples: P. Diddy Lemonade Stands Martha Stewart

27
December 10, 2013

28
Agenda Notes: Computer Lab Productivity Types of Economies
30 Minutes-Part 1-3 PFL Project 30 Minutes on EverFi.com Everything is due by Friday

29
Productivity

30
Productivity The measure of the efficient use of an economy’s resources. Making the MOST of the resources you have. Utilizing resources to 100% of their capacity. UNDERUTILIZATION: not using resources efficiently Production Possibilities Curve: graphic representation of an economy’s productivity potential

31
A Production Possibilities Curve
Units of food Units of clothing (millions) (millions) 8m 7m m 6m m 5m m 4m m 3m m 2m m 1m m m Units of food (millions) Units of clothing (millions)
 (millions) 8m m 2.2m. 6m 4.0m. 5m 5.0m. 4m 5.6m. 3m 6.0m. 2m 6.4m. 1m 6.7m m. Units of food (millions) Units of clothing (millions)")
32
Productivity The more productive a nation’s economy, the more potential for profit. A company’s goal is to maximize profit. One way this can be done it to increase productivity.

33
Division of Labor When work is divided amongst many workers.
Each worker specializes in one task making the work go faster and more efficient.

34
Assembly Line Each member of the line does the same procedure or task on each input item. The more items created the more potential for profit a company has.

35
Specialization When each worker learns a specific/one job and becomes a professional in that specific task.

36
Law of Diminishing Returns
By adding more factors of production (i.e. technology, better trained workers, better entrepreneurship) it leads to greater efficiency. But ONLY to a certain point and then you begin to lose efficiency.
 it leads to greater efficiency. But ONLY to a certain. point and then you begin. to lose efficiency.")
37
Law of Diminishing Returns
Maximum returns is 300- using 200 agents. When you add any additional agents, the number of returns decreases.

38
Comparative Advantage
When a nation has an advantage in the production of a particular product over another. Example: The Southern Colonies had a comparative advantage to produce cotton over the New England Colonies.

39
Types of Economies

40
Types of Economic Systems
Traditional Command Market Mixed

41
Traditional Economy Determined by tradition, ancestors, customs
What did you Produce? Determined by tradition, ancestors, customs

42
How did you Produce it? Produce the same way its always been done; NO SPECIALIZATION For Whom did you Produce? Produce for tribe, village, local community Examples: Ex. Native American, Aborigines, Amish Barter: trade item for item (no money) * limited growth potential!
 * limited growth potential!")
43
Command Economy Determined by the government or central planner
What did you Produce? Determined by the government or central planner

44
How did you Produce it? Told how to by central planner; SPECIALIZATION For Whom did you Produce? The gov’t or central planner Ex. China, N. Korea, the former U.S.S.R. (Soviet Union)
")
45
Market Economy Determined by whatever would make the most profit
What did you Produce? Determined by whatever would make the most profit

46
The way that made the most profit; SPECIALIZATION
How did you Produce it? The way that made the most profit; SPECIALIZATION For Whom did you Produce? Consumers, people interested in product Ex. UNITED STATES!

47
Mixed Economies Have elements of market economies with some command
Ex. Canada, France, England

48
Pick up the THREE Sheets!
December 12, 2013 Pick up the THREE Sheets!

49
Agenda Housekeeping What time do we have left? Demand .ppt
Individual Work Changes Supply Supply and Demand, The Epic Merger Equilibrium Prices Shortages and Surpluses

50
The desire to own something and the ability to pay for it!
Demand The desire to own something and the ability to pay for it!

51
The Law of Demand The Law of Demand states that as prices decrease people are willing/able to buy more. As price increases people are willing/able to buy less. Inverse/opposite relationship P D P D

52
Demand Schedule Demand Curve
Price Quantity Demand Curve Graphic representation of the demand schedule. y-axis = price x-axis = quantity $5.00 100 $10.00 70 $15.00 50 $20.00 30 $25.00 20 $35.00 10

53
Market Demand Curves Show how people’s buying habits will change at certain prices ONLY Show a specific market only Assume no other factors change (just price)
")
54
WHY WOULD THERE BE A CHANGE IN DEMAND?
Shifts in Demand WHY WOULD THERE BE A CHANGE IN DEMAND? Consumer’s income changes: As income increases, demand increases. Consumer Expectations: if shortage is expected, demand increases Population Size: Population increases, demand increases

55
4. Consumer Taste: If a good becomes popular, demand increases.
5. Change in Price of Related Goods: * Compliments: goods bought together Comp. good price increases, the good’s demand decreases *Substitutes: goods used in place of one another. If a substitute price increases, the good’s demand increases

56
People’s Income Increases
Effect on Demand Demand Increases (shift right) P D1 D2 Q
 P. D1. D2. Q.")
57
Bad Weather (for product)
Effect on Demand Demand Decreases (shift left) P D1 D2 Q
 P. D1. D2. Q.")
58
Substitutes!

59
Compliments

60
Substitutes!

61
Compliments!

62
Substitutes!

63
Substitutes!

64
Compliments!

65
Price of Complementary Good Decreases ex: peanut butter & jelly
Effect on Demand Demand Increases (shift right) D1 D2 Q
 D1. D2. Q.")
66
Price of Substitute Good Decreases ex: Pepsi & Coca-Cola
Effect on Demand Demand Decreases (shift left) D1 D2 Q
 D1. D2. Q.")
67
ELASTIC DEMAND: demand that is very sensitive to a change in price
ELASTICITY of DEMAND: How much the quantity demanded will change if the price rises or falls? ELASTIC DEMAND: demand that is very sensitive to a change in price goods that one might stop buying or cut back on as price increased (SUVs, Luxury items)**on a graph this demand curve will be FLAT
**on a graph this demand curve will be FLAT.")
68
INELASTIC DEMAND: demand that is not very sensitive to a change in price
goods that you would buy at any price; there are few if any substitutes for these goods (milk, gas, prescription drugs) **on a graph this demand curve would be very steep.
 **on a graph this demand curve would be very steep.")
69
Independent Work! Work on the Predicting Demand Worksheet
Demand of Pizza!

70
The amount of goods or services available
Supply The amount of goods or services available

71
The Law of Supply states the higher the price, the larger the quantity produced
think like a producer now; at a higher price firms earn additional revenue and more firms will have incentive to enter the market) P S P S
 P S P S.")
72
Supply Schedule: shows only how price of goods changes the quantity supplied (all other factors remain constant) Price Quantity $0.50 100 $1.00 150 $1.50 200 $2.00 250 $2.50 300 $3.00 350

73
Supply Curve: Graphic representation of the supply schedule
Supply Curve: Graphic representation of the supply schedule. (rises from left to right) y-axis = price x-axis = quantity supplied
 y-axis = price x-axis = quantity supplied.")
74
WHY WOULD THERE BE A CHANGE IN SUPPLY?
Shifts in Supply WHY WOULD THERE BE A CHANGE IN SUPPLY? Change in the Price of an Input: Rise in input cost means decrease in supply because it is too expensive to make, and a fall in input cost will increase supply at all price levels. 2. Technology – lowers cost and increases supply.

75
Government subsidy: payment by the gov’t that supports a business or market. Subsidies increase supply. Increase or Decrease in taxes: increasing taxes decreases supply, decreasing taxes increases supply 5. Government Regulation: Usually increases cost of production and decreases supply. (emission control on cars, FDA nutritional codes on food products)
")
76
6. Future expectation of Prices: expect the price to go up the supplier will store goods to sell more in future. 7. Number of suppliers: as more suppliers enter a market to produce a good the market supply of the good will rise (and the opposite)
")
77
Costs of Inputs Decrease
Effect on Supply Supply Increases (shift right) P S1 S2 Q
 P. S1. S2. Q.")
78
Number of Suppliers Increases
Effect on Supply Supply Increases (shift right) P S1 S2 Q
 P. S1. S2. Q.")
79
Weather is bad for product
Effect on Supply Supply Decreases (shift left) S2 P S1 Q
 S2. P. S1. Q.")
80
Ex. Things that are cheap, use few resources, made quickly
Elasticity of Supply is a measure of the way suppliers respond to a change in price Elastic Supply – a small increase in price has a big effect on supply (flat) Ex. Things that are cheap, use few resources, made quickly
 Ex. Things that are cheap, use few resources, made quickly.")
81
Ex. Diamonds, Bentley, Gas
Inelastic Supply – a small increase in price has a small effect on supply (steep) Goods that are limited, take many resources to produce, require a lot of time to produce. Ex. Diamonds, Bentley, Gas
 Goods that are limited, take many resources to produce, require a lot of time to produce. Ex. Diamonds, Bentley, Gas.")
82
Change in Supply

83
Reasons for change in Supply
Cost of Inputs Number of Suppliers Weather

84
Situation #1 Dick’s Sporting Goods and Academy goes out of business. What is the impact on basketballs in Charlotte? -number of suppliers changes -Supply Decreases

85
Situation #2 A hurricane destroys the orange groves in Florida. What is the impact on the supply of Orange Juice? -weather changes -Supply Decreases

86
Situation #3 The price of gas decreases. What is the impact of trucking companies? -cost of inputs change -Supply Increases

87
Situation #4 Nike moves their factory from the U.S. to China where workers are paid less. What is the impact on the supply of Nike’s shoes? -change in input costs -Supply Increases

88
Supply & Demand

89
Equilibrium: the point at which quantity demanded and quantity supplied are equal
At a point of equilibrium…. the price and quantity are balanced the market for a good/service is stable Disequilibrium: any price or quantity not at equilibrium

90
Price of CDs Quantity Demanded Quantity Supplied $5.00 100 10 $10.00 80 20 $15.00 30 $20.00 $25.00

91
A Fully Labeled Supply & Demand
Equilibrium Point E1 P1 Market Clearing Price D1 Q Q1

92
Excess Demand (SHORTAGE): when quantity demanded is more than quantity supplied
Price is too low! not enough! E1 P1 D1 Q QS QD

93
Excess Supply (SURPLUS): when quantity supplied is more than quantity demanded
Left-overs Price is too high! P1 E1 D1 Q QD QS

94
A shift in the demand curve or the supply curve will result in a new equilibrium price.

95
Orange Juice PRICE ____ QUANTITY____ BECAUSE OF A CHANGE IN SUPPLY S2
D1 Q2 Q1 Q

96
Coca-Cola PRICE ____ QUANTITY____ BECAUSE OF A CHANGE IN DEMAND S1 P

97
Video Games PRICE ____ QUANTITY____ BECAUSE OF A CHANGE IN DEMAND S1 P

98
Clothing PRICE ____ QUANTITY____ BECAUSE OF A CHANGE IN SUPPLY S1 P S2
D1 Q1 Q2 Q

99
Government Intervention in a Market Economy
Price Ceiling: a maximum price that can be legally charged for a good or service (example: rent control) Price Floor: a minimum price for a good or service (example: minimum wage)
 Price Floor: a minimum price for a good or service. (example: minimum wage)")
100
Price Floor S1 P E1 MCP Price Floor D1 Q

101
Price Ceiling S1 P Price Ceiling E1 MCP D1 Q

102
Changing Prices Inflation: a general increase in prices (over the years, prices rise and fall, but in the American economy, they have mostly risen) Deflation: A substantial drop in the prices

103
Economic Theories

104
Capitalism an economic system in which private citizens own and use the factors of production in order to seek a profit Free Enterprise/Market Economy: another term used to describe the American economy

105
Features of Capitalism
1. Private Ownership of Resources: we have the freedom to own and use, or dispose of, our own property as we choose. This gives us the incentive to work, save, and invest because we can keep what we earn.

106
Consumers have the right to choose the products that we will buy.
2. Self Interest Motives (economic freedom): Each person can choose the type of job to have and when and where they want to work. Consumers have the right to choose the products that we will buy. Businesses have the right to choose the products that they will produce and sell.
: Each person can choose the type of job to have and when and where they want to work. Consumers have the right to choose the products that we will buy. Businesses have the right to choose the products that they will produce and sell.")
107
3. Consumer Sovereignty: the idea that the consumer is the “king” or ruler of the market
the one who determines what products will be produced businesses try to produce the products that people want most.

108
4. Available Markets: places where the prices of goods and services are determined as exchange takes place. 5. Competition: the struggle that goes on between buyers and sellers to get the best products at the lowers prices.

109
Adam Smith: Father of Capitalism
Smith believed that all individuals seeking a profit end up benefiting society as a whole. wrote The Wealth of Nations developed the idea of laissez-faire economics. (“to let alone”) the government should not interfere in the market place.
 the government should not interfere in the market place.")
110
Adam Smith: Father of Capitalism
believed that the invisible hand guides a nation’s resources to their most productive use. Tools of the invisible hand include self-interest and competition.

111
Karl Marx: Father of Communism
Command Economy Equality of the classes wrote the Communist Manifesto. “ Workers of all lands, unite”

112
Types of Business Structures

113
What is Liability? Unlimited liability: Risk extends beyond your share in a company. (you could lose EVERYTHING!) Limited Liability: Risk only involves your share of the company.

114
Sole-Proprietorship Description Advantages Disadvantages
A business owned and managed by a single individual Advantages Disadvantages Easy to start - Unlimited Liability Sole receiver of profit Limited Life Full control No additional taxes

115
Partnership Description Advantages Disadvantages
a business organization owned by two or more persons Advantages Disadvantages Easy to start - Share Profits Specialization - Unlimited liability No additional taxes - potential for conflict

116
Corporation Description
a legal entity owned by individual stockholders Stockholders own shares of stock – a certificated ownership in a corporations. Stockholders are part owners of the corporation. Advantages Disadvantages Limited Liability - expensive to start Transferable ownership - Double taxes Long life Potential for growth more requirements & regulations

117
Franchise Description Advantages Disadvantages
Semi-independent company that is part of a parent corporation Advantages Disadvantages Built-in reputation Loss of freedom & decision making Limited Liability

118
Non-Profit A business that operates under a plan that distributes the profits made to other charitable organizations. Advantages Disadvantages Tax Exempt Relies on charity Provides Services Follows Market

119
Multinational Corporations
Definition – a large corporation that produces and sells its goods and services throughout the world Advantages Disadvantages Provides jobs & Low wages products around the world Poor working conditions Spread new technology around the world Increases standard of living in many poor countries

120
Corporate Combinations
Horizontal Merger – joining of two or more firms competing in the same market with the same good or service EX: Sprint buys Nextell, AT&T buys Suncom Vertical Merger – joining of two or more firms involved in different stages of producing the same good or service. EX: Oils companies buy oil fields, tankers, and gas stations

121
The Circular Flow Model

122
Shows the movement of resources within an economic system.
Markets: place where goods & services are exchanged. Sectors: units of consumers or producers

124
Product Market Provides goods & services to the following sectors:
-consumer -business -government -foreign

125
Factor Market Receives labor and resources from the following sectors:
-consumer -business -government

126
Consumer Sector Provides LABOR to the FACTOR MARKET
Purchases GOODS & SERVICES from the PRODUCT MARKET.

127
Business Sector Receives resources from the FACTOR MARKET.
Sends finished goods to the PRODUCT MARKET. Purchases goods from the PRODUCT MARKET to make other goods.

128
Gov’t Sector Receives resources from the FACTOR MARKET.
Provides goods & services to the PRODUCT MARKET. Purchases goods & services from the PRODUCT MARKET.

129
Foreign Sector Buys and sells goods & services in the PRODUCT MARKET.

130
The circular flow of goods and incomes
fig

131
The circular flow of goods and incomes
Goods and services fig

132
The circular flow of goods and incomes
Goods and services $ Consumer expenditure fig

133
Services of factors of production (labor, etc)
The circular flow of goods and incomes Goods and services $ Consumer expenditure fig Services of factors of production (labor, etc)
")
134
Services of factors of production (labor, etc)
The circular flow of goods and incomes Goods and services $ Consumer expenditure Wages, rent dividends, etc. $ fig Services of factors of production (labor, etc)
")
135
Conglomerate – merging of more than three businesses that make unrelated products
EX: Phillip Morris & Kraft, General Electric & NBC

136
Types of Market Structures

137
Perfect Competition Many buyers and sellers in the market
Sellers offer identical products Buyers and sellers are well informed about products Sellers are able to enter and exit the market freely

138
Perfectly competitive markets are efficient at equilibrium!!
Few markets are perfectly competitive because barriers keep the companies from entering or leaving markets easily start-up costs are high many require high degrees of technology

139
Monopoly A market dominated by a single seller
No variety of goods and the seller has complete control over prices Forms when barriers prevent firms from entering a market with only one seller

140
Government Monopoly: a monopoly created by the government
Natural Monopoly: a market that runs most efficiently when one large firm supplies all of the output Example: public output Government Monopoly: a monopoly created by the government Ex: allowing a natural monopoly to form Ex: patent: inventor of the new product has exclusive rights to sell it

141
Antitrust laws: laws that encourage competition in the market
Remember one of the goals of the gov’t in the US has been to encourage competition in the economy Antitrust laws: laws that encourage competition in the market Sherman Antitrust act: banned monopolies and other business combinations that prevented competition 1890)…this act was used to break up companies like AT&T
…this act was used to break up companies like AT&T.")
142
Oligopoly a market structure in which a few large firms dominate a market (4 largest firms produce 70-80% of the output) barriers can also create oligopolies…like start-up costs and technology Ex: cell phones, airlines, cruise ships

143
Stop!!! End Economics Part 3

144
Unit-8

145
Emani Cruz Enizaha Irvin Danixia Jiron India Livingston Lesley Sanchez Nicolas Warren Richard Watson

146
The Business Cycle

147
Economic Indicators 1. GDP – Gross Domestic Product - measures the output of the entire economy 2. Personal Income - measures the total income of families in one year, higher the income the more money they have to spend 3. Stock Market Averages - reflects investors attitude and (S&P500, The Dow) movement of interest rates 4. Unemployment rate- reflects layoffs of workers; how many unemployed at one time
 movement of interest rates 4. Unemployment rate- reflects layoffs of workers; how many unemployed at one time")
148
Expansion: a period of economic growth real GDP rises Employment increases Production increases Money supply increases Consumer spending increases Prices increase (INFLATION)
")
149
Peak: The highest point in the business cycle Full Employment (those who want a job have a job) Production at full capacity Money supply high Consumer spending high Prices high

150
Contraction: a period of economic decline real GDP declines Employment decreases Production decreases Money supply decreases Consumer spending decreases Prices decrease (DEFLATION) Long contraction (6 months) called a RECESSION
 Long contraction (6 months) called a RECESSION.")
151
Trough: The lowest point in the business cycle High rates of unemployment Production nearing a standstill Money supply low (limited lending) Consumer spending low Prices low Long period (1 yr.) called a DEPRESSION
 Consumer spending low. Prices low. Long period (1 yr.) called a DEPRESSION.")
152
Building permits- indicates construction activity
Manufacturers’ new orders- predicts actual production change Consumer Price Index - measures the rate of change in the price of 400 consumer goods

153
December 17, 2013 Grab a MAP!

154
The Stock Market Buying Stock:
Corporations sell stock to raise funds. Stock represents ownership in the corporation and is issued in portions called shares.

155
Stockholders make money through:
dividends- a portion of a corporation’s profit, usually paid out quarterly capital gains- money made when an investor sells stock for more than he/she paid for it Stockholders lose money through: capital loss- money lost when an investor sells stock for less than he/she paid for it or when a company doesn’t make a profit, and can’t pay out dividends

156
Stock split- when each single share of stock splits into more than one share. This is done to encourage investors to buy the stock, and generally results in a rise in stock value afterwards. Stock Trade: Stockbrokers- link buyers and sellers of stock; usually work for a brokerage firm that specializes in trading stock.

157
Stock is bought and sold on stock exchanges. Most important in the US:
New York Stock Exchange (NYSE)- the country’s largest and most powerful exchange; only for the largest and best-known companies (called blue chip companies) OTC Market (over the counter)- stock sold electronically Nasdaq (National Association of Securities Dealers Automated Quotations)- the American market for over-the counter trades Daytraders- buy and sell stock rapidly in hopes of trying to make a profit; very risky
- the country’s largest and most powerful exchange; only for the largest and best-known companies (called blue chip companies) OTC Market (over the counter)- stock sold electronically. Nasdaq (National Association of Securities Dealers Automated Quotations)- the American market for over-the counter trades. Daytraders- buy and sell stock rapidly in hopes of trying to make a profit; very risky.")
158
Measuring the Stock Market
Bull Market- when the stock market steadily rises over a period of time Bear Market- when stock market steadily falls over a period of time The picture of stock performance can be determined by looking at the Dow Jones Industrial- which represents about 30 large companies S & P 500 (Standard and Poors)- which tracks price changes in 500 companies.
- which tracks price changes in 500 companies.")
159
Fiscal & Monetary Policy

160
What is the purpose of Fiscal and Monetary Polices?
To ensure economic expansions and contractions are not too severe NOT

161
Economic Problem: Inflation
Occurs when the market is flooded with too much money in the hands of consumers So… the Goal is to DECREASE the amount of $ in the hands of consumers

162
Fiscal Policy (Congress)
Taxes Gov’t Spending Welfare (transfer) payments
 payments.")
163
Economic Problem: Unemployment
Occurs when the market slows down due to a lack of consumer spending. So… the Goal is to INCREASE the amount of $ in the hands of consumers

164
Fiscal Policy (Congress)
Taxes Gov’t Spending Welfare (transfer) payments
 payments.")
165
Economic Problem: Inflation
Occurs when the market is flooded with too much money in the hands of consumers So… the Goal is to DECREASE the amount of $ in the hands of consumers

166
Monetary Policy (Federal Reserve)
Interest (Discount) Rates Reserve Ratio Sell Bonds TIGHT Monetary Policy
 Rates. Reserve Ratio. Sell Bonds. TIGHT Monetary Policy.")
167
Economic Problem: Unemployment
Occurs when the market slows down due to a lack of consumer spending. So… the Goal is to INCREASE the amount of $ in the hands of consumers

168
Monetary Policy (Federal Reserve)
Interest (Discount) Rates Reserve Ratio Buy Bonds LOOSE Monetary Policy
 Rates. Reserve Ratio. Buy Bonds. LOOSE Monetary Policy.")
169
December 18, 2013

170
Government Regulations
P. 2 #5

171
Social Security Act of 1935 (SSA)
WHAT IT DID Provides money to people who cannot support themselves IMPACT ON US ECONOMY Stabilizes the economy in times of economic depression

172
National Labor Relations Act, 1935
WHAT IT DID Workers have the right to join unions and use collective bargaining IMPACT ON THE US ECONOMY Gave protection and power to the workers

173
Definitions Unions- an organized association of workers formed to protect and further their rights and interests; a labor union. Collective Barganing- negotiation of wages and other conditions of employment by an organized body of employees.

175
Fair Labor Act, 1938 WHAT IT DID IMPACT ON THE US ECONOMY
Est. minimum wage of 25 cents per hour and time and a half for overtime IMPACT ON THE US ECONOMY Set a price floor on labor for the U.S.

176
Taft Hartley Act, 1947 WHAT IT DID IMPACT ON THE US ECONOMY
Put restrictions on labor unions IMPACT ON THE US ECONOMY Unions cannot be all powerful

177
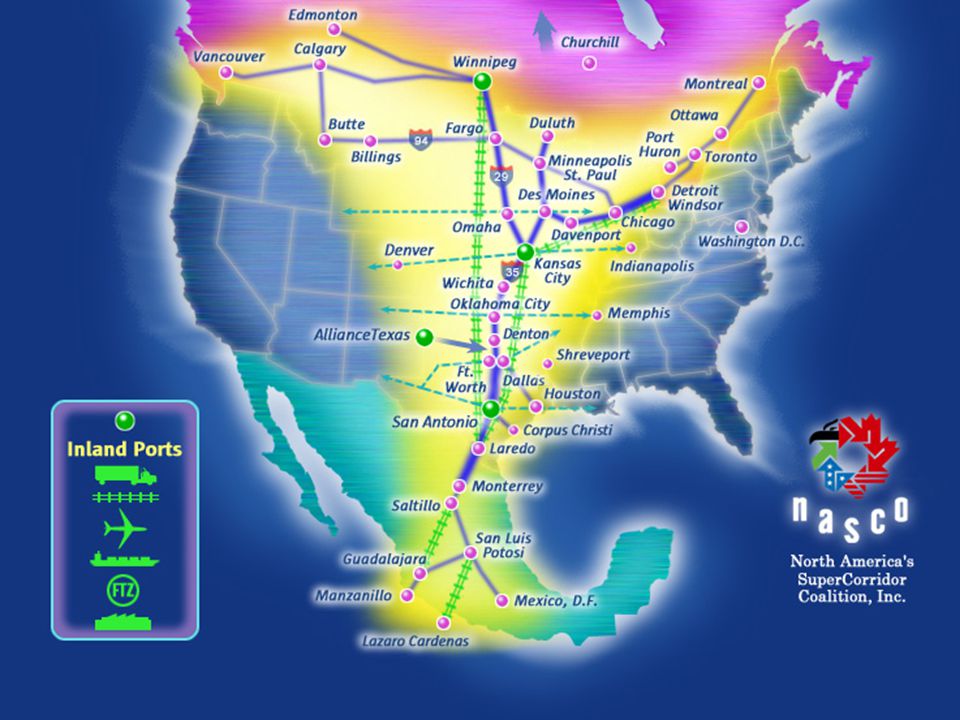
Economic Globalization
North American Free Trade Agreement (NAFTA) World Trade Organization, WTO European Union (EU) International Monetary Fund (IMF) World Bank United Nations
 World Trade Organization, WTO. European Union (EU) International Monetary Fund (IMF) World Bank. United Nations.")
178
NAFTA On January 1, 1994, the North American Free Trade Agreement between the United States, Canada, and Mexico (NAFTA) entered into force. It allows these countries to trade freely with no import or export taxes It is supposed to increase trade in North America Many US Companies moved or outsourced their jobs to Mexico in order to decrease labor cost

181
World Trade Organization
The World Trade Organization (WTO) is the only global international organization dealing with the rules of trade between nations. It allows for a legal body to oversee trade between nations
 is the only global international organization dealing with the rules of trade between nations. It allows for a legal body to oversee trade between nations.")
182
European Union The EU was created in the aftermath of the Second World War. to foster economic cooperation a huge single market has been created and continues to develop towards its full potential

184
IMF an organization of 188 countries
working to foster global monetary cooperation secure financial stability facilitate international trade promote high employment and sustainable economic growth reduce poverty around the world.

185
World Bank End extreme poverty around the world in one generation!
End extreme poverty by decreasing the percentage of people living on less than $1.25 a day to no more than 3% Promote shared prosperity by fostering the income growth of the bottom 40% for every country

186
The United Nations The United Nation is a legislative organization that fosters: Peace and Security Development Human Rights Humanitarian Affairs International Law

187
The United States Major Economic Regions

188
The Frost Belt The Frost Belt is a region of the US considered to include the Northeast of the Great Lakes Region, and much of the Upper Midwest. The region is known for its cold, frost-producing winters and heavy snowfall.

189
The Rust Belt A postindustrial region straddling the NE and the East North Central States, referring to economic decline, population loss and urban decay due to the shrinking of its once powerful industrial sector. The term gained popularity in the United States in the 1980s

190
Sun Belt The main defining feature of the Sun Belt is its warm-temperate climate with extended summers and brief, relatively mild winters; Florida, the Gulf Coast, and southern Texas, however, have a true subtropical climate. The Belt has seen substantial population growth since the 1960s due to an influx of immigrants, both documented and undocumented; a surge in retiringbaby boomers; and the attractiveness of a mild winter climate.

191
The Sun Belt

192
Silicon Valley It is home to many of the world's largest technology corporations as well as thousands of small startups. The term originally referred to the region's large number of silicon chip innovators and manufacturers, but eventually came to refer to all high-tech businesses in the area, and is now generally refers to the American high-technology sector. Silicon Valley continues to be a leading hub for high-tech innovation and development, accounting for one-third (1/3) of all of the venture capital investment in the United States. Geographically, Silicon Valley encompasses all of the Santa Clara Valley, the southern Peninsula, and the southern East Bay.
 of all of the venture capital investment in the United States. Geographically, Silicon Valley encompasses all of the Santa Clara Valley, the southern Peninsula, and the southern East Bay.")
193
Silicon Valley

194
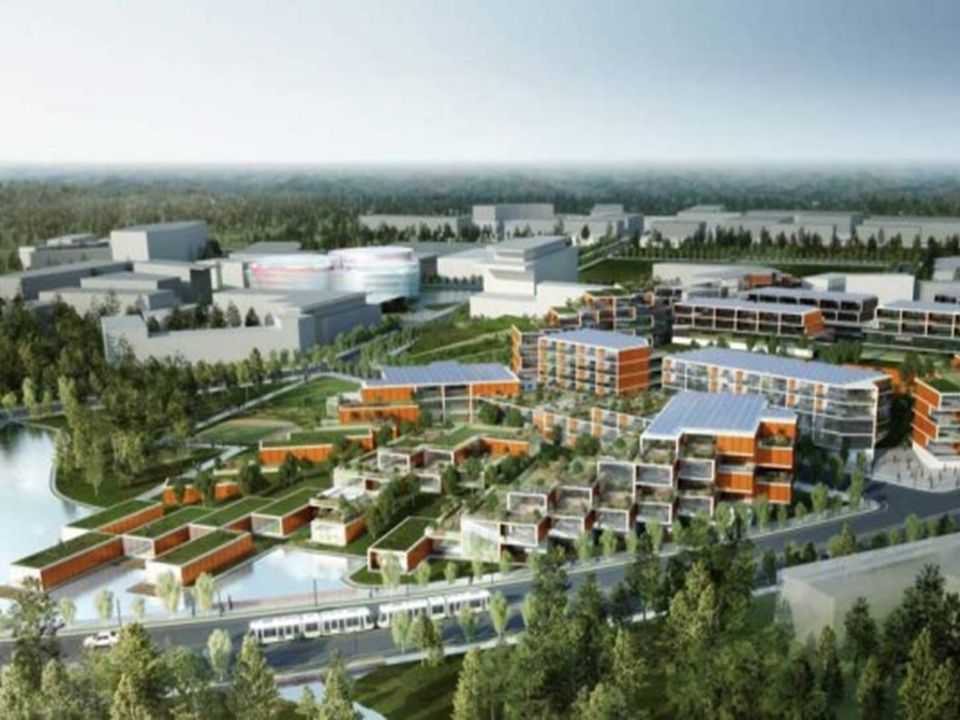
North Carolina Research Triangle
The Research Triangle Park is home to more than 170 global companies, including: IBM, GSK, Syngenta, RTI International, Credit Suisse, and Cisco,that foster a culture of scientific advancement and competitive excellence. RTP is located between three major universities: Duke University in Durham, North Carolina State University in Raleigh, and the University of North Carolina at Chapel Hill.

Similar presentations


 Services:>")


