Download presentation
Presentation is loading. Please wait.

1
Utah Association of Local Health Departments
Quality Improvement Workshop September 21st and 22nd, 2011

2
Workshop Overview Welcome Remarks Introductions Why are we here? Expectations Pre Test

3
Innovative Solutions. Measurable Results.
…PHF Mission: We improve the public’s health by strengthening the quality and performance of public health practice Innovative Solutions. Measurable Results. 3

4
Contact Information Jack Moran T: – 0560 Grace Duffy T: cell

5
Introduction to QI

6
Lao-Tse, 5th-century BC philosopher
"If you tell me, I will listen. If you show me, I will see. But if you let me experience, I will learn.“ Lao-Tse, 5th-century BC philosopher

7
Why Quality Improvement?
Foundation of new accreditation program Results of investment in public health Getting better all the time The Public Health Accreditation Board’s voluntary accreditation program for state, local, tribal and territorial health departments is based on quality improvement. Particularly important in tough economic times to demonstrate to our public that their investment in the work we do is a good one. QI offers a platform to demonstrate our commitment to ensuring high quality services We know we’re good at what we do, and QI tools will help us quantify – show in numerical terms – that we are getting better all the time

8
Definition of Quality Improvement In Public Health
“Quality improvement in public health is the use of a deliberate and defined improvement process, such as Plan- Do-Check-Act, which is focused on activities that are responsive to community needs and improving population health. It refers to a continuous and ongoing effort to achieve measurable improvements in the efficiency, effectiveness, performance, accountability, outcomes, and other indicators of quality in services or processes which achieve equity and improve the health of the community.” Defining Quality Improvement in Public Health; Journal of Public Health Management & Practice: January/February Volume 16 - Issue 1 - p 5–7, Riley, William J. PhD; Moran, John W. PhD, MBA, CQIA, CQM, CMC; Corso, Liza C. MPA; Beitsch, Leslie M. MD, JD; Bialek, Ronald MPP; Cofsky, Abbey -

9
Continuous Improvement
The continuous improvement phase of a process is how you make a change in direction. The change usually is because the process output is deteriorating or customer needs have changed 9

10
Continuous Quality Improvement System in Public Health
Turning Point Baldrige QI Teams LSS MAPP MICRO Big ‘QI’ MACRO A P Little ‘qi’ C D Basic Tools of QI A P A P C D Individual ‘qi’ MESO C D INDIVIDUAL A S QFD Rapid Cycle C D Advance Tools of QI Daily Management

11
General Approach On How To Use The Basic Tools Of Quality Improvement
“AIM” Issue To Consider Brainstorm & Consolidate Data Flow Chart Existing Process Cause & Effect Diagram – Greatest Concern Brainstorming Force and Effect “As Is” State Use 5 Whys To Drill Down To Root Causes Monitor New Process & Hold The Gains Run Charts Control Charts Flow Chart New Process Analyze Information and Develop Solutions Translate Data Into Information Gather Data On Pain Points Solution and Effect Diagram Pie Charts Pareto Charts Histograms Scatter Plots, etc. Data Management Strategy “As Is” State to “Should Be” State Source: The Public Health Quality Improvement Handbook, R. Bialek, G. Duffy, J. Moran, Editors, Quality Press, © 2009, p.160

12
Quick Check Of Your Enthusiasm Level & Mathematical Skills

13
High/High High/Low Enthusiasm Level Low/High Low/Low
Mathematical Skills

14
High/High High/Low Enthusiasm Level Low/High Low/Low
Mathematical Skills

15
QA, QC, QI Plan Assure Strategic Preventive Control Tactical
Operational Real time Inspect After the fact

16
They Are Not the Same Quality Assurance Quality Improvement Reactive
Works on problems after they occur Regulatory usually by State or Federal Law Led by management Periodic look-back Responds to a mandate or crisis or fixed schedule Meets a standard (Pass/Fail) Quality Improvement Proactive Works on processes Seeks to improve (culture shift) Led by staff Continuous Proactively selects a process to improve Exceeds expectations
 Quality Improvement. Proactive. Works on processes. Seeks to improve (culture shift) Led by staff. Continuous. Proactively selects a process to improve. Exceeds expectations.")
17
Contrasting Big “QI”, Little “qi”, and Individual “qi
Topic Big ‘QI’ – organization-wide Little ‘qi’ – program/unit Individual ‘qi’ Improvement Quality Improvement Planning Evaluation of Quality Processes Goals System focus Tied to the Strategic Plan Responsiveness to a community need Cut across all programs and activities Strategic Plan Specific project focus Program/unit level Performance of a process over time Delivery of a service Individual program/unit level plans Daily work level focus Tied to yearly individual performance Performance of daily work Daily work Individual performance plans Contrasting Big “QI”, Little “qi”, and Individual “qi

18
General Approach On How To Use The Basic Tools Of Quality Improvement
“AIM” Issue To Consider Brainstorm & Consolidate Data Flow Chart Existing Process Cause & Effect Diagram – Greatest Concern Brainstorming Force and Effect “As Is” State Use 5 Whys To Drill Down To Root Causes Monitor New Process & Hold The Gains Run Charts Control Charts Flow Chart New Process Analyze Information and Develop Solutions Translate Data Into Information Gather Data On Pain Points Solution and Effect Diagram Pie Charts Pareto Charts Histograms Scatter Plots, etc. Data Management Strategy – Ch. 14 “As Is” State to “Should Be” State Source: The Public Health Quality Improvement Handbook, R. Bialek, G. Duffy, J. Moran, Editors, Quality Press, © 2009, p.160

19
Large Issue, Cross Functional Problem, or Sensitive Situation
General Approach On How To Use The Advance Tools Of Quality Improvement Large Issue, Cross Functional Problem, or Sensitive Situation Brainstorming Affinity Diagram Explore Interrelationship DiGraph Prioritization Matrix Sort & Prioritize Monitor Understand & Baseline Radar Chart SWOT Analysis SMART Chart Develop Actions & Tasks Develop Project Plans Prioritize Actions & Tasks Tree Diagram Problem Prevention PERT Gantt Chart PDPC Control & Influence Plots Prioritization Matrix Know & Don’t Know Matrix Source: The Public Health Quality Improvement Handbook, R. Bialek, G. Duffy, J. Moran, Editors, Quality Press, © 2009, p.190 Figure 4

20
What Is Quality? Today the most progressive view of quality is that it is defined entirely by the customer or end user and is based upon that person's evaluation of his or her entire customer experience. The customer experience is the aggregate of all the Touch Points that customers have with the organization’s product and services, and is by definition a combination of these.

21
Deming Cycle – PDCA or PDSA
PDCA was made popular by Dr. Deming who is considered by many to be the father of modern quality control; however it was always referred to by him as the "Shewhart cycle."

22
Continuous Improvement
The continuous improvement phase of a process is how you make a change in direction. The change usually is because the process output is deteriorating or customer needs have changed 22

23
The ABC’s of PDCA, G. Gorenflo and J. Moran Plan
Check/ Study Identify and Prioritize Opportunities 7. Develop Improvement Theory 1. Reflect on the Analysis 2. Develop AIM Statement 8. Develop Action Plan 2. Document Problems, Observation, and Lessons learned 3. Describe the Current Process Do Implement the Improvement 4. Collect Data on Current Process Act 2. Collect and Document The data Adopt Standardize 5. Identify All Possible Causes Adapt Do 3. Document Problems, Observations, and Lessons Learned 6. Identify Potential Improvements Abandon Plan

24
Maintenance and Standardization
The Maintenance and Standardization phase of a process is how we hold the gains. If our process is producing the desired results we standardize what we are doing. 24

25
Integrated Cycle The SDCA and PDCA cycles are
separate but rather integrated. Once we have made a successful change we standardize and hold the gain. When the process is not performing correctly we go from SDCA to PDCA and once we have the process performing correctly we standardize again. This switching back and forth between SDCA and PDCA provides us with the opportunity to keep our process customer focused. 25

26
PDCA should be repeatedly implemented in spirals of increasing knowledge of the system that converge on the ultimate goal, each cycle closer than the previous. A P C D A P A P C D Rapid Cycle* Project Difficulty C D Hold the Gains Knowledge & Experience Rapid Cycle PDCA

27
The Basic Tools of QI Flow Chart Cause and Effect Diagrams
Pareto Chart Check Sheet Histogram Scatter Diagram Control Chart

28
Patient Flow Enter Building Greeter Possibly not Yes Clerical Screener
Okay to vaccinate? Triage RN Need medical attention? No Exit Leave Building EMT Is patient able to leave on own? EMT transports patient to medical facility

30
Cause and Effect Diagram
Test Location Client Don’t see benefit Inconvenient Don’t Want Test Too Public Fearful Poor HIV Testing Not Client Centered Not Respectful Not Offered Poor Experience Counseling Staff

31
NC Accreditation Collaborative

33
Grouped Frequency Distribution Table
Cell Boundary Absolute Cumulative Frequency Cumulative Relative Frequency Cell Mid-Point Relative Frequency Measured In Inches Grouped Absolute Frequency Tally .5075 .507 .506 I .505 II .504 IIII .503 IIIII IIIII .502 IIIII IIIII IIIII .501 IIIII IIIII IIIII III .500 IIIII IIIII IIIII IIIII I .499 IIIII IIIII IIII .498 IIIII IIII .497 IIII .496 I .495 I .494 .493 .506 .5045 .503 .5015 .500 .4985 .497 .4955 .494 .4925

34
Frequency Polygon & Histogram – Grouped Data
60 50 40 Absolute Frequency 30 20 10 0.41 0.494 0.497 0.500 0.503 0.506 0.509

35
Scatter Plot Obese Children BMI – kg/m² Age in Years 32 28 24 20 16 12
10 14 18 Age in Years 35

37
Run Chart x x x x x Measurement Median Line x x x Time

38
Control Chart

39
AIM Problem Statements
Discrete Current State Time Bound Measureable Baseline Improvement Target Measures of the Target – know if we succeed

40
AIM Outcome Influence Capacity Measurement Process Control Internal
Discrete Measureable Time Bound Internal Operational Focus External Strategic

41
Some Tools To Help Create AIM Statements
Current and Future State Model AIM Work Sheet Force Field Diagram Force and Effect Diagram

42
What is the current state? Driving Forces: Future State:
Why is this important? What is it costing us time/dollars/staff/etc? What is the impact on our customer/clients? What is the impact on our division/agency? Driving Forces: Future State: What are the important aspects of the future state? What is driving us to this future state? What might be the consequences of not moving to the future state? What might change? What is the proposed timeline? Pathway Consequences Benefits

43
(what will it improve and for whom?)
AIM or Opportunity Statement An opportunity exists to improve the ________________________________________________________________________ (name process, or area to work on) beginning with ___________________________________________________________ (beginning boundary, starting point) and ending with __________________________________________________________. (ending boundary, finish point) This effort should improve _______________________________________________________________________ _____ __________________________________________________________________ (key characteristics of area the team is working on) for the _________________________________________________________________ ______________ _________________________________________________________. (customers, staff or those affected by the process under improvement) This process is important to work on now because ____ ___________________________________________________________________ (what will it improve and for whom?)
 beginning with ___________________________________________________________. (beginning boundary, starting point) and ending with __________________________________________________________. (ending boundary, finish point) This effort should improve. _______________________________________________________________________. _____. __________________________________________________________________. (key characteristics of area the team is working on) for the _________________________________________________________________. ______________. _________________________________________________________. (customers, staff or those affected by the process under improvement) This process is important to work on now because. ____. ___________________________________________________________________. (what will it improve and for whom )")
44
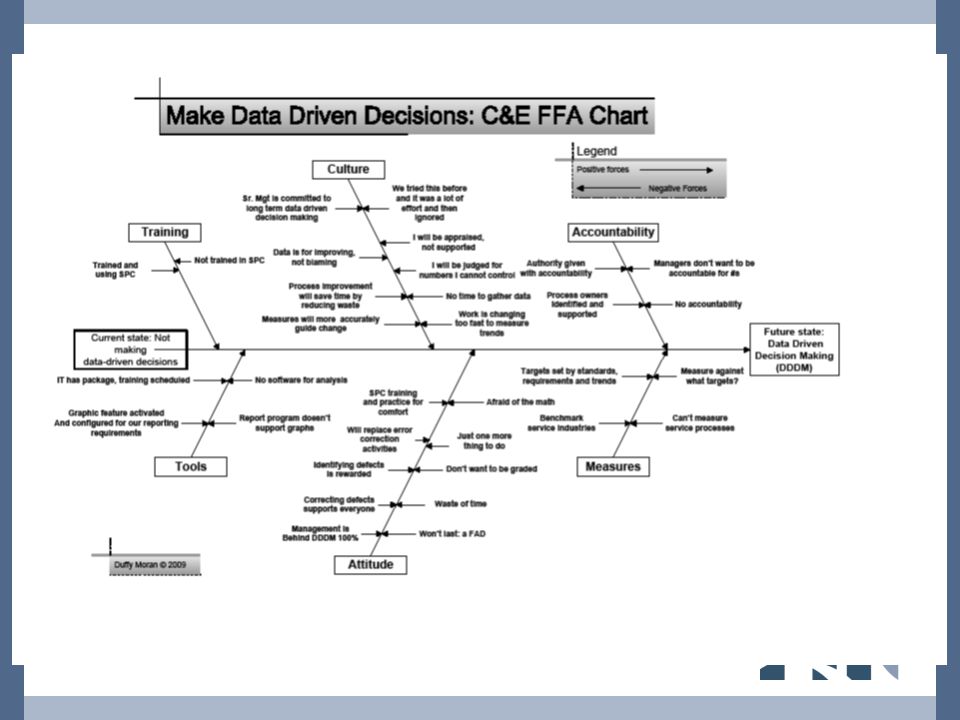
Desired State Current State Force Field Diagram - Basic
Positive Forces Negative Forces Desired State Current State

46
Force and Effect The Force & Effect (F&E) Diagram is designed to identify barriers to agreement among team members concerning an AIM Statement. The F&E Diagram combines a Force Field and Cause & Effect Diagram. Instead of having one box on the cause and effect diagram we use a double headed effect. The first effect (far left) is the current state and the second effect (far right) is the desired future state. In between are branches of main causes that maintain the status quo. Too often we focus only on the causes of the current state without looking at what pushes us to change
 is the current state and the second effect (far right) is the desired future state. In between are branches of main causes that maintain the status quo. Too often we focus only on the causes of the current state without looking at what pushes us to change.")
48
AIM Statement Example Determine if our client education and teaching is effective for positive pregnancy testers in identifying the importance of seeking early prenatal care. Goal is to have % of our patients will receive prenatal care appointments in 2-3 weeks of positive pregnancy tests from the current level of 65% and 100% of clients will be using Prenatal vitamins which is currently at 70%. This project will take three months to analyze and develop solutions to trial. The trial period will last three months and then we will analyze the results, determine where we are in achieving our goal , and either standardize the solution or make adjustments or refinements if required.

49
AIM Statement Example FOCUSING STATEMENT
Currently we are using 5 different methods to collect mosquitoes within the county. Each of the 5 inspectors/collectors is using a method that best fits their schedule training, and motivation. This difference may be causing an extreme disparity among the collectors in regard to number of mosquitoes collected. These differences can translate into a lack of data in the respective area. The lack of data could lead to a use or misuse of control measures for mosquito control when there is an unidentified need. Lack of control may lead to mosquito borne disease outbreak and an unusually high number of nuisance complaints. The use or misuse of pesticides or other control measures costs the health department dollars. Also it could have a negative effect in regard to the public’s perception of use of pesticides. The chemicals we use are expensive and if a true measure of mosquito populations could be gained, overuse would be minimized.

50
AIM Statement Example AIM STATEMENT
In the coming mosquito seasons, our division needs to focus on ensuring that all the traps are set up in a manner to collect the maximum number of mosquitoes per trap site. The motivation behind this need is that some states and the EPA are moving to reduce the amounts of pesticide applied. These new laws require applicators to show with set evidence and numbers the need to apply pesticides. When these guidelines or codes go into effect, there will be harsh penalties for violations. Furthermore failure to move forward will possibly place the XYZ Health Department in violation. This is in addition to wasted money for over use of pesticides. The implementation of the program can be completed in the next (20XX) mosquito season.
 mosquito season.")
51
COMPONENTS OF ISSUE STATEMENT
AIM Statement Example COMPONENTS OF ISSUE STATEMENT The environmental division has the ability to complete the project with employees already in place. We have complete control over the element. The project can be completed if the players allow the changes to be made if they put them into practice. Influence must be used by management to ensure that all collectors are properly executing the project. There should not be any out side influences in effect. The only element out of our control is the laziness of the collector in ensuring that the trap is set and operating properly. We need to focus on 1. Knowledge of collector 2. Use of the same water in trap 3. Ensuring batteries last duration of trap cycle 4. Moving to a 1 night trap event 5. Keep the collector motivated 6. Who is your collection substitute?

52
Components of the Issue Statement
Outside Our Control & Influence Involve & Influence Element Control Implement For each element check which column(s) apply From this select the area(s) of focus, develop a ranking of the elements to focus on, and write the problem statement for the Quality Improvement project to be started.
 apply. From this select the area(s) of focus, develop a ranking of the elements to focus on, and write the problem statement for the Quality Improvement project to be started.")
53
Reduce Inconsistency Mosquito Trapping
Outside Our Control & Influence Involve & Influence Element Control Implement Education Within Within Within In Same water Within Within Need influence In Batteries Out Within Need influence In 1 night trapping Within Out Need influence In Motivation Out Out Need influence Outside For each element check which column(s) apply From this select the area(s) of focus, develop a ranking of the elements to focus on, and write the problem statement for the Quality Improvement project to be started.
 apply. From this select the area(s) of focus, develop a ranking of the elements to focus on, and write the problem statement for the Quality Improvement project to be started.")
54
LHD’s Work On Their Draft AIM Statements

55
Customer Centric Organizations

56
Who are recognized as top customer centric organizations?

57
Who are recognized as top customer centric organizations?
Marriott – extra mile for the customer Southwest Airlines – letter of apology Publix Market – 10 by 10 rule Nordstrom Others?

58
Who are recognized as bottom of the barrel customer centric organizations?

59
Dell Software Support Banks Cable Companies Credit Card Companies
Who are recognized as bottom of the barrel customer centric organizations? Dell Software Support Banks Cable Companies Credit Card Companies Cell phone Companies Others?

60
Understaffed call centers Hang Up on Customer Other reasons?
Who are recognized as bottom of the barrel customer centric organizations? Why? Misplaced paper work Unhelpful clerks Short tempered clerks Misleading ads Surprise fees Understaffed call centers Hang Up on Customer Other reasons?

61
Bose Shopping at our store should be enjoyable, exciting and designed for you.

62
L.L. Bean – Customer Delight
Unexpected service and attention More than the customer expected More than satisfying the customer Deliver the unexpected Deliver it with enthusiasm and sincerity Surprise the customer Create a memory

63
Next Door To L.L. Bean is J. L. Coombs - The Oldest Shoe
Company in the United States “If You Do Not Like My Shoes the Hell with you!”

64
Customer Touch Points When your customer (internal/external) comes in touch with your process what do they: See? (Initial reaction?) Feel? Sense? Hear? Experience?
 Feel Sense Hear Experience")
65
Understanding Your Customer
Need to obtain the Voice of Your Customer: Wants Needs Satisfiers Dis-satisfiers Future needs and wants

66
Levels of Customer Satisfaction
Satisfied Wows Wants Need not met Need is met Expected Dissatisfied The Kano Model 66

67
Voices VOP – Voice of the Process (VOP)
VOC – Voice of the Customer (VOC) VOG – Voice of the Organization (VOO) Voice of the Future (VOF) Need to balance them
 VOG – Voice of the Organization (VOO) Voice of the Future (VOF) Need to balance them.")
68
Who is Your Customer for Your Issue?
What are their/your wants and needs? What will satisfy them? What will satisfy You?? How can we align our needs?? Communication is the key

69
How To Obtain Customer Data
Survey and ask them Where to do the survey What to ask? Best time to do it How often to do it?

70
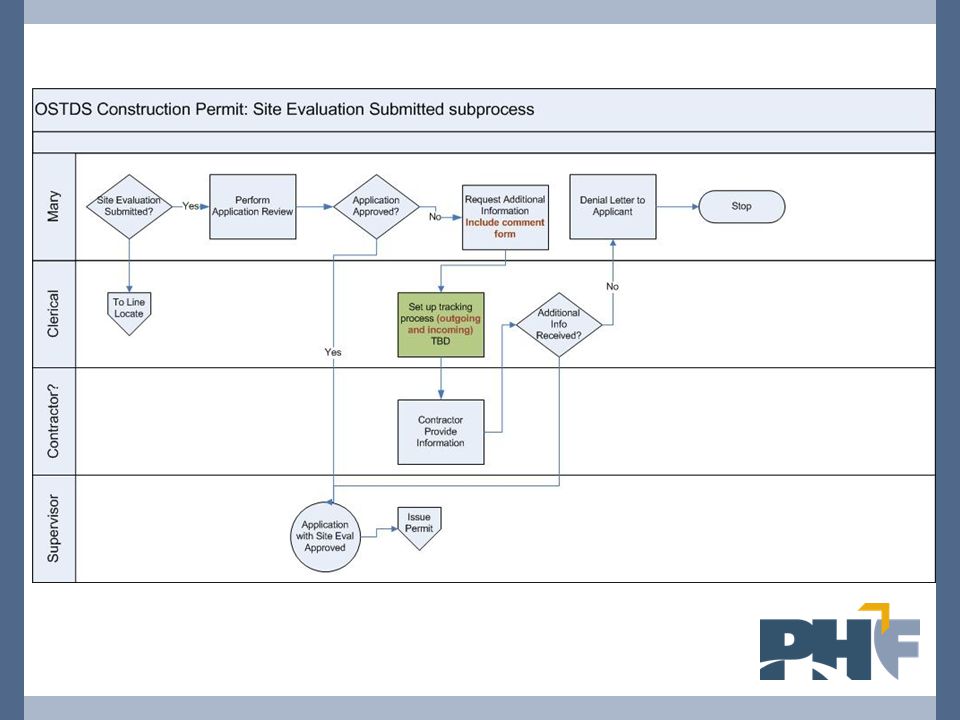
Flow Charting 70

71
“If you can't describe what you are doing as a process, you don't know what you're doing.”
W. Edwards Deming

72
W Edwards Deming ( ) "Draw a flowchart for whatever you are doing. Until you do, you do not fully understand what you are doing. You just have a job.“ "The first step in any organization is to draw a flow diagram to show how each component depends on others. Then everyone may understand what their job is. If people do not see the process, they cannot improve it."

73
SIPOC+CM What it is: SIPOC is a data collection form that is used before we start to construct a flow chart since it helps us to gather relevant information about the process. Assists in gathering information about Suppliers, Inputs, Process, Outputs, and Customer of the process. SIPOC is high level view of the “As Is” state of a process under investigation. The C stands for constraints (barriers) facing the system and the M for the measures to be used.
 facing the system and the M for the measures to be used.")
74
SIPOC+CM When to use it:
When first starting to investigate a process and a team needs to understand the basics that make up the process. When a team needs a way to get the collective knowledge of the team members about a process recorded in an easy to view format. When we need to make a concise communication to others about a process and the parameters that it encompasses.

75
SIPOC+CM How to use it: On a piece of flip chart paper draw the SIPOC+CM diagram with seven blocks indicating the components of SIPOC+ CM. Clearly identify the process under study and define the process boundaries (start and end points) so that everyone involved understands the limits of the analysis. On the SIPOC+CM form identify the data available for each of the following major categories: Suppliers – who or what (internal or external) provides the raw materials, information, or technology to the process Inputs – what are the material or information specifications that are needed by the process Process – a highly level flow chart of the key 5 to 7 core activities that comprise the process. This is a 30,000 foot view of the process. The detail steps will be developed in the flow chart. Outputs – what the process produces as products, services, or technology Customers – who are the main users of the process’s output + C –constraints facing the system or process + M – measures being used or to be used Review the form for completeness with relevant stakeholders, sponsors, and other interested parties.
 so that everyone involved understands the limits of the analysis. On the SIPOC+CM form identify the data available for each of the following major categories: Suppliers – who or what (internal or external) provides the raw materials, information, or technology to the process. Inputs – what are the material or information specifications that are needed by the process. Process – a highly level flow chart of the key 5 to 7 core activities that comprise the process. This is a 30,000 foot view of the process. The detail steps will be developed in the flow chart. Outputs – what the process produces as products, services, or technology. Customers – who are the main users of the process’s output. + C –constraints facing the system or process. + M – measures being used or to be used. Review the form for completeness with relevant stakeholders, sponsors, and other interested parties.")
76
High Level S I P O C+CM Collection Form
Constraints: Ends With: Begins With: Process/Activities: Measures Outputs: Inputs: Suppliers: Customers: 76

77
SIPOC+CM

78
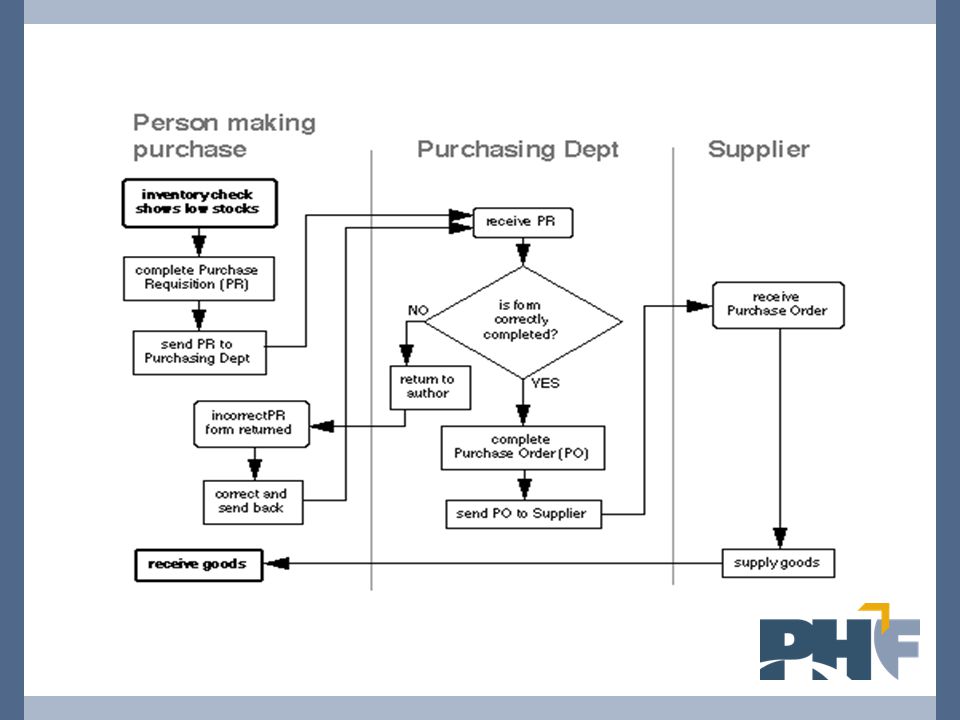
Flow Charting Flow charting is the first step we take in understanding a process Organized combination of shapes, lines, and text Flow charts provide a visual illustration, a picture of the steps the process undergoes to complete it's assigned task From this graphic picture we can see a process and the elements comprising it Shows how interactions occur Makes the invisible visible 78

79
Flow Chart Benefits Creates a common vision
Establishes the “AS IS” baseline – Current State Baseline to measure improvements Identifies wasteful steps – activities/waits Uncovers variations Shows where improvements could be made and potential impacts Training tool Current state accuracy is important since it will be the point from which all improvements will be measured. Show all the problems – don’t try to cover them up 79

80
Flow Chart People Benefits
People involved in constructing a flow chart begin to: Better understand the process Understand the process in the same terms Realize how the process and all the people involved, including them, fit into the overall process or business Identify areas for improving the process Become enthusiastic supporters to quality and process improvement 80

81
Olmsted County , MN – Performance Appraisal Process

83
Flow Charting Construction
Clearly define the process boundaries to be studied Define the first and last steps – start and end points Get the right people in the room Decide on the level of detail Complete the big picture first – macro view Fill in the details – micro view Gather information of how the process flows: Experience Observation Conversation Interviews Research Clearly define each step in the process Be accurate and honest Flowcharts don't work if they're not accurate or if the team is too far removed from the process itself. Team members should be true participants in the process and feel free to describe what really happens. A thorough flowchart should provide a clear view of how a process works. With a completed flowchart, you can: Identify time lags and non-value-adding steps. Identify responsibility for each step. Brainstorm for problems in the process. Determine major and minor inputs into the process with a cause & effect diagram. Choose the most likely trouble spots with the consensus builder. 83

84
Flow Charting Steps Use the simplest symbols possible – Post-Its
Make sure every loop has an escape There is usually only one output arrow out of a process box. Otherwise, it may require a decision diamond. Trial process flow – walk through people involved in the process to get their comments Make changes if necessary Identify time lags and non-value-adding steps. Flowcharts don't work if they're not accurate or if the team is too far removed from the process itself. Team members should be true participants in the process and feel free to describe what really happens. A thorough flowchart should provide a clear view of how a process works. With a completed flowchart, you can: Identify time lags and non-value-adding steps. Identify responsibility for each step. Brainstorm for problems in the process. Determine major and minor inputs into the process with a cause & effect diagram. Choose the most likely trouble spots with the consensus builder. 84

85
Flow Charting Moments Aha! Surprise Bafflement Duh! Embarrassment
Disappointment

86
Flow Chart Construction
Use a form of Post-It Notes – easier to rearrange Realize everyone is not doing it the same way – there will be disagreements It will take multiple passes to get to the “As Is” State 86

87
Flow Chart Symbols Flow Lines Manual Operation Start/End Bookends A
Connector Data Base Comment Collector Activity: Operation/Inspection Wait/Delay Decision Display Storage Input/ Output Data Transport Manual Input These symbols are in Microsoft Power Point Document Input Preparation Forms Output Unfamiliar/ Research 87

88
Constructing a Flow Chart
Asking questions is the key to flow charting a process. For this process: Who is the customer(s)? Who is the supplier(s) ? What is the first thing that happens? What is the next thing that happens? Where does the input(s) to the process come from? How does the input(s) get to the process? Where does the output(s) of this operation go? Is their anything else that must be done at this point? What is the baseline measurement of this process? The more questions everyone asks the better. 88
 Who is the supplier(s) What is the first thing that happens What is the next thing that happens Where does the input(s) to the process come from How does the input(s) get to the process Where does the output(s) of this operation go Is their anything else that must be done at this point What is the baseline measurement of this process The more questions everyone asks the better. 88.")
89
Adding Time Lines Could Be Flow Chart Should Be Flow Chart
As Is Flow Chart Time Time

90
Analyzing A Flow Chart Examine each: Activity symbol – value/cost?
Decision point – necessary/redundant? Choke Points – bottlenecks? Rework loop – time/cost? Handoff – is it seamless? Document or data point – useful? Wait or delay symbol – why?/reduce/eliminate Transport Symbol – time/cost/location? Data Input Symbol – right format/timely? Document/Form Symbol – needed/cost/value? Unnecessary Tasks-usually paperwork or approval Duplication-identical activities occurring at different places in the process flow Disconnects- process activities that are missing making the rest perform poorly 90

91
Voice of the Process - VOP
Flow Charting Basic Flow Customer - VOC Internal External Data Voice of the Process - VOP

92
Flow Chart Summary Matrix
PHF E-News, March 2, 2010, Actual Proposed Flow Chart Step Number Type of Step Delta +/- ∑ ∑ P D P T W P D S Touch Point (√) Cost FTEs/Person Hrs. Supplies Required Equipment Required Space Required Time Cost of Quality Partnerships Needed Etc. Value added Type of Step: P – process, D – decision, T – transport, W – wait, S – storage Delta = Proposed – Actual – the more negative the subtraction the better – more savings
 Cost. FTEs/Person Hrs. Supplies Required. Equipment Required. Space Required. Time. Cost of Quality. Partnerships Needed. Etc. Value added. Type of Step: P – process, D – decision, T – transport, W – wait, S – storage. Delta = Proposed – Actual – the more negative the subtraction the better – more savings.")
93
Flow Charting Exercise

94
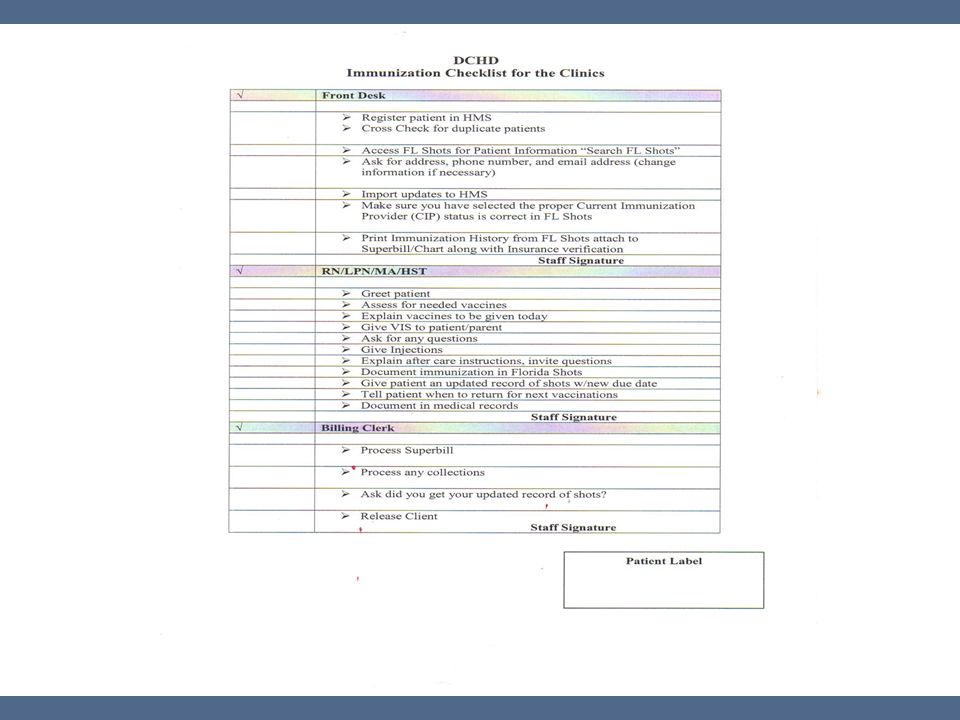
Lean Check List

95
LSS 5S is a visual method of setting the workplace in order. It is a system for workplace organization and standardization. The five steps that go into this technique: Seiri – sort – essential items Seiton – set in order – promote work flow Seison – shine – clean workplace Seiketsu – standardize - consistency shitsuke)- sustain – hold the gains
- sustain – hold the gains.")
96
Definition of 8 Types of Waste:
Description Public Health Example Overproduction Items being produced in excess quantity and products being made before the customer needs them Insurance filing or immunization record opened before all required information is received Waiting Periods of inactivity in a downstream process that occurs because an upstream activity does not produce or deliver on time. Paperwork waiting for management signature or review Unnecessary Motion Extra steps taken by employees and equipment to accommodate inefficient process layouts. Immunology testing equipment stored in cabinets far from specialist work area. Transportation Handling Unnecessary movement of materials or double handling Department vehicles stored in central facility, requiring constant movement of vehicles to and from other high traffic locations Over-processing Spending more time than necessary to produce the product or service Combining client survey instruments into one form rather than develop specific instruments for each program Unnecessary Inventory Any excess inventory that is not directly required for the current client’s order Over estimating vaccination support materials requiring additional locked storage cages, inventory counting and reconciliation Defects Errors produced during a service transaction or while developing a product. Ineffective scripts for initial intake applications. Unclear directions for filling out required forms Duplication Having to re-enter data or repeat details on forms. Poorly designed client intake computer screens or services checklists

97
Measurement Part 1

98
“Not everything that can be counted counts, and not everything that counts can be counted.” Albert Einstein

99
"In God we trust, all others bring data.“ -W. Edwards Deming

100
Why Measure? You can't manage what you don't measure. It is an old management adage that is accurate today. Unless you measure something you don't know if it is getting better or worse. You can't manage for improvement if you don't measure to see what is getting better and what isn't.

101
Definitions . Measure: The verb means "to ascertain the
measurements of“ Measurement: The figure, extent, or amount obtained by measuring“ Metric: "A standard of measurement“ Benchmark: "A standard by which others may be measured or compared"

102
Attributes of Measures
Aligned to the strategy of the organization Accuracy of Input - answers critical questions Timeliness of input Quality/use ability of output Accuracy of output Readily available Energizes user into action Manage what you measure Graphically displayed - show it in a simple usable format

103
Ask how can we measure that when developing the AIM Statement?
Measurement Measurement is critical to performance improvement and is the most difficult part of the process Start thinking of Measurement at the very beginning of the process. Ask how can we measure that when developing the AIM Statement?

104
Develop an improvement theory.
An improvement theory is a statement that articulates the effect that you expect the improvement to have on the problem. Writing an improvement theory crystallizes what you expect to achieve as a result of your intervention, and documents the connection between the improvement you plan to test and the measurable improvement objective.

105
Test Methodology Test method is a definitive procedure that produces a test result. A test can be considered as technical operation that consists of determination of one or more characteristics of a given product, process or service according to a specified procedure. The test result can be: qualitative (yes/no) quantitative (a measured value) personal observation output of a precision measuring instrument.
 quantitative (a measured value) personal observation. output of a precision measuring instrument.")
106
Sampling and Surveying Tips and Techniques

107
The Public Health Quality Improvement Handbook, R. Bialek, G. Duffy, J
The Public Health Quality Improvement Handbook, R. Bialek, G. Duffy, J. Moran, Quality Press, 2009, p. 147

108
What is the purpose of sampling?
To draw conclusions about populations from samples. To help us determine a population's characteristics by directly observing only a portion or sample of the population using statistics We obtain a sample rather than a complete enumeration (a census ) of the population for many reasons: Economy Timeliness Inaccessibility of some of the population Destructiveness of the observation
 of the population for many reasons: Economy. Timeliness. Inaccessibility of some of the population. Destructiveness of the observation.")
109
Target Population The researcher must clearly define the target population. There are no strict rules to follow, and the researcher must rely on logic and judgment. The population is defined in keeping with the objectives of the study

110
Problem Definition In sampling, this includes defining the population from which our sample is drawn. A population can be defined as including all people or items with the characteristic one wishes to understand. Because there is very rarely enough time or money to gather information from everyone or everything in a population, the goal becomes finding a representative sample (or subset) of that population.
 of that population.")
111
Sampling Frame It has the property that we can identify every single element and include any in our sample The sampling frame must be representative of the population

112
Sampling Frame Problems
1. Missing elements: Some members of the population are not included in the frame. 2. Foreign elements: The non-members of the population are included in the frame. 3. Duplicate entries: A member of the population is surveyed more than once. 4. Groups or clusters: The frame lists clusters instead of individuals.

113
Sampling Methods Classified as either Probability or Non-Probability.
Probability samples, each member of the population has a known non-zero probability of being selected. The advantage of probability sampling is that sampling error can be calculated. Sampling error is the degree to which a sample might differ from the population. Non-probability sampling, members are selected from the population in some nonrandom manner. In non-probability sampling, the degree to which the sample differs from the population remains unknown.

114
Types of Sampling Systematic Sampling Stratified Sampling
Convenience Sampling Judgment Sampling Snowball Sampling

115
Non-sampling errors are caused by the mistakes in data processing:
Overcoverage: Inclusion of data from outside of the population. Undercoverage: Sampling frame does not include elements in the population. Measurement error: The respondent misunderstand the question. Processing error: Mistakes in data coding. Non-response

116
Risks Type I risk, or alpha risk is the "reasonable doubt." It is the chance of wrongly rejecting the null hypothesis when it is true. In acceptance sampling, it is the producer's risk, or risk of wrongly rejecting a lot that meets requirements. The Type II risk or beta risk is the chance of accepting the null hypothesis when it is false. The "consumer's risk" is the Type II risk for an acceptance sampling plan. It is the chance of passing a lot that does not meet the requirements. Type I risk – convict an innocent defendant Type II risk – acquit a guilty defendant.

117
Errors Statistical Decision Null Hypothesis is True Null Hypothesis is
False Reject the Null Hypothesis Type 1 Error Correct Convict an Innocent Person Accept the Null Hypothesis Correct Type 2 Error Acquit a Guilty Person Null Hypothesis – person is innocent

118
Sample Size Determinants
Accuracy/Confidence – alpha/beta risk Precise – understand variation Difference trying to measure

119
Sample Size – Rules of Thumb
Trial and Error – n > 3 – 80% confidence CLT – n > 30 Reliability – n = % confident Shewhart - n >100 – 4 sets of 25 to determine process stability

120
How much data to collect?
n = 30 (Good or Bad?) A complete cycle of the process? Time based – when it is done? Representative?
 A complete cycle of the process Time based – when it is done Representative")
121
Sample Size

122
Cause and Effect Diagrams
122

123
Cause and Effect Diagrams
Moving from Treating Symptoms To Treating Causes

124
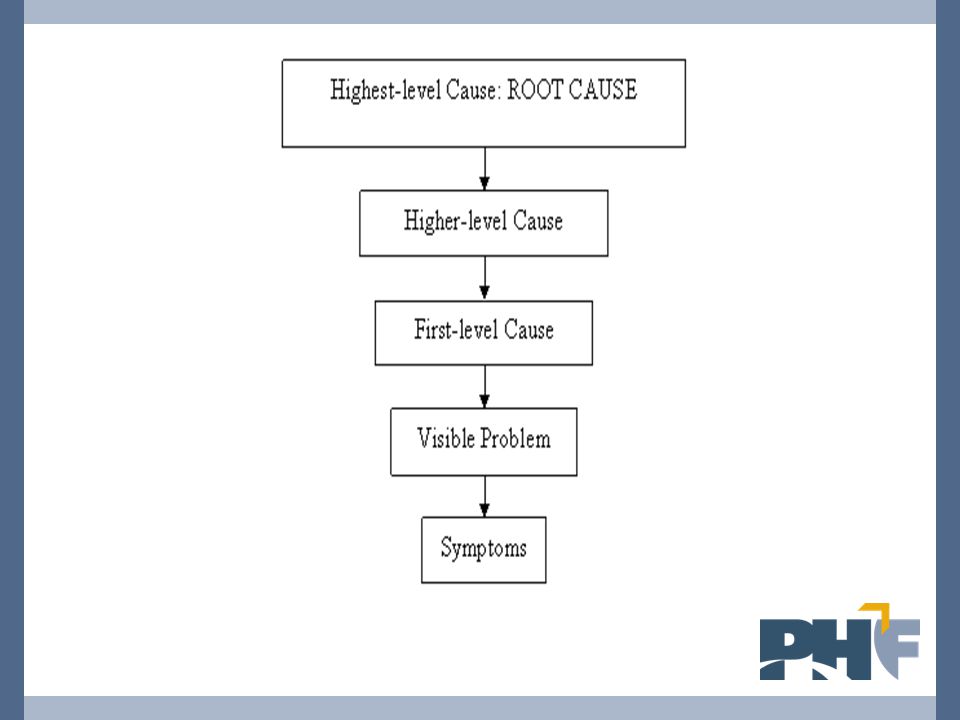
Problem Solving – What we usually see is the tip of iceberg – “The Symptom”
The Root Causes Invisible Hidden 124

125
Problem Solving When confronted with a problem most people like to tackle the obvious symptom and fix it This often results in more problems Using a systematic approach to analysis the problem and find the root cause is more efficient and effective Symptom – sign or indication Cause – whatever makes something happen

126
Cause and Effect Diagrams - Construction
Write the issue as a problem statement on the right hand side of the page and draw a box around it with an arrow running to it. This issue is now the effect Effect

127
Cause and Effect Diagrams - Construction
Generate ideas as to what are the main causes of the effect Label these as the main branch headers Organizes group knowledge about causes of a problem and display the information graphically Header Header Effect Header Header

128
Cause and Effect Diagrams - Construction
Typical Main Header are: 4 M’s – Manpower, Materials, Methods, Machinery People Policies Materials Equipment Life style Environment Etc.

129
Cause and Effect Diagrams - Construction
For each main cause category brainstorm ideas as to what are the related sub-causes that might effect our issue Use the 5 Why techniques when a cause is identified Keep repeating the question until no other causes can be identified List the sub-cause using arrows Header Header why why why Effect why Header Header

130
Selecting Items to Investigate
When the Cause and Effect Diagram is finished it is time to decide what few areas should be focused on to develop solutions to solve the effect. Some are obvious – low hanging fruit Some require some research using the other QI tools such as: Pareto Diagrams Run Charts Surveys Histograms Etc.

131
Pre Natal Practices Early Feeding Practices Life Style Environment
Excess Maternal Weight Gain Decreased Breast Feeding Bottle Pacifier TV Viewing No Time For Food Prep Juices Less Fruits and Veg. Sodas/Snacks Over Weight Newborn No Outdoor Play Less Income Unsafe Maternal Choices Obese Children Built Environment For Strollers Not Toddling Unhealthy Food Choices Genes Curriculum Few Community Recreational Areas or Programs Syndromes Less Indoor Mobility No Sidewalks TV Pacifier Unsafe Housing Over Weight Pre School Less Vigorous Exercise At Home At School Environment Policies Genetics

132
5 Why’s Technique Problem (Effect) Why? Why? Why? Why? Why?
 Why Why Why Why Why")
135
Root Cause Analysis Rating Form
Impact on the Problem Potential Root Cause Improved Customer Satisfaction Improved Quality Reduced Costs Others Total Score Ranking Impact Scoring Scale: Low = 1, Medium = 3, High = 5

136
Cause and Effect Exercise

137
Cause and Effect Diagram
Why Employees Are Late For Work?

139
Solution and Effect Diagram
Similar to the Cause and Effect Diagram Identifies changes and recommendations Effect is now made into a positive statement: “What are the causes of Childhood Obesity” How to prevent Childhood Obesity”

140
Solution and Effect Diagrams - Construction
Place the Solution and Effect Diagram opposite the Cause and Effect Diagram Write the issue as a positive statement on the left hand side of the page and draw a box around it with an arrow running to it. This issue is now the effect Positive Effect

141
Solution and Effect Diagrams - Construction
Generate ideas as to what are the main Solutions of the effect Label these as the main branch headers Solution Solution Effect Solution Solution

142
Solution and Effect Diagrams - Construction
For each main Solution category brainstorm ideas as to what are the related sub-solutions that might effect our issue Use the 5 How techniques when a solution is identified Keep repeating the question until no other solutions can be identified List the sub-solutions using arrows Solution Solution Effect Solution Solution

143
Solution and Effect Diagram
Cause Solution Why? How? Why? How? Why? How? How? Why? Effect Why? How? Effect Solution Solution Cause Cause C = Cause Category S = Solution Category

144
Pre Natal Practices Early Feeding Practices Life Style Environment
Less Obese Children More Mobility Community Recreational Areas Less TV Sidewalks Safe Housing Environment Polices Genetics

145
5 How’s Technique Solution (Effect) How? How? How? How? How?
 How How How How How")
146
5 How’s of More Vigorous Exercise
Less TV and Video Games How? More Community Sponsored Recreation Programs How? More Family Recreational Activities How? Safe Play Areas How? Additional Resources How? 146

147
Selecting Items to Investigate
When the Solution and Effect Diagram is finished it is time to decide what few areas should be focused on to develop solutions to solve the effect.

148
Root Cause Analysis Solution Impact Analysis
Potential Solutions Corrective Action Type Verification Method Cost To Fix Benefit Of Fix Cost Benefit Ratio Selected? Y/N Corrective Action Type: Immediate but Interim – II, Short-term Temporary - ST, Permanent – Short Term – PST, and Permanent – Long Term - PLT

149
Solution and Effect Diagrams
Cautions: Do not jump to quickly to Solution and Effect Use after a detailed analysis of “Cause” If you are still listing Causes – not enough detail on the Cause and Effect Diagram Ask if the proposed solution(s) will improve the effect or cause more problems
 will improve the effect or cause more problems.")
150
Solution and Effect Diagram Exercise

151
Solution and Effect Diagram
How To Make Employees On Time For Work?

152
What Can Go Wrong? - PDPC Ask the killer question
Do not be surprised by the amount of problems a group can generate about a solution they have devised People thrive on failure Everyone knows something will go wrong – it is not “If” but “When” Remember the National Lampoon’s Griswold vacation to Walley World?

153
What Can Go Wrong? If we wanted this to fail, how could we accomplish that? What assumptions are we making that could turn out to be wrong? What has been our experience in similar situations in the past? Does this depend on actions, conditions or events? Are these controllable or uncontrollable? Decide how practical each countermeasure is by using criteria such as: Cost time required ease of implementation effectiveness

154
Check How will we know if we are successful?
What are the indicators of success?

155
The ABC’s of PDCA, G. Gorenflo and J. Moran Plan
Check/ Study Identify and Prioritize Opportunities 7. Develop Improvement Theory 1. Reflect on the Analysis 2. Develop AIM Statement 8. Develop Action Plan 2. Document Problems, Observation, and Lessons learned 3. Describe the Current Process Do Implement the Improvement 4. Collect Data on Current Process Act 2. Collect and Document The data Adopt Standardize 5. Identify All Possible Causes Adapt Do 3. Document Problems, Observations, and Lessons Learned 6. Identify Potential Improvements Abandon Plan

156
Check/Study/Observe This phase involves analyzing the effect of an intervention. Compare the new data to the baseline data to determine whether an improvement was achieved. Whether the measures in the aim statement were met.

157
Check/Study/Observe 1. Reflect on the analysis, and consider any additional information that emerged as well. Compare the results of your test against the measurable objective 2. Document lessons learned, knowledge gained, and any surprising results that emerged. Source: The ABCs of PDCA, Grace Gorenflo and John W. Moran,

158
Check/Study/Observe Tools that can assist : Pareto charts Histograms Run charts Scatter plots Control charts Radar charts.

159
Measurement Part 2

160
Data Decision Maker 40% Data 60% Information
Data by itself has no value – it just shows information. Information requires interpretation for it to have value. Decision makers add value through interpretation Decision Maker 40% Data 60% Information

161
Types of Data Quantitative Can be discrete or continuous Discrete Variables - counted or enumerated - # pills in a bottle Continuous – measured – length, width, weight, pressure, etc.

162
Types of Data Qualitative Always discrete Attribute data
Placed into two or more attribute categories Yes/No Infected/Not Infected Pass/Fail Positive/Negative Good/Bad Male/Female Red/Yellow/Green Dead/Alive

164
“Whenever there is fear, you will get wrong figures.”
Data Management “Whenever there is fear, you will get wrong figures.” W. Edwards Deming

165
Data Management Strategy
Collect Raw Data Collecting Translating – use data tables Consolidate Interpret Summarizing – use descriptive statistics Communicate Framing - use charts/graphs

166
Data Collection Questions
Before collecting data we must answer the following questions: What is the purpose for collecting this data? What type of data is going to be collected? Where will the data be collected? Who will collect the data? When will they collect the data? How will they be trained to collect the data? What will we do with it after we collect the data? How will we summarize and present the data?

167
Getting Good Data Understand the process being studied – walk it Make the collection simple Define where the data will be collected – collection points Use checksheets and checklists to help Minimize the “other” category – by good classifications - too often the largest bar on a chart Establish collection rules – sampling

168
Getting Poor Data Lack of training on what to do Unclear directions Ambiguous terminology – need yearly data – fiscal or calendar year? Different units of measures – 9/23/99 – Mars spacecraft was a $125m lost because it missed entry by 100km – NASA used the metric system and Lockheed used the English units – inches versus meters Mathematical errors – rounding, calculation, order of calculations, etc.

169
There are three kinds of lies: Lies, Damned Lies, and Statistics

170
Descriptive Statistics
The majority of our data collection will be done through sampling Populations versus Samples Population parameters: μ and σ Sample statistics: Х and s

171
Descriptive Statistics
Measures of Central Tendency: Mean – arithmetic average of the items sampled Median – middle value in the sample Mode – the one that most frequently occurs

172
Descriptive Statistics
These statistical measures help us to understand how the data is distributed: Symmetrical – normal – bell shaped Skewed – left or right Rectangular Always plot the data and confirm the shape of the data

173
Descriptive Statistics
“A central theme of the statistical approach to data analysis is this: Variability always exists. No experiment can be repeated exactly. Variability can never be totally eliminated.” “Statistics An Introduction”, A Rickmers and H. Todd, Mc Graw-Hill, 1967, page v

174
Descriptive Statistics – Variation
Variation is everywhere It is found in the output of any process of manufacturing, service, or administrative But variation is not all bad since it always displays a pattern or a distribution of itself These patterns or distributions can tell us a great deal about the process itself and the causes of problems found in the process Histograms help us identify and interpret these patterns

175
Descriptive Statistics
Measures of Variability: Dispersion Range – Highest Value – Lowest Value Variance – how much spread in our sample data - scatter Standard Deviation – dispersion of a random variable about its mean

176
Descriptive Statistics
The measures of central tendency and the measures of variability when compared to historical data can help us determine if: The center of the process has shifted The variability of the process has increased Combination of both of the above

177
Descriptive Statistics
When constructing data tables and graphs: Do not throw any data away Know what type of data you are dealing with – qualitative or quantitative Know if the data is discrete or continuous Label everything appropriately Keep it clear and simple

178
TAPP/PDCA Integration*
Plan Target Monitor Gap Do Process Act Monitor Check Performance Gap = Performance versus Target Act only when Performance is below Target Small gaps – just fix it Larger gaps need a PDCA Cycle * Reference Article

179
Check How will we know if we are successful?
What are the indicators of success? Develop a few Indicators of project success

180
Act Project Planning

181
Transitional Time Line
Low High Resources committed to change Ongoing Activities New Activities Start Time

182
Transitional Time Line
Low High Resources committed to change Ongoing Activities New Activities Start Time

183
Gantt Chart 183

184
184

185
History The first Gantt Chart was developed by Karol Adamiecki, who called it a Harmonogram Because Adamiecki did not publish his chart until 1931, this famous chart bears Henry Gantt's name (1861–1919) designed his chart in 1910 Wikipedia, the free encyclopedia
 designed his chart in Wikipedia, the free encyclopedia.")
187
Gantt Chart Henry L. Gantt – WWI
Franklin Arsenal 1910 Progress Chart Work planned and accomplished are shown in the same space Emphasizes work movement through time Deals with plans and progress Helps identify and eliminate obstacles The Gantt Chart – William Clark, The Ronald Press Co, NY 1922 187

188
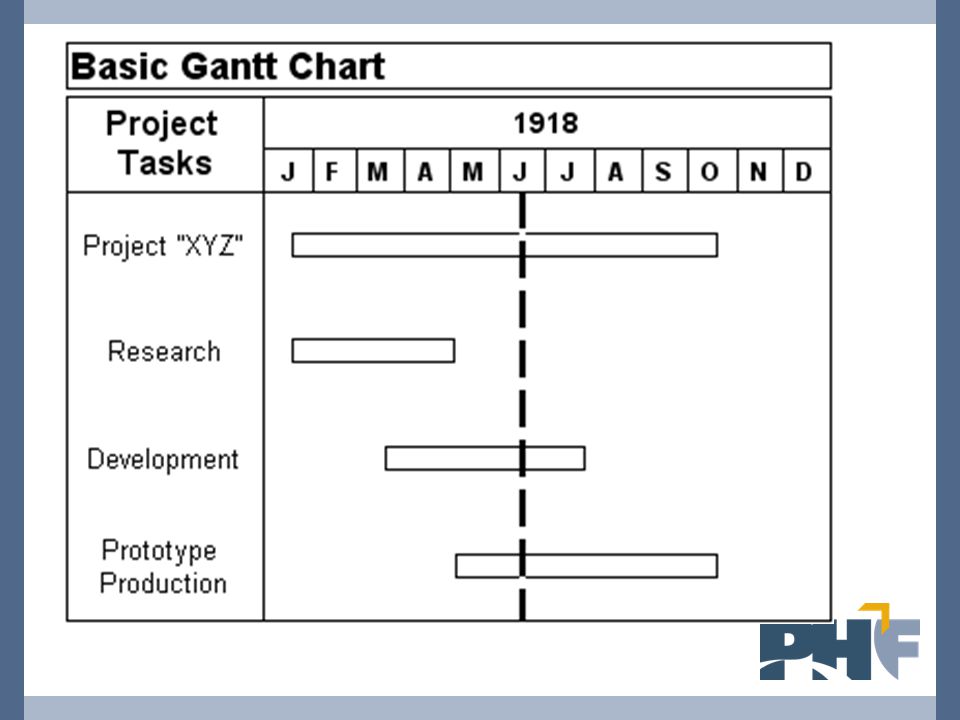
Gantt Charts A Gantt chart is a matrix diagram
The vertical axis lists all the tasks to be performed for a project Each row contains a single task identification The horizontal axis is headed by columns indicating estimated task duration in hours, days, weeks, months, etc. , skill level needed to perform the task, and the name of the person assigned to the task, followed by one column for each period in the project's duration. 188

191
Use Of Gantt Charts Establish order of tasks:
Sequential and Parallel Identify resources requirements Timing of resource needs Identify the critical path Monitor the project “On-Time” Schedule Alerts where remedial action is required

192
Traffic Light Gantt Chart
Task: City of XYZ HD 29-Feb 7-Mar 14-Mar 21-Mar 28-Mar Finalize assessment analysis X Gain consensus on priorities Identify comm. with elected off. Plan PHF consultant visit Set agenda and travel schedule City HD/PHF PI meeting On Schedule Watch Late or at Risk Use Excel to build it Helps make projections on potential progress highlights potential problems Very Visual 192

193
Act Solution works: Solution does not work: Standardize Train Measure
Continue to improve Solution does not work: Regroup New team New AIM

194
Communication Plan Decide who/what/where/when of the Communication Plan Describe the end “game” – begin with the end in mind Make it flow – easy to understand and digest Front load – important points first – get their interest Stress the benefits to the listener – WIIFM Ask for commitment – will you support the effort? If not – why?

195
Documenting The Impact Of QI

196
Documenting The Impact Of QI
How many times have you reached the end of a quality improvement project only to be unsure of what has actually been accomplished? It is not unusual to get so caught up in the solving of the problem that we forget to accurately document what we did, when we did it, and what it accomplished.

197
Documenting The Impact Of QI
A quality improvement team moves quickly on its quest to gather data and solve problems but can easily delay recording what the interventions actually accomplished. It is difficult to recall or recreate history since people involved in the project usually have sketchy and conflicting memories of what was done, when it was done and the associated impact.

198
Documenting The Impact Of QI
Start as soon as you have developed the AIM statement. Develop a process by which you can document what quality improvements take place” What they were? When they where implemented? What change resulted? How much was the change? Other questions?

199
Documenting The Impact Of QI
It is easier to document in real time then to recreate history. Besides being a more accurate description of what has happened it also gives the quality improvement team a vehicle to start making predictions as to what

200
Intervention and Impact Form AIM Statement Description:
1. 2. 3. 4. 5. 6. 7. 8. Intervention Number Date What Was The Change? How Did It Impact The AIM? How Did Your Thinking Change? How Did It Impact Your Procedures? How Did It Impact Your Customer? How Do You Know? Measures

201
Documenting Unintended Consequences
Unintended Consequences may happen. Being prepared for Unintended Consequences makes the process of dealing with them easier and quicker.

202
Unintended Consequences
Often “Unintended Consequences” arise from some of the interventions. Many could not be foreseen since they are a result of the interaction of the intervention with the process where it is being implemented. Unintended consequences happen frequently in quality improvement projects and these need to be tracked along with the interventions. Some of these unintended consequences may result in the quality improvement team developing a sub-AIM statement which will also have to be tracked and monitored.

203
The following columns can be added to the Intervention and Impact Form when needed to track the impact of unintended consequences. 9 10 11 12 13 14 15 Unintended Consequence Letter Unintended Consequence Description Date It Happened Impact To Aim Statement Need a Sub AIM Statement? Impact to Customer Modifications Made Intervention and Impact Form when needed to track the impact of unintended consequences.

204
Stages Of Team Development
Adjourning

205
Stages Of Team Development
Each stage has two components that compete with each other: Task Focus Team Behavior Applications and Tools for Creating and Sustaining Healthy Teams, Public Health Foundation, April 2011 Tools_for_Creating_and_Sustaining_Healthy_Teams.aspx

206
Stages Of Team Development
Each stage has two components that compete with each other: Task Focus Team Behavior Applications and Tools for Creating and Sustaining Healthy Teams, Public Health Foundation, April 2011 Tools_for_Creating_and_Sustaining_Healthy_Teams.aspx

207
Top Ten Reasons Teams Fail
AIM Statement Team Charter Team Members Problem Solving Process Rapid Cycle Team Maturity Base Line Data Training Root Cause Analysis (RCA) Pilot Testing
 Pilot Testing.")
208
Train The Trainer Overview
Assignments Project expectations Next session

209
Train The Trainer Overview
Assignment for Teams: Topic LHD Assigned Introduction to QI AIM statement (SMART) SIPOC-CM Force and Effect analysis Flowchart (Basic or Deployment) Flow Chart Summary Form Cause and Effect (RCA) /5 whys Forming, Storming, Norming, Performing, Adjourning
 SIPOC-CM. Force and Effect analysis. Flowchart (Basic or Deployment) Flow Chart Summary Form. Cause and Effect (RCA) /5 whys. Forming, Storming, Norming, Performing, Adjourning.")
210
Wrap Up Finish Post Test Next Steps? Planning Time Team Reports
Adjourn

Similar presentations


’s Introduction to Quality Improvement>")
 Professional Learning Communities (Self Audit) School Improvement Snapshot School Improvement.>")


>")


>")


