Download presentation
Presentation is loading. Please wait.

1
Overview of Thinking Maps®
Local District 1 Elementary Principals’ Meeting February 11, 2009 Water-skiing vs. deep sea diving with the maps

2
You have been introduced to Thinking Maps®
You can name the key points defining Thinking Maps® Page 1 Chapter 1 You can explain the similarities and differences between Graphic Organizers and Thinking Maps® You have been introduced to Thinking Maps® You can identify the thought process behind each Thinking Map and the Frame of Reference You can draw and define each map You have a beginning understanding of how to use the maps in a variety of curriculum areas

3
Use a Circle Map to define Thinking Maps.
Page 2 What are Thinking Maps and how are they different from Graphic Organizers? Use a Circle Map to define Thinking Maps.

4
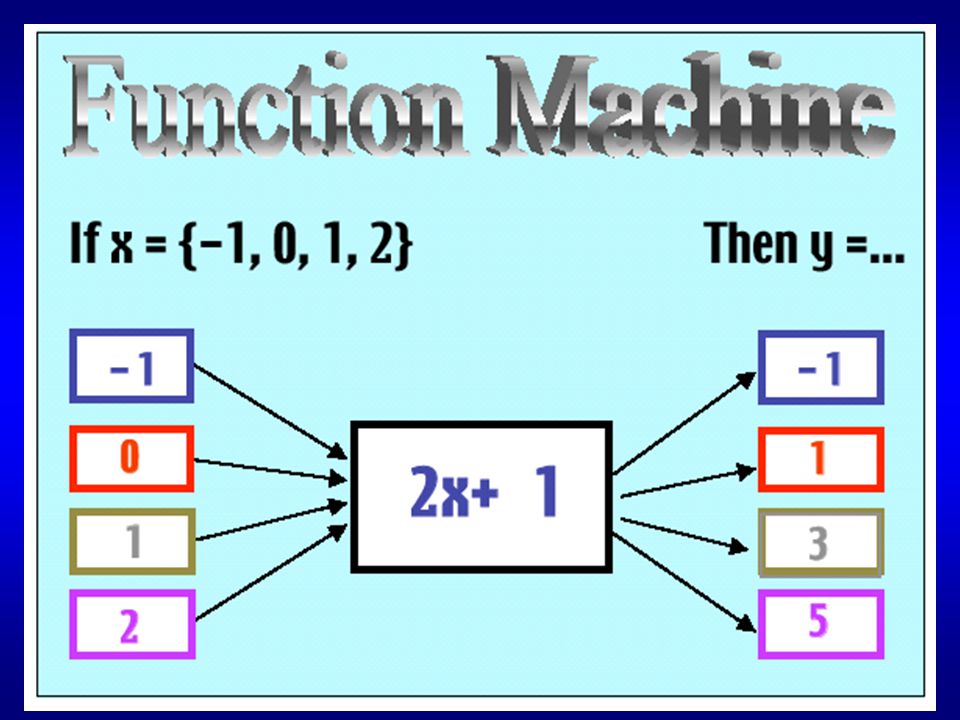
80% of all information that comes into our brain is VISUAL
Page 3 40% of all nerve fibers connected to the brain are linked to the retina Kids today are more visual than any preceeding group. Can’t even listen to music without seeing it. 36,000 visual messages per hour may be registered by the eyes. -Eric Jensen, Brain Based Learning

5
Knowledge is stored in two forms:
Page 3 DUAL CODING THEORY Knowledge is stored in two forms: Linguistic Form Nonlinguistic Form Research proves that the more we use both systems of representation, the better we are able to think and recall knowledge. This is how we use the maps differently from GO. We should be using the maps simultaneously while teaching. As I instruct, I also draw the information in a map to support my linguisitic form of instruction.

6
Dual coding tells us that we should use pictures K-12.

7
SCAFFOLDING K-12 use, no matter how many times the building changes, the scaffolding stays the same.

8
Page 7 The Thinking Maps give students a concrete visual pattern for an abstract cognitive skill.

9
Page 6 OVERVIEW K can use all eight, so can Hs. You just change the information in the map.

10
Page 10

11
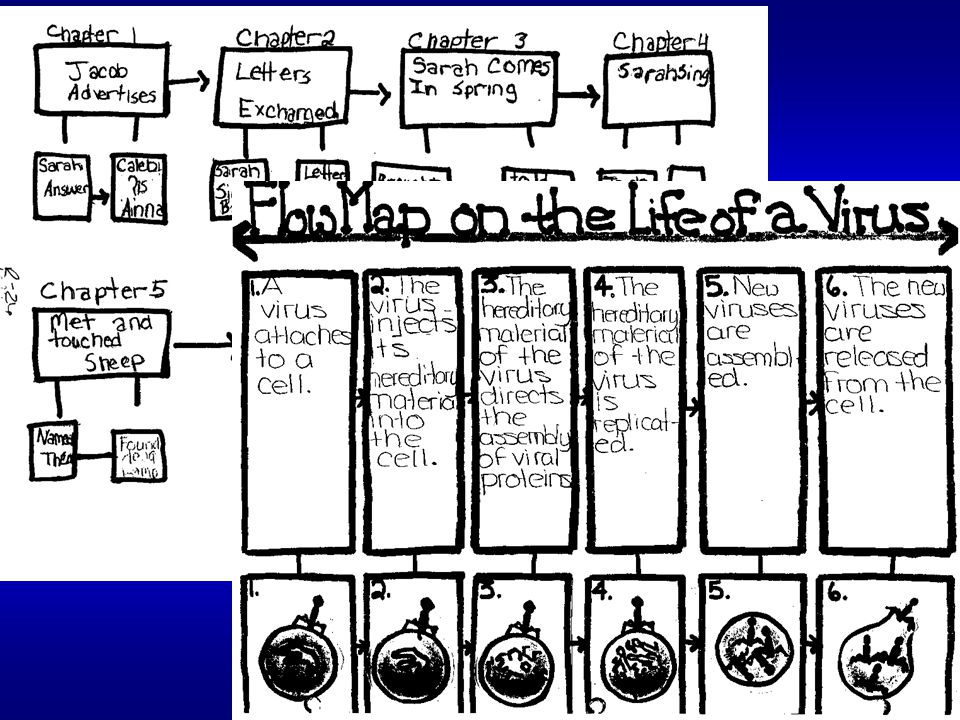
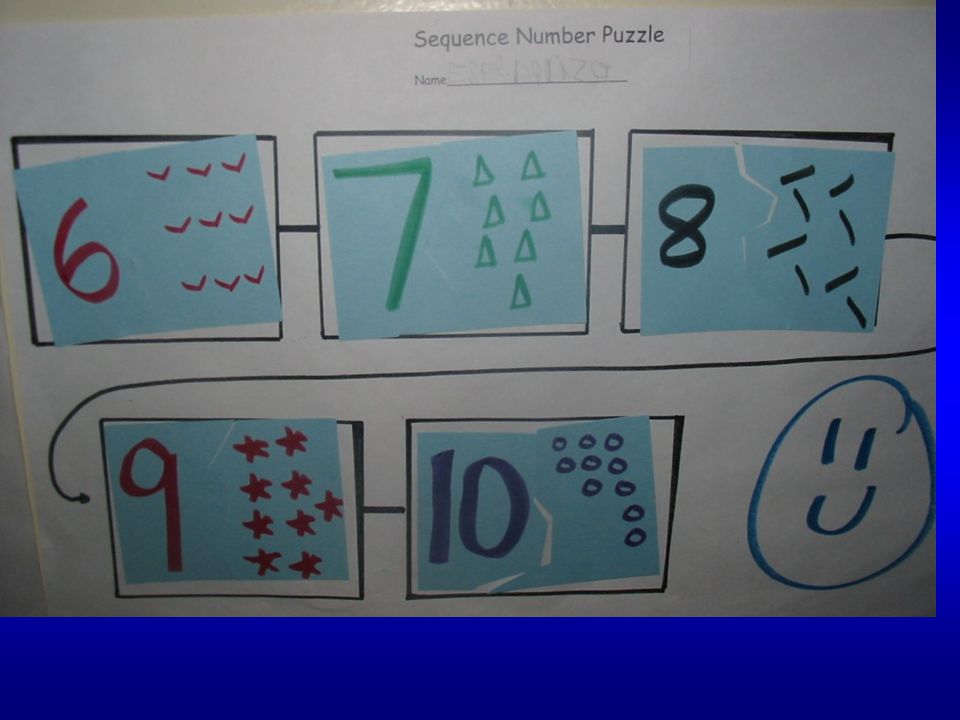
Thought process: Sequencing
Page 10 When do you use sequencing in: READING? WRITING? SCIENCE? MATH? SOCIAL STUDIES? THE ARTS? In every instance, you could use a FLOW MAP

13
WHICH MAP WOULD YOU USE? Reading
The Flow Map Identify and explain story elements, including plot summary. Retell a story.

14
WHICH MAP WOULD YOU USE? Science
Investigate, compare, and contrast the different life cycles of different living things. The Double Bubble Map

15
List the qualities of a leader
WHICH MAP WOULD YOU USE? Social Studies List the qualities of a leader The Bubble Map

16
WHICH MAP WOULD YOU USE? Math
Explain the relationship among fractions, decimals, and percents; translate among various representations of equal numbers The Bridge Map

17
Page 11

18
4TH Grade Special Education Class
Page 11 4TH Grade Special Education Class

19
Middle School Social Studies
LAUSD LD7 Middle School Social Studies

20
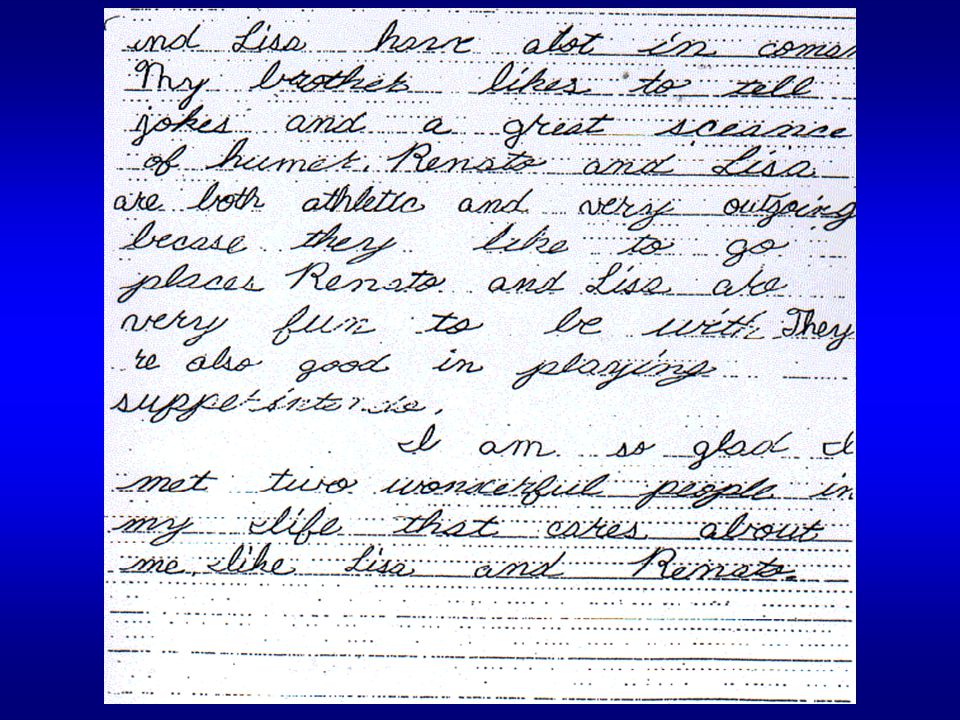
Page 11 High School English

21
Page 12

22
SET

23
TEACHER / STUDENT INPUT
Page 13 SET TEACHER / STUDENT INPUT Page 14 Start by showing brace map to show parts of US constitution: preamble, 7 articles of confederation, amendments. Amendments have parts 1-10 (bill of rights) plus frame it: rule w/o representation, one person too much power. Then show bridge.
 plus frame it: rule w/o representation, one person too much power. Then show bridge.")
24
PROCESSING Page 14 Frame: 8th graders in TX 1st amendment.
2nd. Right to bear arms 8th—punishment must fit the crime—very much a middle school thing

25
Page 15 EXTENSION POV person falsely accused of a crime.

26
Page 15 CLOSURE

27
So how are Thinking Maps different from graphic organizers?
Page 16 t

28
Page 17 Processing Activity Put away your notes. Then work with your group to define Thinking Maps. Use a Circle Map to collect your ideas. Include any notes that you remember about what they are and why they work as tools for thinking. Also include information about how Thinking Maps are different from graphic organizers. Now go to page 17 in binder to recreate the circle map. Don’t look at your notes. Recreate the circle map, including the original five descriptions I gave you but adding some of your own from the things we’ve talked about here.

29
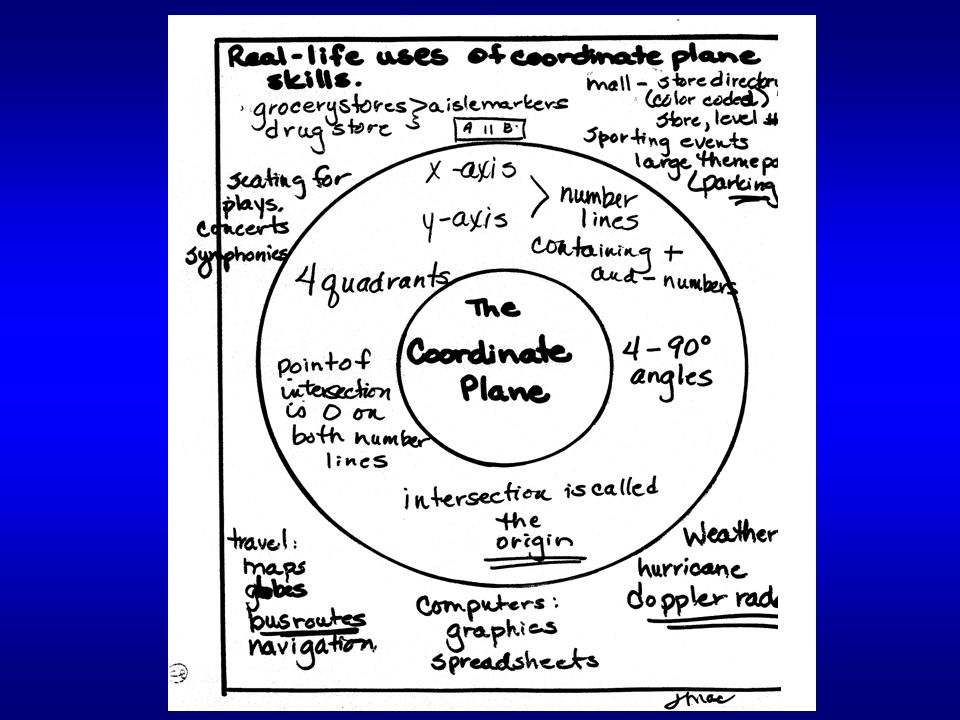
The Circle Map Defining in Context
An Overview of all 8 Thinking Maps Page 18 The Circle Map Defining in Context 29

32
0 + 6 6 1 + 5 5 + 1 4 + 2 3 + 3 2 + 4 6 + 0

37
Cadillac May still be alive ? scarves sideburns

38
A change in size, shape, or state of matter
Definition (in own words) Characteristics Abolitionist New materials are NOT formed A change in size, shape, or state of matter Same matter present before and after change Physical Change Breaking a glass Ice melting Cutting hair Examples
 Characteristics. Abolitionist. New materials are NOT formed. A change in size, shape, or state of matter. Same matter present before and after change. Physical Change. Breaking a glass. Ice melting. Cutting hair. Examples.")
44
An Overview of all 8 Thinking Maps
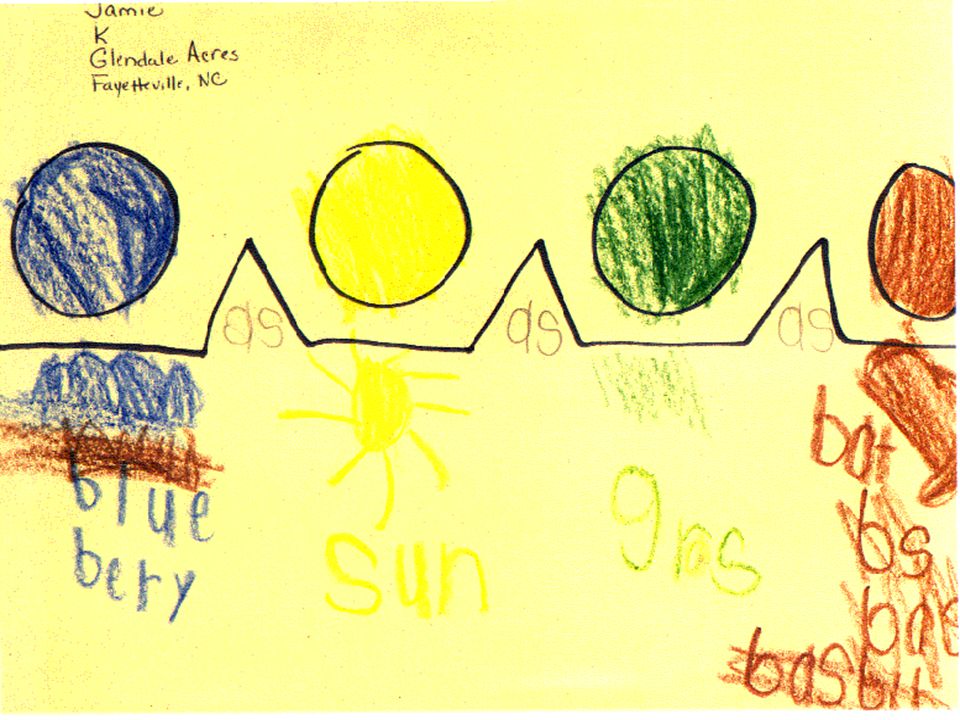
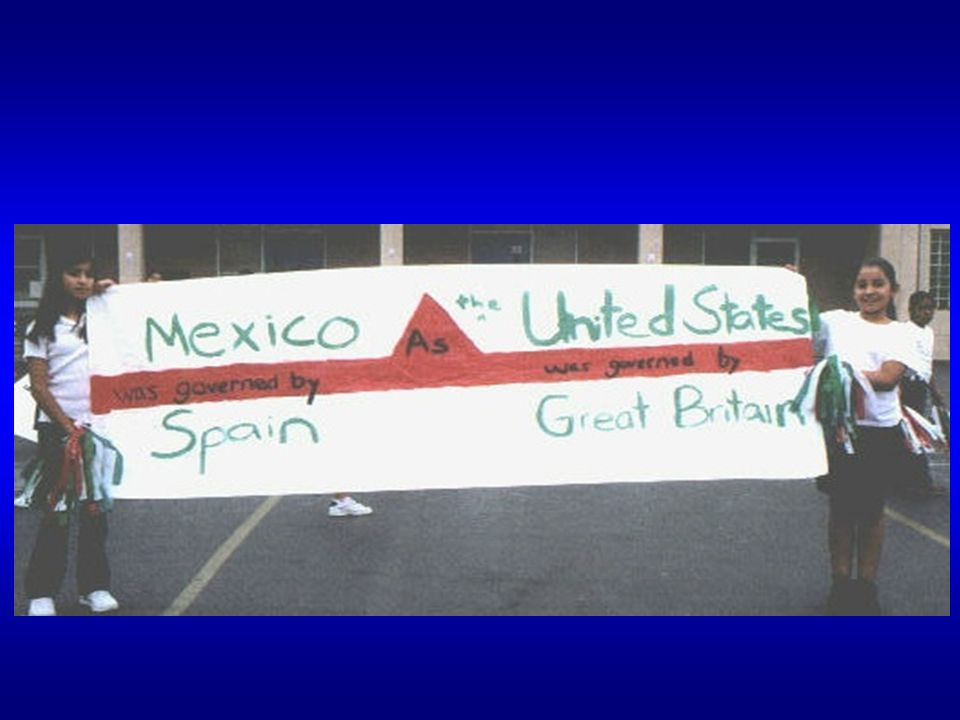
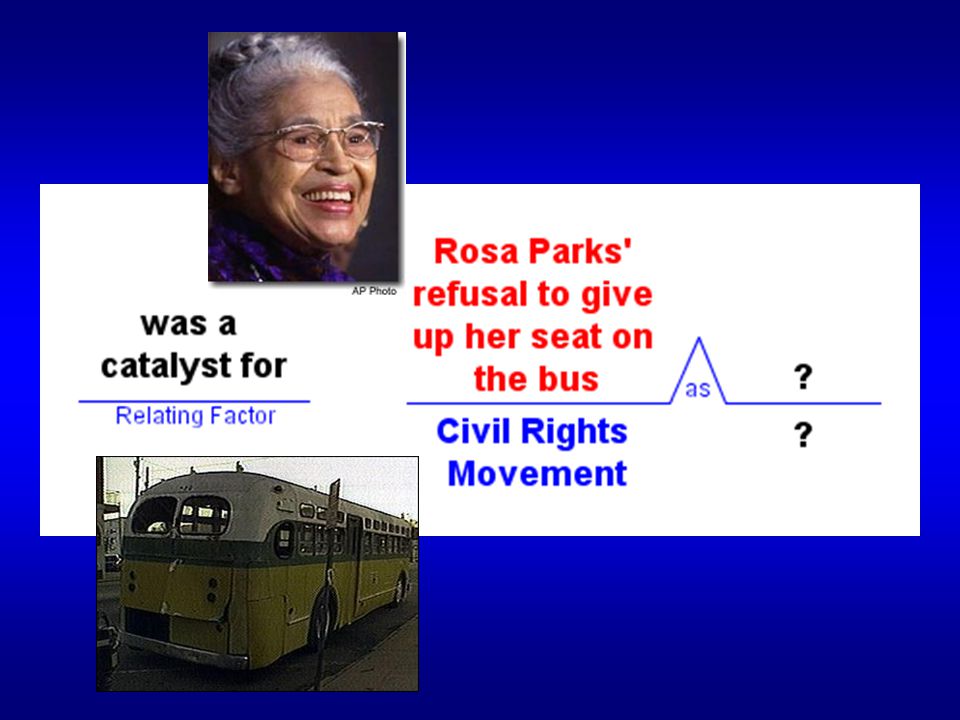
Page 19 The Bridge Map Seeing Analogies 44

45
DRAWING THE MAP THE BRIDGE MAP
Page 66 DRAWING THE MAP THE BRIDGE MAP 45

46
Page 68 KEY INFORMATION The Bridge Map helps students identify the relationships between words. As long as the relationship remains the same, the Bridge Map can be extended beyond 2 pairs of words. An apple is a type of fruit as a carrot is a type of vegetable. 46

47
Head Body Numerator Fraction AS Is the top part of...
Relating Factor: _________________

52
THE “FAT” BRIDGE A C Comes before Comes before B D

54
The Bubble Map Describing
An Overview of all 8 Thinking Maps Page 18 The Bubble Map Describing 54

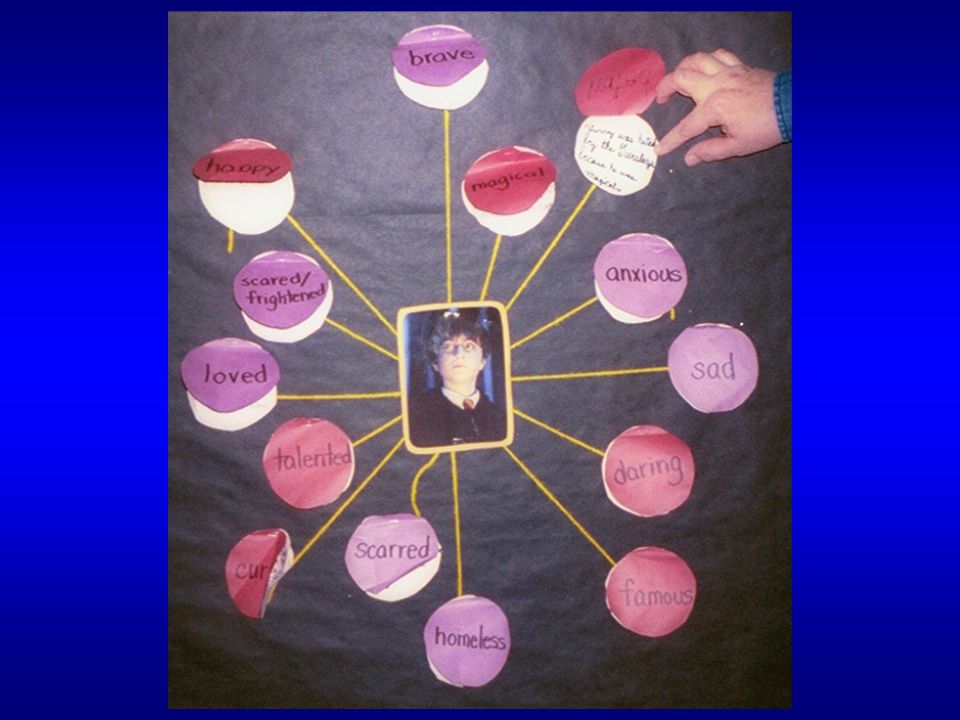
55
NOTE MAKING GUIDE For the BUBBLE MAP
Page 35 Notes: Adjectives and adjective phrases only. Great for vocabulary development (vivid word choice) and inferential thinking. Descriptors can be sensory, comparative, emotional or aesthetic. Focus on adjectives. One strategy is to keep a “Circle on the Side.” 55
 and inferential thinking. Descriptors can be sensory, comparative, emotional or aesthetic. Focus on adjectives. One strategy is to keep a Circle on the Side. 55.")
58
Science

59
Comparing and Contrasting
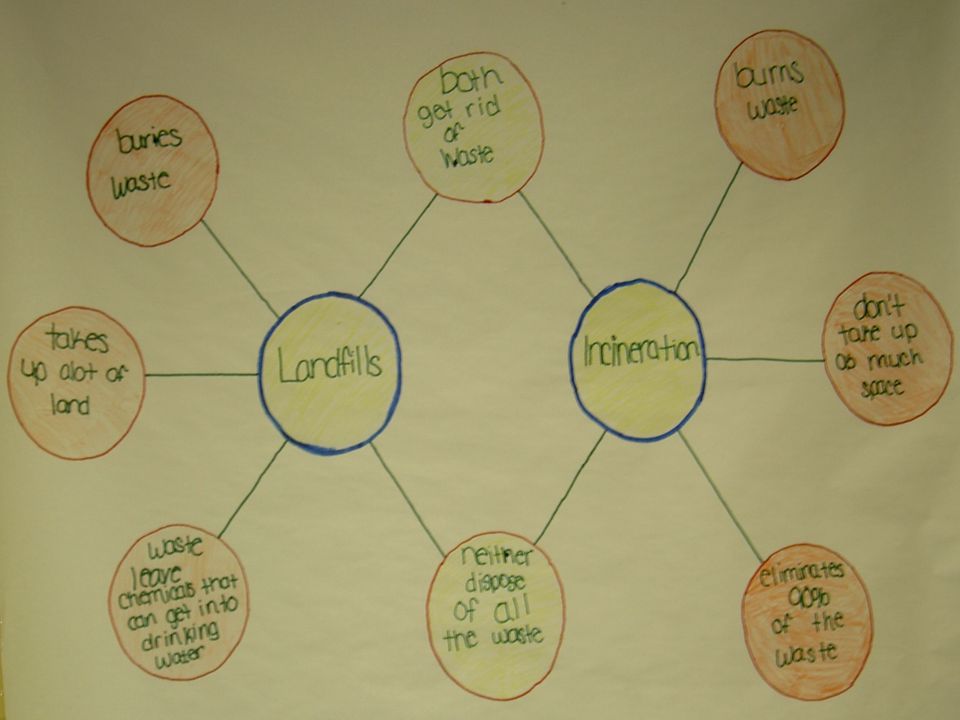
An Overview of all 8 Thinking Maps Page 18 The Double Bubble Map Comparing and Contrasting 59

60
For the DOUBLE BUBBLE MAP
NOTE MAKING GUIDE For the DOUBLE BUBBLE MAP Page 41 Notes: Helps students compare and contrast any ideas, people, cultures, concepts, things they are studying. Because of the depth of thought, students may need to create two Circle Maps, two Bubble Maps, etc before making the Double Bubble Map. How are these two things similar and different? Why are these similarities and differences important? What have you learned by constructing this map? The Double Bubble Map can be used in place of the Venn Diagram, especially when focusing on the differences between two things. The Venn Diagram should continue to be used in math for set theory. 60

63
Comparing enhances meaning

68
68

69
69

70
70

71
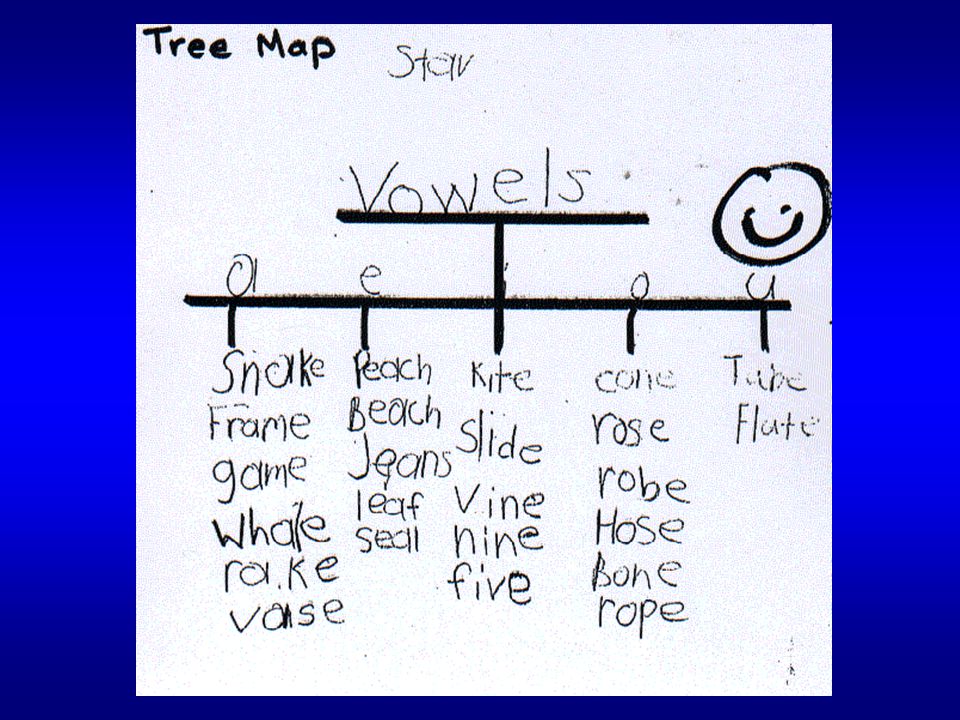
The Tree Map Classifying
An Overview of all 8 Thinking Maps Page 18 The Tree Map Classifying 71

72
NOTE MAKING GUIDE For the TREE MAP
Page 47 Notes: The Tree Map helps students classify information based on similar qualities, attributes, or details. They can be developed inductively or deductively. How would you group this information? What are the ideas and details that support your main idea? 72

77
Great for Assessment!

78
A “Growing” Tree Map

79
Equivalent Representations
0.8 6 1 80%

81
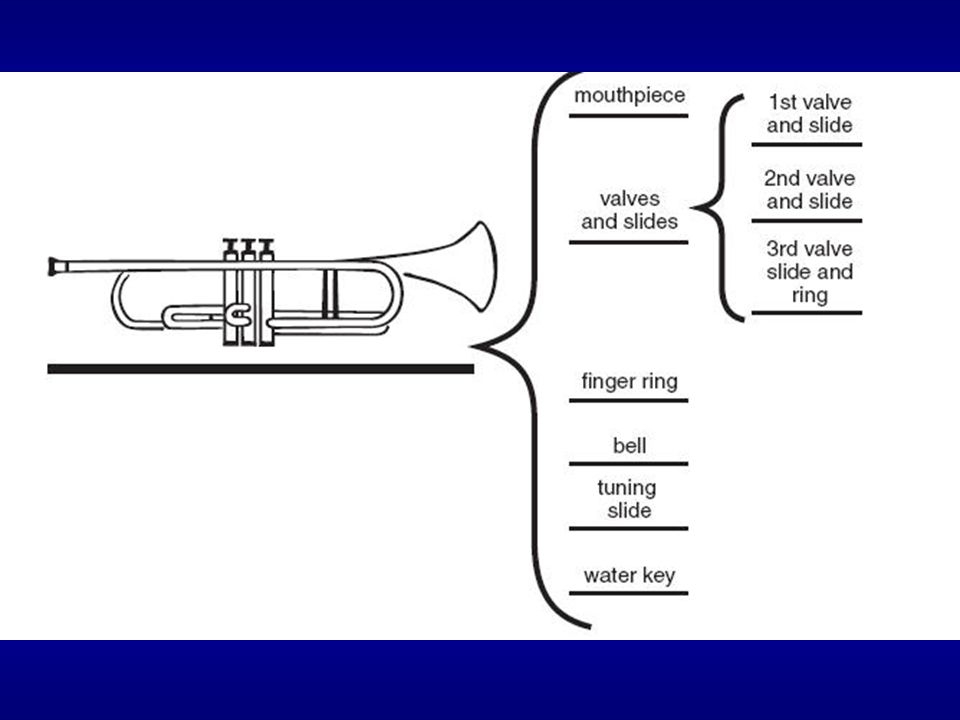
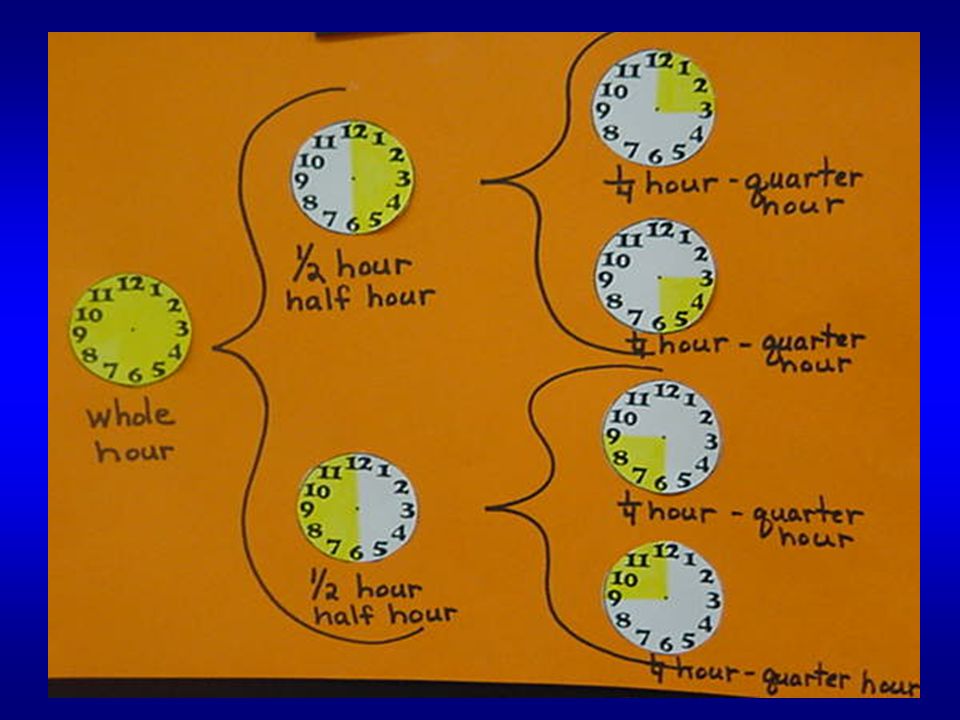
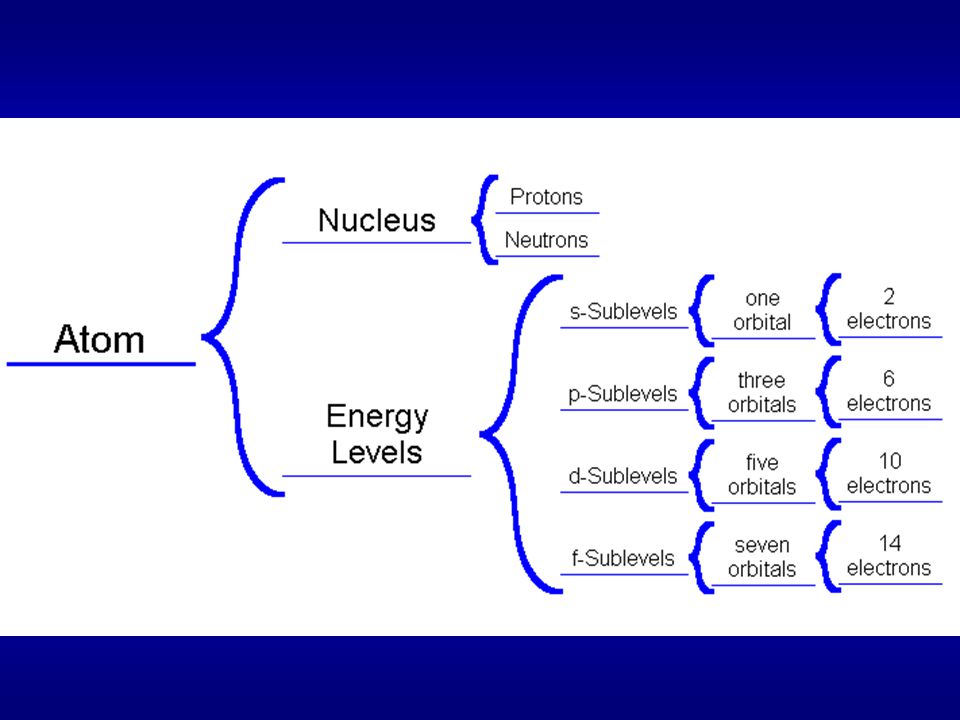
The Brace Map Whole to Parts
An Overview of all 8 Thinking Maps Page 19 The Brace Map Whole to Parts 81

82
NOTE MAKING GUIDE For the BRACE MAP
Page 53 Notes: The Brace Map is for the structural analysis of a concrete object. These maps almost always use nouns to name the parts of an object. What is the name of the whole object? What are the major physical parts of the object? What sources did you use to identify the whole and its parts? The Brace Map is often confused with a Tree Map. Remember that the Brace Map identifies “parts of” something. The Tree Map identifies “kinds of” things. 82

87
Enhance transfer: Part to Whole

89
Break down numbers to simplify additions
To illustrate my strategy for adding To show my thinking about groups of 10 Expanded notation helps with computation

90
Technology

92
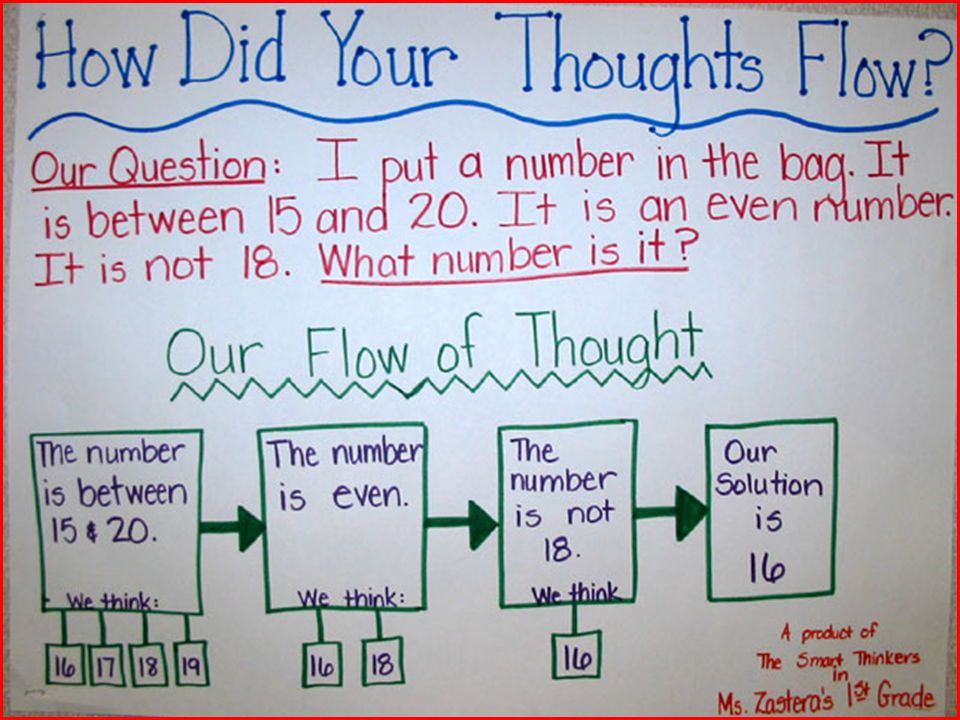
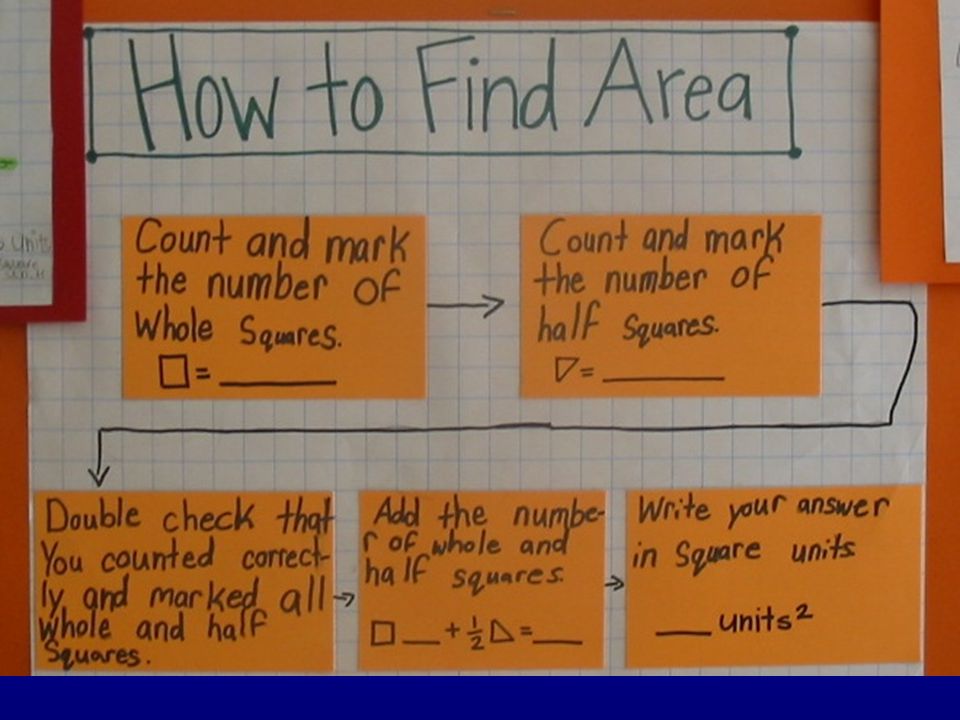
The Flow Map Sequencing
An Overview of all 8 Thinking Maps Page 19 The Flow Map Sequencing 92

93
NOTE MAKING GUIDE For the FLOW MAP
Page 59 Notes: A Flow Map can be used to show sequences, steps, comparisons or degrees. The Flow Map can be drawn from left to right, in a cycle, or in a rising and falling action form as long as each box is connected to another using an arrow. What is the name of the event or sequence? What are the stages of each event? What prior knowledge and/or experiences influence your understanding about this processes or series of events? The sub-stages in the Flow Map must also be in a sequence, not just a list of details. 93

101
An Overview of all 8 Thinking Maps
Page 19 The Multi-Flow Map Cause and Effect 101

102
Name the thought process:
NOTE MAKING GUIDE Page 65 Draw the Multi-Flow Map and label its parts. CAUSE AND EFFECT Name the thought process: 102

103
NOTE MAKING GUIDE Notes:
Page 65 Notes: The Multi-Flow Map helps students identify the causes and effects of an event. When constructing the map, always focus first on the event. The causes and effects do not have to balance. Students may also construct a one-sided Multi-Flow. What are the causes and effects of this event? Where did you get your information? Did a specific time period influence the causes and/or effects? The event is the key to this map. It must be a “happening.” The event should be “the flooding of the Nile” instead of just “the Nile.” 103

109
An Overview of all 8 Thinking Maps
Page 20 Adding a Frame of Reference How do you know what you know about this topic? Did your information come from a specific source? Is this information being influenced by a specific point of view? Who could use this information? Why is this information important? 109

110
Adding a Frame of Reference
Page 20 110

111
Adding a Frame of Reference
Page 20 Adding a Frame of Reference 111

112
For the FRAME OF REFERENCE
NOTE MAKING GUIDE For the FRAME OF REFERENCE Page 73 Notes: The Frame of Reference can be used around any map. 112

113
Introduction: Self-Assessment #2
Page 294 Introduction: Self-Assessment #2 1._____ Circle Map 2._____ Bubble Map 3._____ Double Bubble Map 4._____ Tree Map 5._____ Brace Map 6._____ Flow Map 7._____ Multi-Flow Map 8._____ Bridge Map E structural analysis, whole to part. components b. cause and effect, impact, outcomes c. see relationships, analogies compare and contrast, similarities and differences, uniqueness e. define in context, brainstorm f. sequence, order, steps in a process g. describe, name the qualities h. classify or sort, main idea and supporting details G D H A F B C 113

114
KEY WORDS FOR THINKING Page 77

115
There are at least 5 maps that can be created.
Now You Try… Read the article How many Thinking Maps can you create? 3. As a group, create your maps on chart paper. Be prepared to share. Hint: There are at least 5 maps that can be created. 115

116
Now You Try BUBBLE MAP FLOW MAP MULTI-FLOW MAP DOUBLE BUBBLE MAP
BRACE MAP 116

117
REFLECTION Think-Pair-Share
What will high quality implementation of Thinking Maps look like in classrooms? 117

Similar presentations


 California Preschool.>")


