Download presentation
Presentation is loading. Please wait.

1
Diabetes Mellitus and Metabolic Syndrome
By: Susan Yu-Gan, MD, FPCP

2
Definition refers to a group of common metabolic disorders that share the phenotype of hyperglycemia. Defect in metabolism of carbohydrates, fats and proteins due to relative/absolute deficiency in insulin secretion or action Result in severe complications

3
Diabetes is a serious disease

4
DM Local Prevalence Rate
Population = 80 M DM Prevalence: *FBS : 3.4 % ** FBS : 6.6 % FBS/history : 4.6 % Filipino DM : M *FBS > 125 mg/dL **FBS ≥101 mg/dL Morales D et al. for the NNHeS Group. PSH-PLS Convention. Feb 2005. Sy R et al. PJIM. 2003; 41: 1.-6.

5
Numbers Of People With Diabetes: Regional Figures For 2007 And Estimates For 2025
AFR, Africa; EMM, Eastern Mediterranean; EUR, Europe; NA, North America; SAC, South and Central America; SEA, South -East Asia; WP, Western Pacific International Diabetes Federation. Diabetes Atlas, 3rd edn. Brussels: IDF, 2006. 5

6
The Epidemic of Type 2 Rise in the prevalence and incidence of type 2 diabetes . Why? Increased awareness, more diagnosed New ADA and WHO criteria Longer life span Obesity Geographic variations Potential huge economic burden - complications

7
Walking the dog

8
Unique Features Of The Diabetes Epidemic In Asia
The increase in type 2 diabetes in Asia developed: in a shorter time in a younger age group in people with a much lower BMI in people with a high predisposition to insulin resistance at a lesser degree of obesity than people of European descent Asian Indians are more prone to diabetes because of increased insulin resistance, greater abdominal adiposity (i.e. higher waist circumference despite lower body mass index), lower adiponectin and higher high sensitive C-reactive protein levels. The primary driver of the epidemic of diabetes is the rapid epidemiological transition associated with changes in dietary patterns and decreased physical activity. Mohan V, Sandeep S, Deepa R, Shah B, Varghese C. Epidemiology of type 2 diabetes: Indian scenario. Indian J Med Res 2007; 125: 217–30. Yoon KH et al. Lancet 2006; 368: 1681–8. 8
, lower adiponectin and higher high sensitive C-reactive protein levels. The primary driver of the epidemic of diabetes is the rapid epidemiological transition associated with changes in dietary patterns and decreased physical activity. Mohan V, Sandeep S, Deepa R, Shah B, Varghese C. Epidemiology of type 2 diabetes: Indian scenario. Indian J Med Res 2007; 125: 217–30. Yoon KH et al. Lancet 2006; 368: 1681–8. 8.")
9
Risk Factors for Type 2 Diabetes
Patient Characteristics Medical History Clinical Findings Age > 45 years old Family history Hypertension Overweight/Obesity (BMI > 25 kg/m2) Coronary artery disease Dyslipidemia Physical inactivity Cerebrovascular accidents Race-Asians Previous history of IFG/IGT/GDM Discuss each one ADA. Screening for Type 2 Diabetes. Diabetes Care 2003; 26(Suppl1):s21-s24
 Coronary artery disease. Dyslipidemia. Physical inactivity. Cerebrovascular accidents. Race-Asians. Previous history of IFG/IGT/GDM. Discuss each one. ADA. Screening for Type 2 Diabetes. Diabetes Care 2003; 26(Suppl1):s21-s24.")
10
Screening Recommendations
Mass screening for type 2 diabetes in the general population is not recommended (Grade D, consensus) Testing for diabetes should be performed every 3 years in those over 45 years of age (Grade D, consensus) What’s grade D? Define FPG The Expert Committee on the Diagnosis and Classification of Diabetes Mellitus. Diabetes Care 2003; 26 (Suppl 1) S5-20
 Testing for diabetes should be performed every 3 years in those over 45 years of age (Grade D, consensus) What’s grade D Define FPG. The Expert Committee on the Diagnosis and Classification of Diabetes Mellitus. Diabetes Care 2003; 26 (Suppl 1) S5-20.")
11
Who Should Be Screened? All adults 45 y/o; and, if normal, at 3-yr intervals Younger age and more frequently in those at risk Obese First degree relative with diabetes High risk ethnic group Hx of GDM or delivered baby > 9 lbs. Hypertension (BP140/90) Dyslipidemia (HDL 35 mg/dL and/or triglyceride 250 mg/dL Previous IFG or IGT ADA. Diabetes Care 2000: 23 (suppl 1);
 Dyslipidemia (HDL 35 mg/dL and/or triglyceride 250 mg/dL. Previous IFG or IGT. ADA. Diabetes Care 2000: 23 (suppl 1);")
12
Confirming the Diagnosis of Type 2 Diabetes mellitus
Only possible through serum glucose measurement

13
Methods for Diagnosing DM
FPG 126 mg/dL (after 8 hr fast) Random Plasma Glucose 200 mg/dL w/ classic diabetes symptoms Polyuria, polydipsia, unexplained wt loss OGTT value 200 mg/dL in the 2-h sample Confirmed on at least 2 occasions A1c not routine test for diagnosis (2006) ADA. Diabetes Care 2000:23(suppl.1);
 Random Plasma Glucose 200 mg/dL w/ classic diabetes symptoms. Polyuria, polydipsia, unexplained wt loss. OGTT value 200 mg/dL in the 2-h sample. Confirmed on at least 2 occasions. A1c not routine test for diagnosis (2006) ADA. Diabetes Care 2000:23(suppl.1);")
14
Pre-Diabetes (IFG and IGT)
Levels of Glycemia Normal Pre-Diabetes (IFG and IGT) Diabetes Mellitus FPG <100 mg/dL (5.6 mmol/L) mg/dL ( mmol/L) > 126 mg/dL (7.0 mmol/L) 2hPG < 140 mg/dL (7.8 mmol/L) mg/dL ( mmol/L) > 200 mg/dL (11.1 mmol/L) What does casual plasma glucose mean? Define all acronyms
 Diabetes Mellitus. FPG. <100 mg/dL (5.6 mmol/L) mg/dL ( mmol/L) > 126 mg/dL (7.0 mmol/L) 2hPG. < 140 mg/dL (7.8 mmol/L) mg/dL ( mmol/L) > 200 mg/dL (11.1 mmol/L) What does casual plasma glucose mean Define all acronyms.")
15
Impaired Glucose Tolerance (IGT) and Impaired Fasting Glucose (IFG)
IGT and IFG refer to a metabolic stage intermediate between normal glucose homeostasis and diabetes IGT: 2hPG mg/dL to 199 mg/dL IFG: FBG mg/dL to 125 mg/dL Both are risk factors for future diabetes and cardiovascular disease Rearrange slides .. the order doesn’t make sense to me… ADA. Standards of medical care in diabetes. Diabetes Care 2004; 27 (Suppl 1):S13-34
:S")
16
Etiologic Classification of Diabetes Mellitus
Type 1 Diabetes Type 2 Diabetes Other specific types Gestational Diabetes Mellitus Put in beginning

17
Type 1 Diabetes Results from autoimmune destruction of pancreatic beta-cells Absolute insulin deficiency Patients typically dependent on insulin for survival Patients may present with ketoacidosis as initial sign of the disorder Ketoacidosis statement is misleading Report of the Expert Committee on the Diagnosis and Classification of Diabetes Mellitus. Diabetes Care 2003; 26(Suppl 1):s5-s20
:s5-s20.")
18
Type 2 Diabetes Insulin resistance and relative insulin deficiency
Patients may or may not need insulin treatment to survive May remain undiagnosed for many years, as hyperglycemia develops slowly Associated with strong genetic predisposition Heterogenous Ketoacidosis statement is misleading Report of the Expert Committee on the Diagnosis and Classification of Diabetes Mellitus. Diabetes Care 2003; 26(Suppl 1):s5-s20
:s5-s20.")
19
Other Specific Types Genetic defects of B cell function
Genetic defects in insulin action Diseases of the exocrine pancreas Endocrinopathies Drug - or chemical - induced Infections Uncommon forms of immune-mediated diabetes Other genetic syndromes sometimes associated with diabetes Report of the Expert Committee on the Diagnosis and Classification of Diabetes Mellitus. Diabetes Care 2003; 26(Suppl 1):s5-s20
:s5-s20.")
20
Gestational Diabetes Mellitus (GDM)
Any degree of glucose intolerance with onset or first recognition during pregnancy Associated with increased perinatal morbidity and mortality 6 weeks or more after pregnancy ends, the woman should be reclassified High risk for type 2 DM. Put in beginning Report of the Expert Committee on the Diagnosis and Classification of Diabetes Mellitus. Diabetes Care 2003; 26(Suppl 1):s5-s20
:s5-s20.")
21
Diagnosis of GDM with a 100-g or 75-g Glucose Load
mg/dL mmol/L 100-g Glucose Load Fasting 95 5.3 1 - h 180 10.0 2 - h 155 8.6 3 - h 140 7.8 75-g Glucose Load Report of the Expert Committee on the Diagnosis and Classification of Diabetes Mellitus. Diabetes Care 2003; 26(Suppl 1):s5-s20
:s5-s20.")
22
Pathology of Type 2 DM

23
PANCREAS The pancreas is an elongated organ nestled next to the first part of the small intestine. The endocrine pancreas refers to those cells within the pancreas that synthesize and secrete hormones. The endocrine portion of the pancreas takes the form of many small clusters of cells called islets of Langerhans or, more simply, islets. Humans have roughly one million islets.

24
PANCREAS Pancreatic islets house three major cell types, each of which produces a different endocrine product: Alpha Cells (A cells) secrete the hormone glucagon. Beta Cells (B cells) produce insulin and are the most abundant of the islet cells. Delta Cells (D cells) secrete the hormone somatostatin which is also produced by a number of other endocrine cells in the body.
 secrete the hormone glucagon. Beta Cells (B cells) produce insulin and are the most abundant of the islet cells. Delta Cells (D cells) secrete the hormone somatostatin which is also produced by a number of other endocrine cells in the body.")
25
PANCREAS Interestingly, the different cell types within an islet are not randomly distributed - beta cells occupy the central portion of the islet and are surrounded by a "ring" of alpha and delta cells. Aside from the insulin, glucagon and somatostatin, a number of other "minor" hormones have been identified as products of pancreatic islets cells.

26
Insulin Structure of Insulin
Insulin is a rather small protein, with a molecular weight of about 6000 Daltons. It is composed of two amino acid chains held together by disulfide bonds. When this two amino acid chains are split apart, the functional activity of insulin is lost. The amino acid sequence is highly conserved among vertebrates, and insulin from one mammal almost certainly is biologically active in another.

27
INSULIN BIOSYNTHESIS

28
INSULIN BIOCHEMISTRY Proinsulin- inactive chain of 86 a.a.
C Peptide- connecting peptide of 31 a.a. Insulin – remaining 51 a.a. made up of chains A and B

29
INSULIN SECRETION Pancreas secrets 40-50 units insulin/day
Basal insulin conc. in fasting state 10 U/mL Food ingestion, insulin conc. 8-10 min. initial increase 30-45 min peak min. returns to baseline values.

31
INSULIN Control of Insulin Secretion
Insulin is secreted primarily in response to elevated blood concentrations of glucose Some neural stimuli (e.g. site and taste of food) and increased blood concentrations of other fuel molecules, including amino acids and fatty acids, also promote insulin secretion. Glucose is transported into the B cell by facilitated diffusion through a glucose transporter; elevated concentrations of glucose in extracellular fluid lead to elevated concentrations of glucose within the B cell.
 and increased blood concentrations of other fuel molecules, including amino acids and fatty acids, also promote insulin secretion. Glucose is transported into the B cell by facilitated diffusion through a glucose transporter; elevated concentrations of glucose in extracellular fluid lead to elevated concentrations of glucose within the B cell.")
32
INSULIN Insulin Control of Insulin Secretion + -
Parasympathetic Nervous System Glucose Stimulus D i g e s t i v e hormones -Sympathetic nervous symtem -Sympathetic Nervous system Somastatin Growth hormone ACTH Glucagon Insulin + -

33
INSULIN Control of Insulin Secretion
Elevated concentrations of glucose within the B cell ultimately leads to membrane depolarization and an influx of extra cellular calcium. The resulting increase in intracellular calcium is thought to be one of the primary triggers for exocytosis of insulin-containing secretory granules. An increased level of glucose within B cells also appears to activate calcium-independent pathways that participate in insulin secretion.

35
INSULIN Physiologic Effects of Insulin
Insulin is a key player in the control of intermediary metabolism. Insulin has profound effects on: Carbohydrate metabolism Lipid metabolism Significant influences on protein and mineral metabolism Consequently, derangements in insulin signaling have widespread and devastating effects on many organs and tissues.

36
INSULIN The Insulin Receptor and Mechanism of Action
Like the receptors for other protein hormones, the receptor for insulin is embedded in the plasma membrane. The insulin receptor is composed of two alpha subunits and two beta subunits linked by disulfide bonds. The alpha chains are entirely extra cellular and house insulin binding domains, while the linked beta chains penetrate through the plasma membrane.

37
INSULIN Insulin and Carbohydrate Metabolism
Insulin facilitates entry of glucose into muscle, adipose and several other tissues. The only mechanism by which cells can take up glucose is by facilitated diffusion through a family of hexose transporters of many tissues - muscle being a prime example The major transporter used for uptake of glucose called GLUT4 is made available in the plasma membrane through the action of insulin. Binding of insulin to receptors on such cells leads rapidly to fusion of those vesicles with the plasma membrane and insertion of the glucose transporters, thereby giving the cell an ability to efficiently take up glucose.

38
INSULIN Insulin and Carbohydrate Metabolism
It should be noted here that there are some tissues that do not require insulin for efficient uptake of glucose: important examples are brain and the liver. This is because these cells don't use GLUT4 for importing glucose, but rather, another transporter that is not insulin-dependent. Insulin stimulates the liver to store glucose in the form of glycogen. A large fraction of glucose absorbed from the small intestine is immediately taken up by hepatocytes, which convert it into the storage polymer glycogen. When the supply of glucose is abundant, insulin “tells" the liver to bank as much of it as possible for use later.

39
INSULIN EFFECTS ON LIVER

40
INSULIN EFFECTS ON MUSCLE

41
INSULIN EFFECTS ON ADIPOSE TISSUE

42
INSULIN Insulin and Lipid Metabolism
When the liver is saturated with glycogen, any additional glucose taken up by hepatocytes is shunted into pathways leading to synthesis of fatty acids, which are exported from the liver as lipoproteins. The lipoproteins are ripped apart in the circulation, providing free fatty acids for use in other tissues, including adipocytes, which use them to synthesize triglyceride. Insulin inhibits breakdown of fat in adipose tissue by inhibiting the intracellular lipase that hydrolyzes triglycerides to release fatty acids.

43
INSULIN Other Notable Effects of Insulin
Insulin also stimulates the uptake of amino acids, again contributing to its overall anabolic effect. Insulin also increases the permeability of many cells to potassium, magnesium and phosphate ions. The effect on potassium is clinically important. Insulin activates Na/K ATPase in many cells, causing a flux of potassium into cells.

44
What happens to glucose in the body?
EXTERNAL DIET DIGESTION GLUCOSE Glycolysis ENERGY Glycogen STORAGE Lipogenesis FATS Glycogenesis Glycogenolysis Pyruvates + Lactates Amino acids Glycerol INTERNAL Gluconeogenesis (Liver)
")
45
What happens between meals?
Blood Glucose Liver mobilizes glycogen stores Break down of Glycogen = GLYCOGENOLYSIS Glucose Blood stream N.B. The liver is the only organ able to liberate glucose from its glycogen stores

46
What happens after a meal?

47
Insulin and Glucagon Regulate Normal Glucose Homeostasis
(α cell) Fasting state Fed state Pancreas Insulin (β cell) Insulin and Glucagon Regulate Normal Glucose Homeostasis Normal glucose homeostasis is maintained in large part through a feedback relationship between insulin, glucagon, and circulating glucose.1 Fasting State In the fasting state, pancreatic alpha (α) cells release glucagon.1,2 Glucagon release is triggered by a fall in the plasma glucose level.1 Concomitantly, the pancreatic beta (β) cells secrete less insulin. Glucagon directs the liver to break down stored glycogen into glucose (glycogenolysis).1 The liver also generates new glucose (gluconeogenesis) during fasting. The end result is that the liver releases glucose into the bloodstream, thereby raising the plasma glucose level and maintaining homeostasis. Fed State In the fed state, meal-derived glucose enters the bloodstream, and the β cells detect the rise in glucose level and respond by promptly releasing insulin.1 Insulin signals other tissues in the body to take in glucose to be used as energy or stored for later use.1 Insulin also signals the liver to decrease glucose production, thus suppressing hepatic glucose production. The net result is the lowering of the plasma glucose level. In the fed state, release of glucagon is suppressed, which also contributes to a decrease in glucose production.1 Normal functioning of this feedback loop helps maintain glucose homeostasis. Purpose: To explain how normal physiology works in order to set the foundation for understanding the physiologic defects in type 2 diabetes. This slide demonstrates the key regulatory roles of insulin and glucagon on glucose homeostasis in both the fasting and fed states. Take-away: Glucose homeostasis under normal conditions is well regulated. Glucose output Glucose uptake Liver Blood glucose Muscle Adipose tissue Porte D Jr, Kahn SE. Clin Invest Med. 1995;18:247–254. Adapted with permission from Kahn CR, Saltiel AR. In: Kahn CR et al, eds. Joslin’s Diabetes Mellitus. 14th ed. Lippincott Williams & Wilkins; 2005:145–168. References 1. Porte D Jr, Kahn SE. The key role of islet dysfunction in type II diabetes mellitus. Clin Invest Med ;18:247–254. 2. Unger RH. Glucagon and the insulin: glucagon ratio in diabetes and other catabolic illnesses. Diabetes ;20:834–838.
 Fasting state. Fed state. Pancreas. Insulin. (β cell) Insulin and Glucagon Regulate Normal Glucose Homeostasis. Normal glucose homeostasis is maintained in large part through a feedback relationship between insulin, glucagon, and circulating glucose.1. Fasting State. In the fasting state, pancreatic alpha (α) cells release glucagon.1,2 Glucagon release is triggered by a fall in the plasma glucose level.1 Concomitantly, the pancreatic beta (β) cells secrete less insulin. Glucagon directs the liver to break down stored glycogen into glucose (glycogenolysis).1 The liver also generates new glucose (gluconeogenesis) during fasting. The end result is that the liver releases glucose into the bloodstream, thereby raising the plasma glucose level and maintaining homeostasis. Fed State. In the fed state, meal-derived glucose enters the bloodstream, and the β cells detect the rise in glucose level and respond by promptly releasing insulin.1. Insulin signals other tissues in the body to take in glucose to be used as energy or stored for later use.1 Insulin also signals the liver to decrease glucose production, thus suppressing hepatic glucose production. The net result is the lowering of the plasma glucose level. In the fed state, release of glucagon is suppressed, which also contributes to a decrease in glucose production.1. Normal functioning of this feedback loop helps maintain glucose homeostasis. Purpose: To explain how normal physiology works in order to set the foundation for understanding the physiologic defects in type 2 diabetes. This slide demonstrates the key regulatory roles of insulin and glucagon on glucose homeostasis in both the fasting and fed states. Take-away: Glucose homeostasis under normal conditions is well regulated. Glucose output. Glucose uptake. Liver. Blood glucose. Muscle. Adipose tissue. Porte D Jr, Kahn SE. Clin Invest Med. 1995;18:247–254. Adapted with permission from Kahn CR, Saltiel AR. In: Kahn CR et al, eds. Joslin’s Diabetes Mellitus. 14th ed. Lippincott Williams & Wilkins; 2005:145–168. References. 1. Porte D Jr, Kahn SE. The key role of islet dysfunction in type II diabetes mellitus. Clin Invest Med. 1995;18:247– Unger RH. Glucagon and the insulin: glucagon ratio in diabetes and other catabolic illnesses. Diabetes. 1971;20:834–838.")
48
Major Pathophysiologic Defects in Type 2 Diabetes
Hepatic glucose output Insulin resistance Glucose uptake Glucagon (α cell) Insulin (β cell) Liver Hyperglycemia Islet-cell Dysfunction Muscle Adipose tissue Pancreas Major Pathophysiologic Defects in Type 2 Diabetes This diagram depicts the impact of type 2 diabetes on the feedback loop that regulates glucose homeostasis. In type 2 diabetes, insulin resistance is increased and insulin secretion is impaired.1 Most patients with type 2 diabetes have insulin resistance. Normally, pancreatic β cells increase insulin secretion to compensate for insulin resistance. However, when β-cell function is impaired, hyperglycemia develops.1 By the time diabetes is diagnosed, β-cell function has already decreased substantially and continues to decline over time.1 Once insulin secretion is impaired, an imbalance between insulin and glucagon can develop. Elevated glucagon levels lead to an increase in hepatic glucose production, which leads to an increase in blood glucose.1 Likewise, with decreased secretion of insulin, less glucose is taken up by muscle and adipose tissue.2 Purpose: To explain the 3 core defects of type 2 diabetes. Take-away: Insulin resistance, β-cell dysfunction, and elevated hepatic glucose production each contribute to hyperglycemia in type 2 diabetes. Adapted with permission from Kahn CR, Saltiel AR. In: Kahn CR et al, eds. Joslin’s Diabetes Mellitus. 14th ed. Lippincott Williams & Wilkins; 2005:145–168; Del Prato S, Marchetti P. Horm Metab Res. 2004;36:775–781; Porte D Jr, Kahn SE. Clin Invest Med. 1995;18:247–254. References 1. Del Prato S, Marchetti P. Beta- and alpha-cell dysfunction in type 2 diabetes. Horm Metab Res. 2004;36:775–781. 2. Porte D Jr, Kahn SE. The key role of islet dysfunction in type 2 diabetes mellitus. Clin Invest Med. 1995;18:247–254.
 Insulin. (β cell) Liver. Hyperglycemia. Islet-cell Dysfunction. Muscle. Adipose tissue. Pancreas. Major Pathophysiologic Defects in Type 2 Diabetes. This diagram depicts the impact of type 2 diabetes on the feedback loop that regulates glucose homeostasis. In type 2 diabetes, insulin resistance is increased and insulin secretion is impaired.1. Most patients with type 2 diabetes have insulin resistance. Normally, pancreatic β cells increase insulin secretion to compensate for insulin resistance. However, when β-cell function is impaired, hyperglycemia develops.1. By the time diabetes is diagnosed, β-cell function has already decreased substantially and continues to decline over time.1. Once insulin secretion is impaired, an imbalance between insulin and glucagon can develop. Elevated glucagon levels lead to an increase in hepatic glucose production, which leads to an increase in blood glucose.1. Likewise, with decreased secretion of insulin, less glucose is taken up by muscle and adipose tissue.2. Purpose: To explain the 3 core defects of type 2 diabetes. Take-away: Insulin resistance, β-cell dysfunction, and elevated hepatic glucose production each contribute to hyperglycemia in type 2 diabetes. Adapted with permission from Kahn CR, Saltiel AR. In: Kahn CR et al, eds. Joslin’s Diabetes Mellitus. 14th ed. Lippincott Williams & Wilkins; 2005:145–168; Del Prato S, Marchetti P. Horm Metab Res. 2004;36:775–781; Porte D Jr, Kahn SE. Clin Invest Med. 1995;18:247–254. References. 1. Del Prato S, Marchetti P. Beta- and alpha-cell dysfunction in type 2 diabetes. Horm Metab Res. 2004;36:775– Porte D Jr, Kahn SE. The key role of islet dysfunction in type 2 diabetes mellitus. Clin Invest Med. 1995;18:247–254.")
49
Incretin Hormones Regulate Insulin and Glucagon Levels
Pancreas Gut Nutrient signals ● Glucose Hormonal signals GLP-1 GIP Glucagon (GLP-1) Insulin (GLP-1,GIP) Neural signals cells cells Incretin Hormones Regulate Insulin and Glucagon Levels There is a close association between the gut and the pancreatic islets, a relationship that has been called the “enteroinsular axis” or “incretin axis.”1 This axis encompasses different types of signals between the gut and the pancreas including hormonal signals, neural signals, and nutrient signals.1 The hormonal signals in the enteroinsular axis are the incretins.1 Incretin hormones affect the activity of insulin-secreting β cells, causing a lowering of blood glucose levels by modulation of insulin release.2 Importantly, the glucose-lowering effect of incretin hormones is glucose-dependent. Both GLP-13 and GIP4 have only minimal activity on insulin secretion at fasting or basal glucose concentrations. In addition to its incretin effect, GLP-1 has a modulating effect on the glucagon-secreting α cells in the pancreas.5 This effect of GLP-1 also is glucose-dependent.6 Thus a relationship exists between nutrient-induced release of gastrointestinal factors and pancreatic function. Incretin hormones released from the gut in response to nutrient intake partly modulate insulin secretion, and GLP-1 also modulates glucagon secretion. Purpose: To provide a high level overview of the incretin axis. Take-away: In response to the oral ingestion of glucose, the gut releases incretin hormones, which in turn stimulate insulin from the pancreatic β cells and suppress glucagon release from α cells. GLP-1 = glucagon-like peptide-1; GIP = glucose insulinotropic polypeptide Adapted from Kieffer T. Endocrine Reviews. 1999;20:876–913. Drucker DJ. Diabetes Care. 2003;26:2929–2940. Nauck MA et al. Diabetologia. 1993;36:741–744. Adapted with permission from Creutzfeldt W. Diabetologia. 1979;16:75–85. Copyright © Springer-Verlag. References 1. Kieffer TJ, Habener JF. The glucagon-like peptides. Endocr Rev. 1999; 20:876–913. 2. Creutzfeldt W. The [pre-] history of the incretin concept. Regul Pept. 2005;128:87–91. 3. D’Alessio DA, Vahl TP. Glucagon-like peptide 1: Evolution of an incretin into a treatment for diabetes. Am J Physiol Endocrinol Metab. 2004;286:E882–E890. 4. Gautier JF, Fetita S, Sobngwi E, Salaün-Martin C. Biological actions of the incretins GIP and GLP-1 and therapeutic perspectives in patients with type 2 diabetes. Diabetes Metab. 2005;31:233–242. 5. Ahrén B. Gut peptides and type 2 diabetes mellitus treatment. Curr Diab Rep. 2003;3:365–372. 6. Nauck MA, Kleine N, Orskov C, Holst JJ, Willms B, Creutzfeldt W. Normalization of fasting hyperglycaemia by exogenous glucagon-like peptide 1(7-36 amide) in type 2 (non-insulin-dependent) diabetic patients. Diabetologia. 1993;36:741–744.
 Insulin. (GLP-1,GIP) Neural signals. cells. cells. Incretin Hormones Regulate Insulin and Glucagon Levels. There is a close association between the gut and the pancreatic islets, a relationship that has been called the enteroinsular axis or incretin axis. 1 This axis encompasses different types of signals between the gut and the pancreas including hormonal signals, neural signals, and nutrient signals.1 The hormonal signals in the enteroinsular axis are the incretins.1. Incretin hormones affect the activity of insulin-secreting β cells, causing a lowering of blood glucose levels by modulation of insulin release.2 Importantly, the glucose-lowering effect of incretin hormones is glucose-dependent. Both GLP-13 and GIP4 have only minimal activity on insulin secretion at fasting or basal glucose concentrations. In addition to its incretin effect, GLP-1 has a modulating effect on the glucagon-secreting α cells in the pancreas.5 This effect of GLP-1 also is glucose-dependent.6. Thus a relationship exists between nutrient-induced release of gastrointestinal factors and pancreatic function. Incretin hormones released from the gut in response to nutrient intake partly modulate insulin secretion, and GLP-1 also modulates glucagon secretion. Purpose: To provide a high level overview of the incretin axis. Take-away: In response to the oral ingestion of glucose, the gut releases incretin hormones, which in turn stimulate insulin from the pancreatic β cells and suppress glucagon release from α cells. GLP-1 = glucagon-like peptide-1; GIP = glucose insulinotropic polypeptide. Adapted from Kieffer T. Endocrine Reviews. 1999;20:876–913. Drucker DJ. Diabetes Care. 2003;26:2929–2940. Nauck MA et al. Diabetologia. 1993;36:741–744. Adapted with permission from Creutzfeldt W. Diabetologia. 1979;16:75–85. Copyright © 1979 Springer-Verlag. References. 1. Kieffer TJ, Habener JF. The glucagon-like peptides. Endocr Rev. 1999; 20:876– Creutzfeldt W. The [pre-] history of the incretin concept. Regul Pept. 2005;128:87– D’Alessio DA, Vahl TP. Glucagon-like peptide 1: Evolution of an incretin into a treatment for diabetes. Am J Physiol Endocrinol Metab. 2004;286:E882–E Gautier JF, Fetita S, Sobngwi E, Salaün-Martin C. Biological actions of the incretins GIP and GLP-1 and therapeutic perspectives in patients with type 2 diabetes. Diabetes Metab. 2005;31:233– Ahrén B. Gut peptides and type 2 diabetes mellitus treatment. Curr Diab Rep. 2003;3:365– Nauck MA, Kleine N, Orskov C, Holst JJ, Willms B, Creutzfeldt W. Normalization of fasting hyperglycaemia by exogenous glucagon-like peptide 1(7-36 amide) in type 2 (non-insulin-dependent) diabetic patients. Diabetologia. 1993;36:741–744.")
50
The Incretin Axis Peptides released by the gut throughout the day and increased in response to meals — participate in normal glucoregulation GLP-1 and GIP are the dominant incretins Both stimulate insulin release from β-cells and GLP-1 inhibits glucagon release from -cells The incretin axis is abnormal in patients with T2DM Reduced release of GLP-1 Reduced response to GIP Drucker DJ. Diabetes Care. 2003: ; Ahren B. Curr Diab Rep. 2003;3: ; Drucker DJ Gastroenterology. 2002;122: ; Dunning BE, et al. Diabetologia. 2005;48: ADA 2006 Late Breaking Clinical Presentation (Stein).
.")
51
Demonstrated Effects of the Incretin Hormones GLP-1 and GIP
Is released from L cells in ileum and colon Stimulates insulin response from β cells in a glucose-dependent manner Inhibits gastric emptying Reduces food intake and body weight Inhibits glucagon secretion from α cells in a glucose-dependent manner Effect on β-cell turnover in preclinical models Is released from K cells in duodenum Stimulates insulin response from β cells in a glucose-dependent manner Has minimal effects on gastric emptying Has no significant effects on satiety or body weight Does not appear to inhibit glucagon secretion from α cells Effect on β-cell turnover in preclinical models Demonstrated Effects of the Incretin Hormones GLP-1 and GIP GLP-1 and GIP are the currently identified incretin hormones. An incretin is a hormone with the following characteristics1,2: - It is released from the intestine in response to ingestion of food, particularly glucose. - The circulating concentration of the hormone must be sufficiently high to stimulate the release of insulin. - The release of insulin in response to physiological levels of the hormone occurs only when glucose levels are elevated (glucose-dependent). GIP and GLP-1 are hormones that fulfill these 3 characteristics, qualifying them as incretins.2 In the fasting state, GIP and GLP-1 circulate at very low levels. Their levels rapidly increase after food ingestion and play a role in the release of insulin.3,4 GLP-1 stimulates insulin response from β cells in a glucose-dependent manner and suppresses glucagon secretion from α cells in a glucose-dependent manner. GIP also potentiates insulin release from β cells in a glucose-dependent manner.5 Other effects of GLP-1 and GIP are summarized on the slide. Purpose: To describe the 2 main incretins, GLP-1 and GIP. Take-away: Both GLP-1 and GIP play key roles in glucose homeostasis. GLP-1 and GIP both stimulate insulin secretion in a glucose-dependent manner, and GLP-1 also inhibits glucagon secretion in a glucose-dependent manner. Meier JJ et al. Best Pract Res Clin Endocrinol Metab. 2004;18:587–606; Drucker DJ. Diabetes Care. 2003;26:2929–2940. Farilla L et al. Endocrinology. 2003;144:5149–5158. References 1. Creutzfeldt W. The [pre-] history of the incretin concept. Regul Pept. 2005;128:87–91. 2. Creutzfeldt W. The entero-insular axis in type 2 diabetes – incretins as therapeutic agents. Exp Clin Endocrinol Diabetes. 2001;109(suppl 2):S288-S303. 3. Gautier JF, Fetita S, Sobngwi E, Salaün-Martin C. Biological actions of the incretins GIP and GLP-1 and therapeutic perspectives in patients with type 2 diabetes. Diabetes Metab. 2005;31:233–242. 4. Holst JJ, Gromada J. Role of incretin hormones in the regulation of insulin secretion in diabetic and nondiabetic humans. Am J Physiol Endocrinol Metab. 2004;287:E199–E206. 5. Meier JJ, Nauck MA. Glucose-dependent insulinotropic polypeptide/gastric inhibitory polypeptide. Best Pract Res Clin Endocrinol Metab. 2004;18:587–606.
. GIP and GLP-1 are hormones that fulfill these 3 characteristics, qualifying them as incretins.2. In the fasting state, GIP and GLP-1 circulate at very low levels. Their levels rapidly increase after food ingestion and play a role in the release of insulin.3,4. GLP-1 stimulates insulin response from β cells in a glucose-dependent manner and suppresses glucagon secretion from α cells in a glucose-dependent manner. GIP also potentiates insulin release from β cells in a glucose-dependent manner.5 Other effects of GLP-1 and GIP are summarized on the slide. Purpose: To describe the 2 main incretins, GLP-1 and GIP. Take-away: Both GLP-1 and GIP play key roles in glucose homeostasis. GLP-1 and GIP both stimulate insulin secretion in a glucose-dependent manner, and GLP-1 also inhibits glucagon secretion in a glucose-dependent manner. Meier JJ et al. Best Pract Res Clin Endocrinol Metab. 2004;18:587–606; Drucker DJ. Diabetes Care. 2003;26:2929–2940. Farilla L et al. Endocrinology. 2003;144:5149–5158. References. 1. Creutzfeldt W. The [pre-] history of the incretin concept. Regul Pept. 2005;128:87– Creutzfeldt W. The entero-insular axis in type 2 diabetes – incretins as therapeutic agents. Exp Clin Endocrinol Diabetes. 2001;109(suppl 2):S288-S Gautier JF, Fetita S, Sobngwi E, Salaün-Martin C. Biological actions of the incretins GIP and GLP-1 and therapeutic perspectives in patients with type 2 diabetes. Diabetes Metab. 2005;31:233– Holst JJ, Gromada J. Role of incretin hormones in the regulation of insulin secretion in diabetic and nondiabetic humans. Am J Physiol Endocrinol Metab. 2004;287:E199–E Meier JJ, Nauck MA. Glucose-dependent insulinotropic polypeptide/gastric inhibitory polypeptide. Best Pract Res Clin Endocrinol Metab. 2004;18:587–606.")
52
Role of Incretins in Glucose Homeostasis
Ingestion of food β cells α cells Release of gut hormones — incretins* Pancreas Glucose-dependent Insulin from β cells (GLP-1 and GIP) Glucose uptake by muscles Glucose dependent Glucagon from α cells (GLP-1) GI tract Active GLP-1 & GIP DPP-4 enzyme Inactive GIP Inactive GLP-1 *Incretins are also released throughout the day at basal levels. Glucose production by liver Blood glucose in fasting and postprandial states Role of Incretins in Glucose Homeostasis After food is ingested, GIP is released from K cells in the proximal gut (duodenum), and GLP-1 is released from L cells in the distal gut (ileum and colon).1–3 Under normal circumstances, DPP-4 rapidly degrades these incretins to their inactive forms after their release into the circulation.1,2 Actions of GLP-1 and GIP include stimulating insulin response in pancreatic β cells (GLP-1 and GIP) and suppressing glucagon production (GLP-1) in pancreatic α cells when the glucose level is elevated.2,3 The subsequent increase in glucose uptake in muscles3,4 and reduced glucose output from the liver2 help maintain glucose homeostasis. Thus, the incretins GLP-1 and GIP are important glucoregulatory hormones that positively affect glucose homeostasis by physiologically helping to regulate insulin in a glucose-dependent manner.2,3 GLP-1 also helps to regulate glucagon secretion in a glucose-dependent manner.2,5 Purpose: To demonstrate how the incretin pathway is part of the normal physiology of glucose homeostasis. Take-away: After food ingestion, incretins stimulate insulin release from β cells and suppress glucagon release from α cells in a glucose-dependent manner, resulting in downstream effects that regulate glucose homeostasis. The activity of the incretins is limited by the DPP-4 enzyme. Adapted from Kieffer TJ, Habener JF. Endocr Rev. 1999;20:876–913; Ahrén B. Curr Diab Rep. 2003;2:365–372; Drucker DJ. Diabetes Care. 2003;26:2929–2940; Holst JJ. Diabetes Metab Res Rev. 2002;18:430–441. References 1. Kieffer TJ, Habener JF. The glucagon-like peptides. Endocr Rev. 1999;20:876–913. 2. Ahrén B. Gut peptides and type 2 diabetes mellitus treatment. Curr Diab Rep. 2003;3:365–372. 3. Drucker DJ. Enhancing incretin action for the treatment of type 2 diabetes. Diabetes Care. 2003;26:2929–2940. 4. Holst JJ. Therapy of type 2 diabetes mellitus based on the actions of glucagon-like peptide-1. Diabetes Metab Res Rev. 2002;18:430–441. 5. Nauck MA, Kleine N, Ørskov C, Holst JJ, Wilms B, Creutzfeldt W. Normalization of fasting hyperglycaemia by exogenous glucagon-like peptide 1 (7-36 amide) in type 2 (non-insulin-dependent) diabetic patients. Diabetologia. 1993;36:741–744.
 Glucose uptake by muscles. Glucose dependent. Glucagon from α cells. (GLP-1) GI tract. Active. GLP-1 & GIP. DPP-4 enzyme. Inactive GIP. Inactive GLP-1. *Incretins are also released throughout the day at basal levels. Glucose production by liver. Blood glucose in fasting and postprandial states. Role of Incretins in Glucose Homeostasis. After food is ingested, GIP is released from K cells in the proximal gut (duodenum), and GLP-1 is released from L cells in the distal gut (ileum and colon).1–3 Under normal circumstances, DPP-4 rapidly degrades these incretins to their inactive forms after their release into the circulation.1,2. Actions of GLP-1 and GIP include stimulating insulin response in pancreatic β cells (GLP-1 and GIP) and suppressing glucagon production (GLP-1) in pancreatic α cells when the glucose level is elevated.2,3 The subsequent increase in glucose uptake in muscles3,4 and reduced glucose output from the liver2 help maintain glucose homeostasis. Thus, the incretins GLP-1 and GIP are important glucoregulatory hormones that positively affect glucose homeostasis by physiologically helping to regulate insulin in a glucose-dependent manner.2,3 GLP-1 also helps to regulate glucagon secretion in a glucose-dependent manner.2,5. Purpose: To demonstrate how the incretin pathway is part of the normal physiology of glucose homeostasis. Take-away: After food ingestion, incretins stimulate insulin release from β cells and suppress glucagon release from α cells in a glucose-dependent manner, resulting in downstream effects that regulate glucose homeostasis. The activity of the incretins is limited by the DPP-4 enzyme. Adapted from Kieffer TJ, Habener JF. Endocr Rev. 1999;20:876–913; Ahrén B. Curr Diab Rep. 2003;2:365–372; Drucker DJ. Diabetes Care. 2003;26:2929–2940; Holst JJ. Diabetes Metab Res Rev. 2002;18:430–441. References. 1. Kieffer TJ, Habener JF. The glucagon-like peptides. Endocr Rev. 1999;20:876– Ahrén B. Gut peptides and type 2 diabetes mellitus treatment. Curr Diab Rep. 2003;3:365– Drucker DJ. Enhancing incretin action for the treatment of type 2 diabetes. Diabetes Care. 2003;26:2929– Holst JJ. Therapy of type 2 diabetes mellitus based on the actions of glucagon-like peptide-1. Diabetes Metab Res Rev. 2002;18:430– Nauck MA, Kleine N, Ørskov C, Holst JJ, Wilms B, Creutzfeldt W. Normalization of fasting hyperglycaemia by exogenous glucagon-like peptide 1 (7-36 amide) in type 2 (non-insulin-dependent) diabetic patients. Diabetologia. 1993;36:741–744.")
53
Fate of Glucose If energy is needed immediately, glucose is metabolized to produce energy via glycolysis. If more glucose is available than what the cells need immediately for energy, the extra glucose is converted to glycogen via a process called glycogenesis. Glycogenesis occurs primarily in liver cells and, to a limited extent, in muscle cells. When glucose is not immediately required for energy and the storage capacity for glycogen is reached in the liver and muscle, additional glucose can be oxidized or converted to fat.

55
GLUT 4 Transporters Before After

57
Natural History Of Disease Progression
Macrovascular complications Microvascular complications b-cell function Insulin resistance Blood glucose There is a temporal relationship between insulin resistance, insulin secretion, and the development of diabetes. In the early stages of pathogenesis, as insulin resistance rises, there is a compensatory increase in insulin secretion and the individual remains normoglycaemic.1 In the long term, if the -cells begin to fail, insulin secretion falls, impaired glucose tolerance (IGT) and impaired fasting glucose (IFG) develop, and hyperglycaemia reaches levels defined as type 2 diabetes.1 However, diabetes is not always diagnosed until many years later. Development of diabetes is associated with the development of serious complications that begin before type 2 diabetes is diagnosed.2 The risk of complications increases as the disease progresses.3 There are two potential approaches to delaying the progression of the disease and its associated complications: firstly, prevention interventions at the stage of IGT/IFG, and secondly, treatment interventions to delay disease progression following diagnosis. DeFronzo RA. Med Clin N Am 2004; 88:787–835. Hu FB, et al. Diabetes Care 2002; 25:1129–34. Stratton IM, et al. UKPDS 35. BMJ 2000; 32:405–412. –10 Prevention Treatment 10 Years Diagnosis IGT/IFG Type 2 diabetes DeFronzo RA. Med Clin N Am 2004; 88:787–835.
 and impaired fasting glucose (IFG) develop, and hyperglycaemia reaches levels defined as type 2 diabetes.1 However, diabetes is not always diagnosed until many years later. Development of diabetes is associated with the development of serious complications that begin before type 2 diabetes is diagnosed.2 The risk of complications increases as the disease progresses.3. There are two potential approaches to delaying the progression of the disease and its associated complications: firstly, prevention interventions at the stage of IGT/IFG, and secondly, treatment interventions to delay disease progression following diagnosis. DeFronzo RA. Med Clin N Am 2004; 88:787–835. Hu FB, et al. Diabetes Care 2002; 25:1129–34. Stratton IM, et al. UKPDS 35. BMJ 2000; 32:405–412. –10. Prevention. Treatment. 10. Years. Diagnosis. IGT/IFG. Type 2 diabetes. DeFronzo RA. Med Clin N Am 2004; 88:787–835.")
58
Glucose Homeostasis Pancreas
The presence of glucose in the bloodstream will entice the beta cells of the pancreas to produce a hormone called insulin. Pancreas

59
Insulin Action in Normal Tissues (Cellular Level)
(GLUT 4) Glucose transport proteins Insulin receptors Cell
 Glucose transport proteins. Insulin receptors. Cell.")
60
Insulin Action in Normal Tissues (Cellular Level)
(GLUT 4) Glucose transport proteins Insulin receptors Cell
 Glucose transport proteins. Insulin receptors. Cell.")
61
Insulin Action in Normal Tissues (Cellular Level)
(GLUT 4) Glucose transport proteins Insulin receptors Cell
 Glucose transport proteins. Insulin receptors. Cell.")
62
Insulin Action in Normal Tissues (Cellular Level)
(GLUT 4) Glucose transport proteins Insulin receptors Cell
 Glucose transport proteins. Insulin receptors. Cell.")
63
Insulin Resistance Cell (GLUT 4) Glucose transport proteins
Insulin receptors Cell

64
Insulin Resistance Cell (GLUT 4) Glucose transport proteins
Insulin receptors Cell

65
Insulin Resistance Cell Cell (GLUT 4) Glucose transport proteins
Insulin receptors Cell Insulin receptors (GLUT 4) Glucose transport proteins Cell In the case, the signal transmitted by the insulin IS MUCH WEAKER than the ones transmitted in the normal cells.
 Glucose transport proteins. Cell. In the case, the signal transmitted by the insulin IS MUCH WEAKER than the ones transmitted in the normal cells.")
66
Insulin Resistance Cell Insulin receptors
As a result, only a few glucose could enter the cell. Less Glucose ULITIZATION. Consequently, both blood glucose and insulin levels are elevated. Cell

67
POST-Receptor Level Early stage - normal to IGT
INSULIN RESISTANCE Phase: Disease Progression Stage : POST-Receptor Level Early stage - normal to IGT Receptor Level Hyperinsulinemia- IGT to T2D As a result, only a few glucose could enter the cell. Less Glucose ULITIZATION. Consequently, both blood glucose and insulin levels are elevated.

68
INSULIN RESISTANCE Phase: Disease Progression Stage :
Pre- Receptor Level Latter Part Stage - Beta-cell Dysfuntion (Pancreatic exhaustion) As a result, only a few glucose could enter the cell. Less Glucose ULITIZATION. Consequently, both blood glucose and insulin levels are elevated.
 As a result, only a few glucose could enter the cell. Less Glucose ULITIZATION. Consequently, both blood glucose and insulin levels are elevated.")
69
Pathogenesis of Type 2 Diabetes

70
ADA and IDF Guidelines: Treatment Goals for HbA1c, FPG, and PPG
Parameter Normal Level ADA Goal IDF Goal FPG, mg/dL (mmol/L) <110 (<6.1) 90–130 (5.0–7.2) <110 (<6.1) PPG, mg/dL (mmol/L) <140 (<7.8) <180 (<10.0) <145 (<8.1) HbA1c 4%–6% <7%* <6.5% ADA and IDF Guidelines: Treatment Goals for HbA1c, FPG, and PPG The table presents guidelines from the American Diabetes Association (ADA) and the International Diabetes Federation (IDF).1,2 The ADA and IDF recommend slightly different treatment goals of FPG, PPG, and HbA1c levels.1,2 Both organizations emphasize the importance of good glycemic control. The ADA suggest that the goal of treatment in the management of diabetes should be an HbA1c value less than 7%.1 IDF suggests an HbA1c goal of less than 6.5%.2 The ADA target of FPG levels of 90 to 130 mg/dL (5.0–7.2 mmol/L) is based on the estimate of the range of average glucose values that would be associated with a low risk of hypoglycemia and HbA1c less than 7%.1 IDF recommends a target FPG level of less than 110 mg/dL (<6.1 mmol/L).2 The ADA recommend reducing average PPG values (2-hour oral glucose tolerance testing [OGTT]) to less than 180 mg/dL (10.0 mmol/L),1 whereas IDF suggests a target PPG level of less than 145 mg/dL (<8.1 mmol/L).2 Purpose: To provide a reminder of current ADA and IDF guidelines for treating type 2 diabetes. Take-away: It is important to target all 3 treatment goals for glucose control HbA1c, FPG, and PPG). *The HbA1c goal of an individual patient is to achieve an HbA1c as close to normal (<6%) as possible without significant hypoglycemia. ADA=American Diabetes Association; IDF=International Diabetes Federation. ADA. Diabetes Care. 2007;30(suppl 1):S4–S41; International Diabetes Federation. 2005:1–79. References 1. American Diabetes Association. Standards of Medical Care in Diabetes–2007. Diabetes Care. 2007;30(suppl 1): S4–S41. 2. International Diabetes Federation. Global Guidelines for Type 2 Diabetes.2005:1-79. Available at Accessed on August 2005.
 <110 (<6.1) 90–130 (5.0–7.2) <110 (<6.1) PPG, mg/dL (mmol/L) <140 (<7.8) <180. (<10.0) <145. (<8.1) HbA1c. 4%–6% <7%* <6.5% ADA and IDF Guidelines: Treatment Goals for HbA1c, FPG, and PPG. The table presents guidelines from the American Diabetes Association (ADA) and the International Diabetes Federation (IDF).1,2. The ADA and IDF recommend slightly different treatment goals of FPG, PPG, and HbA1c levels.1,2 Both organizations emphasize the importance of good glycemic control. The ADA suggest that the goal of treatment in the management of diabetes should be an HbA1c value less than 7%.1 IDF suggests an HbA1c goal of less than 6.5%.2. The ADA target of FPG levels of 90 to 130 mg/dL (5.0–7.2 mmol/L) is based on the estimate of the range of average glucose values that would be associated with a low risk of hypoglycemia and HbA1c less than 7%.1 IDF recommends a target FPG level of less than 110 mg/dL (<6.1 mmol/L).2. The ADA recommend reducing average PPG values (2-hour oral glucose tolerance testing [OGTT]) to less than 180 mg/dL (10.0 mmol/L),1 whereas IDF suggests a target PPG level of less than 145 mg/dL (<8.1 mmol/L).2. Purpose: To provide a reminder of current ADA and IDF guidelines for treating type 2 diabetes. Take-away: It is important to target all 3 treatment goals for glucose control HbA1c, FPG, and PPG). *The HbA1c goal of an individual patient is to achieve an HbA1c as close to normal (<6%) as possible without significant hypoglycemia. ADA=American Diabetes Association; IDF=International Diabetes Federation. ADA. Diabetes Care. 2007;30(suppl 1):S4–S41; International Diabetes Federation. 2005:1–79. References. 1. American Diabetes Association. Standards of Medical Care in Diabetes–2007. Diabetes Care. 2007;30(suppl 1): S4–S International Diabetes Federation. Global Guidelines for Type 2 Diabetes.2005:1-79. Available at Accessed on August")
71
Therapy for Type 2 DM Lifestyle changes Pharmacologic Diet
Exercise Stop smoking Glycemic control Prevent complications Prevent disease progression Pharmacologic Glycemic control Prevent complications Prevent disease progression Treat co-morbid conditions Minimal side effects

72
Nutrient Composition of the Therapeutic Lifestyle Change (TLC) Diet
Recommended Intake Carbohydrate 50% to 60% of total calories; mostly from food rich in complex carbohydrates Fiber 20-30 g/day Protein Approximately 15% of total calories Cholesterol <200 mg/day Total Calories Balance energy intake and expenditure; should include at least moderate physical activity Executive Summary of the Third Report of the National Cholesterol Education Program (NCEP) Expert Panel Detection, Evaluation, and Treatment of High Blood Cholesterol in Adults (Adult Treatment Panel III). JAMA. 2001;285:
 Expert Panel Detection, Evaluation, and Treatment of High Blood Cholesterol. in Adults (Adult Treatment Panel III). JAMA. 2001;285:")
73
Primary Sites Of Action Of Oral Anti-diabetic Agents
Thiazolidinediones Biguanides Muscle Adipose tissue Liver DPP-4 inhibitors DPP-4 Pancreas Stomach Insulin Glucose Thiazolidinediones (e.g. rosiglitazone) decrease insulin resistance in adipose tissue, skeletal muscle and liver. In addition, they may have a beneficial effect on -cell function. They are direct insulin sensitizers that act as agonists for the nuclear receptor peroxisome proliferator-activated receptor-gamma (PPARg). PPARg increases the transcription of certain insulin-sensitive genes, thereby improving insulin sensitivity. Biguanides such as metformin primarily suppress hepatic glucose output. In addition, they enhance insulin sensitivity and stimulate insulin-mediated glucose disposal. They do not stimulate insulin secretion. Sulphonylureas and meglitinides both lower fasting blood glucose concentrations, primarily by stimulating insulin secretion from the pancreas. Alpha-glucosidase inhibitors such as acarbose delay digestion and absorption of carbohydrates in the gastrointestinal tract. They inhibit the enzyme a-glucosidase, responsible for the metabolism of complex carbohydrates into absorbable monosaccharides. Glucagon-like peptide 1 (GLP-1) analogues mimic GLP-1, a gastrointestinal hormone that increases insulin secretion from the pancreas and inhibits glucagon release. Dipeptidyl peptidase 4 (DPP-4) inhibitors block the DPP-4 enzyme which would otherwise inactivate GLP-1. Kobayashi M. Diabetes Obes Metab 1999; 1(Suppl. 1):S32–S40. Nattrass M & Bailey CJ. Baillieres Best Pract Res Clin Endocrinol Metab 1999; 13:309–329. Pratley RE & Salsali A. Curr Med Res Opin 2007; 23:919–931. Todd JF & Bloom SR. Diabet Med 2007; 24:223–232. GLP-1 a-glucosidase inhibitors Sulphonylureas and meglitinides GLP-1 analogues Gut Adapted from Kobayashi M. Diabetes Obes Metab 1999; 1(Suppl. 1):S32–S40. Nattrass M & Bailey CJ. Baillieres Best Pract Res Clin Endocrinol Metab 1999; 13:309–329. Pratley RE & Salsali A. Curr Med Res Opin 2007; 23:919–931. Todd JF & Bloom SR. Diabet Med 2007; 24:223–232.
 decrease insulin resistance in adipose tissue, skeletal muscle and liver. In addition, they may have a beneficial effect on -cell function. They are direct insulin sensitizers that act as agonists for the nuclear receptor peroxisome proliferator-activated receptor-gamma (PPARg). PPARg increases the transcription of certain insulin-sensitive genes, thereby improving insulin sensitivity. Biguanides such as metformin primarily suppress hepatic glucose output. In addition, they enhance insulin sensitivity and stimulate insulin-mediated glucose disposal. They do not stimulate insulin secretion. Sulphonylureas and meglitinides both lower fasting blood glucose concentrations, primarily by stimulating insulin secretion from the pancreas. Alpha-glucosidase inhibitors such as acarbose delay digestion and absorption of carbohydrates in the gastrointestinal tract. They inhibit the enzyme a-glucosidase, responsible for the metabolism of complex carbohydrates into absorbable monosaccharides. Glucagon-like peptide 1 (GLP-1) analogues mimic GLP-1, a gastrointestinal hormone that increases insulin secretion from the pancreas and inhibits glucagon release. Dipeptidyl peptidase 4 (DPP-4) inhibitors block the DPP-4 enzyme which would otherwise inactivate GLP-1. Kobayashi M. Diabetes Obes Metab 1999; 1(Suppl. 1):S32–S40. Nattrass M & Bailey CJ. Baillieres Best Pract Res Clin Endocrinol Metab 1999; 13:309–329. Pratley RE & Salsali A. Curr Med Res Opin 2007; 23:919–931. Todd JF & Bloom SR. Diabet Med 2007; 24:223–232. GLP-1. a-glucosidase inhibitors. Sulphonylureas and meglitinides. GLP-1 analogues. Gut. Adapted from Kobayashi M. Diabetes Obes Metab 1999; 1(Suppl. 1):S32–S40. Nattrass M & Bailey CJ. Baillieres Best Pract Res Clin Endocrinol Metab 1999; 13:309–329. Pratley RE & Salsali A. Curr Med Res Opin 2007; 23:919–931. Todd JF & Bloom SR. Diabet Med 2007; 24:223–232.")
74
Insulin Secretagogues: Basic Characteristics
Mechanism of action: Increase basal and postprandial insulin secretion Therapeutic efficacy: Decreases HbA1c 1%-2%* Recommended dosing: Sulfonylureas: 1-2x daily Repaglinide, nateglinide: 3x daily Adverse effects: Weight gain, hypoglycemia The Insulin Secretagogues: Basic Characteristics of the Meglitinides and the Sulfonylureas The insulin secretagogues, which include the meglitinides and the sulfonylureas, lower plasma glucose by augmenting insulin secretion by the pancreatic beta-cells and are thus only effective if functioning pancreatic beta-cells are present. During treatment with the insulin secretagogues, a reduction of glycosylated hemoglobin (HbA1c) by approximately 1.0% to 2.1% may be expected. The sulfonylureas may be given once or twice daily, while repaglinide, the only agent in the meglitinides group currently available in the United States, is given three times daily. Weight gain is the most notable side effect; allergy occurs rarely. The main risk accompanying sulfonylurea treatment is the potential for hypoglycemia. Amaryl PI. Hoechst Marion Roussel, August 1997; DiaBeta PI. Hoechst Marion Roussel, September 1997; Glucotrol PI. Pfizer, September 1993; Glynase PI. Pharmacia & Upjohn, January 1999; Micronase PI. Pharmacia & Upjohn, February 1999; Prandin PI. Novo Nordisk, October 1998. *Results vary according to clinical trial design, individual patient characteristics, and data analyses. Amaryl PI. Hoechst Marion Roussel, August 1997; DiaBeta PI. Hoechst Marion Roussel, September 1997; Glucotrol PI. Pfizer, September 1993; Glynase PI. Pharmacia & Upjohn, February 1999; Micronase PI. Pharmacia & Upjohn, January 1999; Prandin PI. Novo Nordisk, October 1998.
 by approximately 1.0% to 2.1% may be expected. The sulfonylureas may be given once or twice daily, while repaglinide, the only agent in the meglitinides group currently available in the United States, is given three times daily. Weight gain is the most notable side effect; allergy occurs rarely. The main risk accompanying sulfonylurea treatment is the potential for hypoglycemia. Amaryl PI. Hoechst Marion Roussel, August 1997; DiaBeta PI. Hoechst Marion Roussel, September 1997; Glucotrol PI. Pfizer, September 1993; Glynase PI. Pharmacia & Upjohn, January 1999; Micronase PI. Pharmacia & Upjohn, February 1999; Prandin PI. Novo Nordisk, October *Results vary according to clinical trial design, individual patient characteristics, and data analyses. Amaryl PI. Hoechst Marion Roussel, August 1997; DiaBeta PI. Hoechst Marion Roussel, September 1997; Glucotrol PI. Pfizer, September 1993; Glynase PI. Pharmacia & Upjohn, February 1999; Micronase PI. Pharmacia & Upjohn, January 1999; Prandin PI. Novo Nordisk, October")
75
Sulfonylureas Tolbutamide Chlorpropamide Glibenclamide/Glyburide
Gliclazide Glipizide Glimepiride

76
Guideline for Use of SULFONYLUREAS
Action Generic Trade Name Preparation Daily Dose Short Tolbutamide Rastinon 500 mg tablet 1/2 - 6 tabs Inter-mediate Glibenclamide Gliclazide Glipizide Glimepiride Euglucon Daonil Orabetic Diamicron MR Diamicron Dianorm Glubitor Minidiab OD Solosa Norizec 2.5/5.0 mg tab 5.0 mg tablet 5.0 mg tablet 30 mg tablet mg tablet 80 mg tablet 5/10 mg tab 1,2,3 mg tab 1/2 - 3 tabs pre-breakfast 1/2 - 4 tabs ½ -6 tabs 1-4 mg Long Acting Chlorpropamide Diabenese 250 mg tablet 1/2 - 2 tabs

77
Meglitinides Also stimulates insulin secretion by the pancreas
Shorter acting than sulfonylureas Targets the postprandial elevation of blood sugar

78
Meglitinides Repaglinide Nateglinide

79
Biguanides (Metformin)
Suppresses hepatic glucose output An insulin sensitizer May cause Lactic acidosis Contraindicated in patients with hepatic and renal insufficiency and in patients with hypoxemia

80
Metformin Reduce liver glucose production Yes (liver predominantly)
Action Reduce liver glucose production Insulin sensitivity Yes (liver predominantly) Hepatic glucose output Reduced Serum insulin No effect Hypoglycaemia No Lipids Onset of action Moderate Weight Neutral or reduced Effectiveness over time Safety GI effects Drug interactions Renal insufficiency (Lactic acidosis)
 Hepatic glucose output. Reduced. Serum insulin. No effect. Hypoglycaemia. No. Lipids. Onset of action. Moderate. Weight. Neutral or reduced. Effectiveness over time. Safety. GI effects. Drug interactions. Renal insufficiency (Lactic acidosis)")
82
Acarbose Reduced glucose absorption No effect Moderate
Action Reduced glucose absorption Insulin sensitivity No effect Hepatic glucose output Serum insulin Hypoglycaemia Lipids Onset of action Moderate Weight Neutral or reduced Effectiveness over time Uncertain (at 3 years) Safety GI effects Hepatic (LFT elevation) Drug interactions (few
 Safety. GI effects. Hepatic (LFT elevation) Drug interactions (few.")
83
Thiazolidinediones Insulin sensitizers Acts by activation of PPAR
Must monitor liver enzymes Side effects include fluid retention, edema, anemia

84
Thiazolidinediones Troglitazone Rosiglitazone Pioglitazone

85
Thiazolidinediones Insulin sensitizer Slight decrease Decreased
Hepatic (Inc LFT in Troglitazone) Drug interactions (few) Weight gain ? Edema ? Safety Durable Effectiveness over time Increased Weight Moderate to late Onset of action Generally positive Lipids No effect Hypoglycaemia Decreased Serum insulin Slight decrease Hepatic glucose output Insulin sensitivity Insulin sensitizer Action
 Drug interactions (few) Weight gain Edema Safety. Durable. Effectiveness over time. Increased. Weight. Moderate to late. Onset of action. Generally positive. Lipids. No effect. Hypoglycaemia. Decreased. Serum insulin. Slight decrease. Hepatic glucose output. Insulin sensitivity. Insulin sensitizer. Action.")
86
Indications for Insulin in Type 2 Diabetes
Hyperglycemia despite maximum doses of oral agents Decompensation due to intercurrent events e.g., infection, acute injury, or other stress Development of severe hyperglycemia with ketonemia and/or ketonuria Uncontrolled weight loss

87
Indications for Insulin in Type 2 Diabetes
Perioperative in patients undergoing surgery Pregnancy Renal or hepatic disease Allergy or other serious reaction to oral agents

88
Algorithm for the Metabolic Management of Type 2 Diabetes
Tier 1: Well-validated core therapies Lifestyle + Metformin + Basal insulin Sulfonylurea STEP 2 Lifestyle + Metformin + Intensive insulin STEP 3 At diagnosis: Lifestyle + Metformin STEP 1 Tier 2: Less well-validated therapies Lifestyle + Metformin + GLP-I agonists No hypoglycemia Weight loss Nausea/vomiting + Pioglitazone Oedema/CHF Bone loss Lifestyle + Metformin + Pioglitazone + Sulfonylurea + Basal Insulin

89
Type 2 diabetes is associated with serious complications
Stroke Diabetic Retinopathy 2- to 4-fold increase in cardiovascular mortality and stroke5 Leading cause of blindness in adults1,2 Cardiovascular Disease 8/10 individuals with diabetes die from CV events6 Serious microvascular and macrovascular complications of type 2 diabetes have a devastating effect on quality of life and impose a heavy burden on healthcare systems. Diabetic retinopathy: present in 21% of people at the time type 2 diabetes is diagnosed,1 diabetic retinopathy is the leading cause of new blindness among adults aged 20–74 years.2 Diabetic nephropathy: present in 18% of people diagnosed with diabetes;3 diabetes is a leading cause of end-stage renal disease.4 Stroke: diabetes is associated with a 2- to 4-fold increase in cardiovascular mortality and stroke.5 Cardiovascular disease: 75% of individuals with type 2 diabetes die from cardiovascular causes.6 Diabetic neuropathy: present in 12% of people at diagnosis,1 diabetic neuropathy affects approximately 70% of people with diabetes7 and is a leading cause of non-traumatic lower extremity amputations.8 In the UKPDS, 50% of individuals with diabetes already had complications at diagnosis.9 Early detection and treatment of diabetes is essential in order to reduce the impact of its serious complications. 1UK Prospective Diabetes Study Group. Diabetes Res 1990; 13:1–11. 2Fong DS, et al. Diabetes Care 2003; 26 (Suppl. 1):S99–S The Hypertension in Diabetes Study Group. J Hypertens 1993; 11:309–317. 4Molitch ME, et al. Diabetes Care 2003; 26 (Suppl. 1):S94–S98. 5Kannel WB, et al. Am Heart J 1990; 120:672– Gray RP & Yudkin JS. Cardiovascular disease in diabetes mellitus. In Textbook of Diabetes 2nd Edition, Blackwell Sciences. 7King’s Fund. Counting the cost. The real impact of non-insulin dependent diabetes. London: British Diabetic Association, Mayfield JA, et al. Diabetes Care 2003; 26 (Suppl. 1):S78–S79. 9UKPDS Group. Diabetologia 1991; 34:877–890. Diabetic Nephropathy Diabetic Neuropathy Leading cause of end-stage renal disease3,4 Leading cause of non-traumatic lower extremity amputations7,8 1UK Prospective Diabetes Study Group. Diabetes Res 1990; 13:1–11. 2Fong DS, et al. Diabetes Care 2003; 26 (Suppl. 1):S99–S102. 3The Hypertension in Diabetes Study Group. J Hypertens 1993; 11:309–317. 4Molitch ME, et al. Diabetes Care 2003; 26 (Suppl. 1):S94–S98. 5Kannel WB, et al. Am Heart J 1990; 120:672–676. 6Gray RP & Yudkin JS. Cardiovascular disease in diabetes mellitus. In Textbook of Diabetes 2nd Edition, Blackwell Sciences. 7King’s Fund. Counting the cost. The real impact of non-insulin dependent diabetes. London: British Diabetic Association, Mayfield JA, et al. Diabetes Care 2003; 26 (Suppl. 1):S78–S79.
:S99–S102. 3The Hypertension in Diabetes Study Group. J Hypertens 1993; 11:309–317. 4Molitch ME, et al. Diabetes Care 2003; 26 (Suppl. 1):S94–S98. 5Kannel WB, et al. Am Heart J 1990; 120:672–676. 6Gray RP & Yudkin JS. Cardiovascular disease in diabetes mellitus. In Textbook of Diabetes 2nd Edition, Blackwell Sciences. 7King’s Fund. Counting the cost. The real impact of non-insulin dependent diabetes. London: British Diabetic Association, Mayfield JA, et al. Diabetes Care 2003; 26 (Suppl. 1):S78–S79. 9UKPDS Group. Diabetologia 1991; 34:877–890. Diabetic. Nephropathy. Diabetic Neuropathy. Leading cause of. end-stage renal disease3,4. Leading cause of non-traumatic lower extremity amputations7,8. 1UK Prospective Diabetes Study Group. Diabetes Res 1990; 13:1–11. 2Fong DS, et al. Diabetes Care 2003; 26 (Suppl. 1):S99–S102. 3The Hypertension in Diabetes Study Group. J Hypertens 1993; 11:309–317. 4Molitch ME, et al. Diabetes Care 2003; 26 (Suppl. 1):S94–S98. 5Kannel WB, et al. Am Heart J 1990; 120:672–676. 6Gray RP & Yudkin JS. Cardiovascular disease in diabetes mellitus. In Textbook of Diabetes 2nd Edition, Blackwell Sciences. 7King’s Fund. Counting the cost. The real impact of non-insulin dependent diabetes. London: British Diabetic Association, Mayfield JA, et al. Diabetes Care 2003; 26 (Suppl. 1):S78–S79.")
91
Biology of Microvascular Complications
Hyperglycemia Eye Kidney Nerves Retinopathy Cataract Glaucoma Nephropathy Microalbuminuria Gross albuminuria Neuropathy Peripheral Autonomic Blindness Kidney failure Amputation Death and/or disability

92
Biology of Macrovascular Complications
Metabolic injury to large vessels Heart Brain Extremities Cardiovascular disease Acute coronary syndrome Myocardial infarction (MI) Congestive heart failure Cerebrovascular disease Transient ischemic attack Stroke Cognitive impairment Peripheral vascular syndrome Ulcers Gangrene Amputations
 Congestive heart failure. Cerebrovascular disease. Transient ischemic attack. Stroke. Cognitive impairment. Peripheral vascular syndrome. Ulcers. Gangrene. Amputations.")
93
Impact of Type 2 Diabetes on Macrovascular Disease
Largest cause of morbidity and mortality Risk of CVD increased 2- to 4-fold Higher case fatality vs non diabetic individuals Reduced survival post–MI, post–CABG, and particularly post–PTCA Risk of stroke and peripheral vascular disease substantially increased In addition to the 2- to 4-fold increased risk of CVD, type 2 diabetes is associated with a higher case fatality post–myocardial infarction (MI) and a poorer outcome after interventional procedures. People with diabetes experience high rates of out-of-hospital mortality. This argues for aggressive primary prevention. Betteridge DJ. Diabetic dyslipidaemias. Acta Diabetol. 1999;36:S25-S29. Nesto R. CHD: a major burden in type 2 diabetes. Acta Diabetol. 2001;38:S3-S8. Betteridge DJ. Acta Diabetol. 1999;36:S25-S29. Nesto R. Acta Diabetol. 2001;38:S3-S8. 93
 and a poorer outcome after interventional procedures. People with diabetes experience high rates of out-of-hospital mortality. This argues for aggressive primary prevention. Betteridge DJ. Diabetic dyslipidaemias. Acta Diabetol. 1999;36:S25-S29. Nesto R. CHD: a major burden in type 2 diabetes. Acta Diabetol. 2001;38:S3-S8. Betteridge DJ. Acta Diabetol. 1999;36:S25-S29. Nesto R. Acta Diabetol. 2001;38:S3-S")
94
Diabetic Macroangiopathy
Atherosclerosis Atherosclerosis begins to appear in most diabetics whatever their age, within a few year of onset of diabetes. The susceptibility of diabetics to atherosclerosis is due to several factors: Hyperlipidemia HDL Levels are reduced in type 2 diabetics Diabetics have increased platelet adhesiveness and response to aggregative agents. Most type 2 diabetic patients are obese and hypertensive which further contributes to Atherosclerosis

95
CLINICAL PRESENTATION OF MACROANGIOPATHY
Stroke Estimated relative risk of stroke in diabetes mellitus: 2 – 8% Mainly due to the atherosclerosis of the cerebral vessels leading to the rupture and ischemia of the cerebral tissue. Coronary Heart Diseases √ Ischaemic heart disease Type 2 diabetics develop CHD at a young age The 5-Years risk of ischaemic events is doubled Worse outcome post –MI

96
PATHOPHYSIOLOGY OF THE DIABETIC FOOT

97
PATHOPHYSIOLOGY OF THE DIABETIC FOOT
atherosclerosis Of the leg vessels Infection (contributes to tissue necrosis) Peripheral neuropathy claudication ulceration gangrene rest pain Ischemia (Often bilateral) Sensory deficit Autonomic dysfunction
 Peripheral. neuropathy. claudication. ulceration. gangrene. rest pain. Ischemia (Often bilateral) Sensory deficit. Autonomic dysfunction.")
98
Diabetic Neuropathy Numbness, tingling or pain in the toes, feet, legs, hands, arms and fingers Wasting of muscles of feet or hands Indigestion, nausea or vomiting Diarrhea or constipation Dizziness or faintness due to a drop in postural blood pressue Problems with urination Erectile dysfunction (impotence) or vaginal dryness Weakness
 or vaginal dryness. Weakness.")
100
INFECTIONS Hyperglycemia favors Development of infection
Urinary tract Infection Skin infection Respiratory tract infection Treatment of infection And improved blood glucose Control

101
DIABETIC RETINOPATHY One of the most threatening aspects of DM’s the development of visual impairment Epidemiology Leading cause of blindness in Western countries Retinopathy is the most common complication of diabetes. Risk factors are: duration of diabetes, poor BG control, high Blood pressure, hypercholesterolemia, proteinuria.

102
DIABETIC RETINOPATHY Symptoms Reduction in visual acuity
Reduction in visual fields Reduction in vision of colors

103
DIABETIC NEPHROPATHY A major cause of end-stage renal disease and dialysis. The kidneys are usually the most severely damaged organs in diabetics Diabetic nephropathy with proteinuria is a common serious complication affecting Type 1 and Type 2 diabetes. Affect 25% of the diabetics

105
Natural History of Diabetic Nephropathy

106
Definition of Abnormal Albumin Excretion
UAER UAER Urinary (mg/24H) (mcg/min) albumin/ creatinine (mg/gm) Normal < 30 < 20 < 30 Microalbuminuria 30 – – – 300 Macroalbuminuria > 300 > 200 > 300
 (mcg/min) albumin/ creatinine (mg/gm) Normal < 30 < 20 < 30 Microalbuminuria 30 – – – 300 Macroalbuminuria > 300 > 200 > 300")
107
Measurements Albumin to creatinine ratio 24 hour urine collection
Timed collection (4 H or overnight) Screen for with reagent strips
 Screen for with reagent strips.")
108
False Positives Short time hyperglycemia Exercise
Acute febrile illness UTI Marked hypertension CHF

109
Microvascular Complications of Diabetes
Stages of diabetic nephropathy (Adapted from Mogensen 1999) Stage UAE Rate (μg/min) Blood Pressure Glomerular Filtration rate (GFR) Histological Changes 1 Hyperfiltration 0 – 20 Normal Increased by 20 – 50 % Increased Glomerular size Normoalbuminuria Basement Membrane (BM) thickening 2 Microalbuminuria 21 – 200 Normal or elevated Still high, but declines with proteinuria BM thickening Mesangial expansion 3 Proteinuria >200 Elevated Decline ~10ml/min/yr Pronounced abnormalities 4 End-stage renal Failure Hypertension <10ml/min Advanced glomerulopathy
 Stage. UAE. Rate. (μg/min) Blood. Pressure. Glomerular. Filtration rate. (GFR) Histological. Changes. 1. Hyperfiltration. 0 – 20. Normal. Increased by. 20 – 50 % Increased. Glomerular size. Normoalbuminuria. Basement. Membrane (BM) thickening. 2. Microalbuminuria. 21 – 200. Normal or. elevated. Still high, but. declines with. proteinuria. BM thickening. Mesangial. expansion. 3. Proteinuria. >200. Elevated. Decline. ~10ml/min/yr. Pronounced. abnormalities. 4. End-stage renal Failure. Hypertension. <10ml/min. Advanced. glomerulopathy.")
110
Risk Factors DM Nephropathy
Poor glycemic control and insulin resistance Hypertension Albuminuria Smoking High dietary intake of protein Hyperlipidemia

111
Microvascular Complications of Diabetes
Diabetic Nephropathy: Therapeutic Strategies Microalbuminuria predicts cardiovascular morbidity and mortality as well as renal disease Treatment should delay or prevent the progression of microalbuminuria to proteinuria Trials have shown that therapeutic strategies should include: - intensive glycaemic control - aggressive control of blood pressure (ACE inhibitors)
")
112
Treatment Recommendations for Diabetic Patients with Albuminuria/Nephropathy
In the treatment of albuminuria/nephropathy, both ACE inhibitors and ARBs can b used: In hypertensive and non-hypertensive T1 DM: ACE-inhibitors are the initial agents of choice In hypertensive and non-hypertensive T2 DM: ARBs are the initial agents of choice The new 2002 ADA Guidelines reflect the existing and more recent clinical study data in patients with type 1 and type 2 diabetes, which demonstrate the benefit of ACE-inhibitors and ARBs over other antihypertensive therapy in delaying the progression from microalbuminuria to clinical albuminuria and slowing the decline in glomerular filtration rate (GFR) in patients with albuminuria. In hypertensive and non-hypertensive type 1 diabetic patients, ACE-inhibitors are the initial agents of choice. In hypertensive and non-hypertensive type 2 diabetic patients, ARBs have been shown to reduce the rate of progression of albuminuria and clinical nephropathy and are the initial agents of choice in these patients. Diabetes Care. 2002;25(1):S33
 in patients with albuminuria. In hypertensive and non-hypertensive type 1 diabetic patients, ACE-inhibitors are the initial agents of choice. In hypertensive and non-hypertensive type 2 diabetic patients, ARBs have been shown to reduce the rate of progression of albuminuria and clinical nephropathy and are the initial agents of choice in these patients. Diabetes Care. 2002;25(1):S33.")
113
Strategies for Preventing Complications of Diabetes
Control blood glucose HbA1c below 7% FBS below 110 mg% RBS below 160 mg% Control blood pressure Below 130/80 Control lipids LDL below 100 mg% HDL above 45 for males and 55 for females Triglycerides below 150 mg% Weight loss Stop smoking

114
Summary of Recommendations for Adults With Diabetes
Glycemic Control A1C <7.0%* Preprandial plasma glucose mg/dL ( mmol/L) Postprandial plasma glucose† <180 mg/dL (<10.0 mmol/L) Blood pressure <130/80 mmHg Lipids‡ LDL <100 mg/dL (<2.6 mmol/L) Triglycerides <150 mg/dL (<1.7 mmol/L) HDL >40 mg/dL (1.1 mmol/L)§ *Nondiabetic range of % using DCCT-based assay †PPG made 1-4 h after beginning of meal ‡NCEP/ATP III guidelines: for TG>200 mg/dL, use non-HDL cholesterol = TC-HDL §For women, HDL goal >50 mg/dL Diabetes Care 2004; 27(Suppl1):S15-S35
 Postprandial plasma glucose† <180 mg/dL (<10.0 mmol/L) Blood pressure. <130/80 mmHg. Lipids‡ LDL. <100 mg/dL (<2.6 mmol/L) Triglycerides. <150 mg/dL (<1.7 mmol/L) HDL. >40 mg/dL (1.1 mmol/L)§ *Nondiabetic range of % using DCCT-based assay. †PPG made 1-4 h after beginning of meal. ‡NCEP/ATP III guidelines: for TG>200 mg/dL, use non-HDL cholesterol = TC-HDL. §For women, HDL goal >50 mg/dL. Diabetes Care 2004; 27(Suppl1):S15-S35.")
115
What is the Metabolic Syndrome
A group of metabolic risk factors in one person. Central obesity Atherogenic dyslipidemia - mainly high triglycerides and low HDL cholesterol Insulin resistance or glucose intolerance Prothrombotic state (e.g., high fibrinogen or plasminogen activator inhibitor [–1] in the blood) Raised blood pressure (130/85 mmHg or higher) Proinflammatory state (e.g., elevated high-sensitivity C-reactive protein in the blood)
 Raised blood pressure (130/85 mmHg or higher) Proinflammatory state (e.g., elevated high-sensitivity C-reactive protein in the blood)")
116
(Waist circumference) Women < 50 mg/dL (1.2 mmol/L)
Metabolic Syndrome Clinical Identification - Any 3 of the following Abdominal Obesity Men > 40 inches (>102 cm) Women > 35 inches (>88 cm) (Waist circumference) HIGH Triglycerides ≥ 150 mg/dL (≥ 1.7 mmol/L) LOW HDL-C Men < 40 mg/dL (1.0 mmol/L) Women < 50 mg/dL (1.2 mmol/L) SLIDE 4: NCEP Guidelines, defines metabolic syndrome as 3 out of 5 of the ff parameters (read). Fasting Glucose ≥100 mg/dL ≥ 5.5 mmol/L Hypertension ≥ 130 / ≥ 85 mmHg NCEP-ATP III – JAMA 2001
 Women > 35 inches (>88 cm) (Waist circumference) HIGH Triglycerides. ≥ 150 mg/dL. (≥ 1.7 mmol/L) LOW HDL-C. Men < 40 mg/dL (1.0 mmol/L) Women < 50 mg/dL (1.2 mmol/L) SLIDE 4: NCEP Guidelines, defines metabolic syndrome as 3 out of 5 of the ff parameters (read). Fasting Glucose. ≥100 mg/dL. ≥ 5.5 mmol/L. Hypertension. ≥ 130 / ≥ 85 mmHg. NCEP-ATP III – JAMA")
117
New IDF Definition of Metabolic Syndrome
Waist circumference Plus 2 of the ff: (cm) Europids FBS >5.6 (100mg/dL) >94 male >80 female TRIG >1.7 (150mg/dL) South Asians >90 male HDL < 0.9 (<40mg/dL) M >80 female <1.1 (<50mg/dL) F Chinese >90 male BP >130 systolic >80 female >85 diastolic Japanese >85 male >90 female
 Europids FBS >5.6 (100mg/dL) >94 male. >80 female TRIG >1.7 (150mg/dL) South Asians. >90 male HDL < 0.9 (<40mg/dL) M. >80 female <1.1 (<50mg/dL) F. Chinese. >90 male BP >130 systolic. >80 female >85 diastolic. Japanese. >85 male. >90 female.")
118
Risk Factors Among Filipinos
Prevalence (%) Low HDL Obesity (BMI>30) Obesity (WHR 1/0.85) Smoking Hypertriglyceridemia Hypertension DM * * 4** ** 6.6 *** Metabolic Syndrome (NCEP) *FBS > 125 mg/dL ** FBS or history *** FBS ≥101 mg/dL Morales D et al. for the NNHeS Group. PSH-PLS Convention. Feb 2005. Sy R et al. PJIM. 2003; 41: 1.-6.
 Low HDL Obesity (BMI>30) Obesity (WHR 1/0.85) Smoking Hypertriglyceridemia Hypertension DM 3.9* 3.4* 4** 4.6** 6.6 *** Metabolic Syndrome (NCEP) *FBS > 125 mg/dL ** FBS or history *** FBS ≥101 mg/dL. Morales D et al. for the NNHeS Group. PSH-PLS Convention. Feb Sy R et al. PJIM. 2003; 41:")
119
Risk Factors for Metabolic Syndrome
genetic predisposition excess body fat (abdominal obesity) sedentary lifestyle physical inactivity Ford ES et al. JAMA. 2002; 287:
 sedentary lifestyle. physical inactivity. Ford ES et al. JAMA. 2002; 287:")
120
While the pathogenesis of the metabolic syndrome and each of its components is complex and not well understood, central obesity and insulin resistance are acknowledged as important causative factors.

121
IDF Consensus 2004 Recommendations for Treatment
Primary Intervention IDF recommends that primary management for the MS is healthy lifestyle promotion. This includes : * moderate calorie restriction ( to achieve a 5-10% loss of BW in the 1st year ) * moderate increase in physical activity * change in dietary composition
 * moderate increase in physical activity. * change in dietary composition.")
122
IDF Consensus 2004 Recommendations for Treatment
Secondary intervention * In people for whom lifestyle change is not enough and who are considered to be at high risk for CVD, drug therapy may be required to treat the metabolic syndrome. * However, specific pharmacological agents are not yet available. * It is currently necessary instead to treat the individual components of the metabolic syndrome.

123
Atherogenic dyslipidemia Primary aims for therapy :
IDF recommended treatment of the individual components of the metabolic syndrome. Atherogenic dyslipidemia Primary aims for therapy : * Lower Tg * Raise HDL * Reduce LDL Options : * Fibrates * Statins

124
Elevated blood pressure
IDF recommended treatment of the individual components of the metabolic syndrome. Elevated blood pressure In patients with established diabetes, anti-HPN therapy should be introduced at BP ≥130/≥80 mmHg. Options : * ACEI and ARB. Effect of lowering of BP per se more important than the drug itself? * No particular agents have been identified as being preferable for HPN patients with MS.

125
Insulin resistance and hyperglycemia
IDF recommended treatment of the individual components of the metabolic syndrome. Insulin resistance and hyperglycemia There is growing interest in the possibility that drugs that reduce IR will delay the onset of type 2 DM and will reduce the CVD risk when the MS is present.

126
Cardiovascular Risk Factors and Therapies
↑ LDL cholesterol ↓ HDL cholesterol ↑ Triglycerides ↑ Blood Pressure ↑ Blood Glucose ↑ Waist Circumference ↓ Insulin Sensitivity ↑ Thrombotic risk Lipid Modifiers NCEP-ATP III / IDF criteria for the metabolic syndrome Anti-hypertensives Anti-diabetic agents Weight Loss Agents + Diet and exercise Insulin sensitizers Anti-platelet agents

128
Thank you

Similar presentations
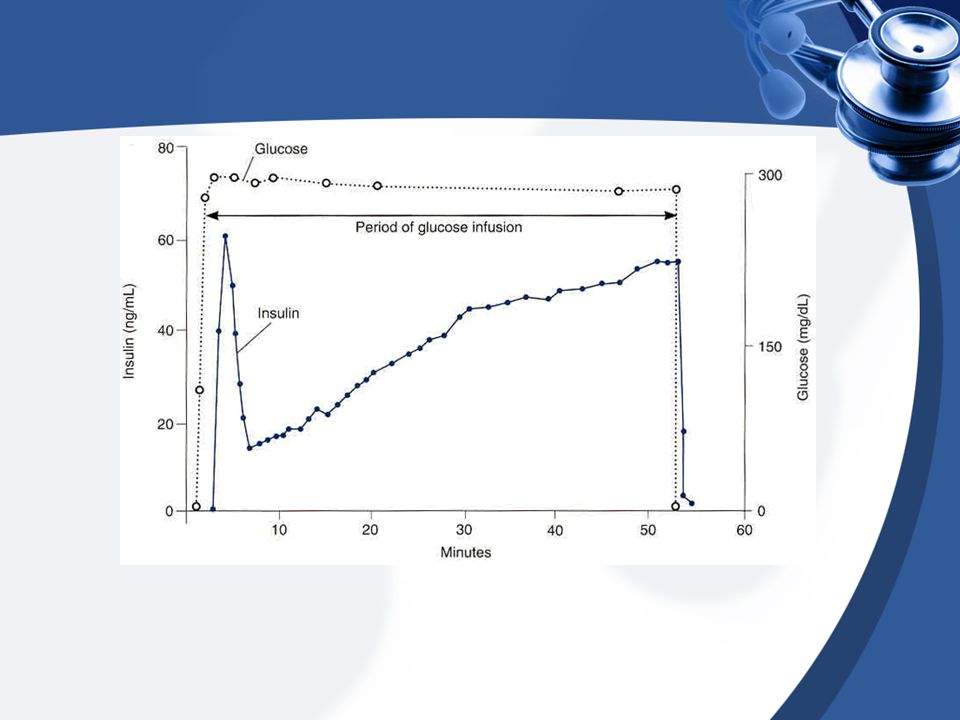
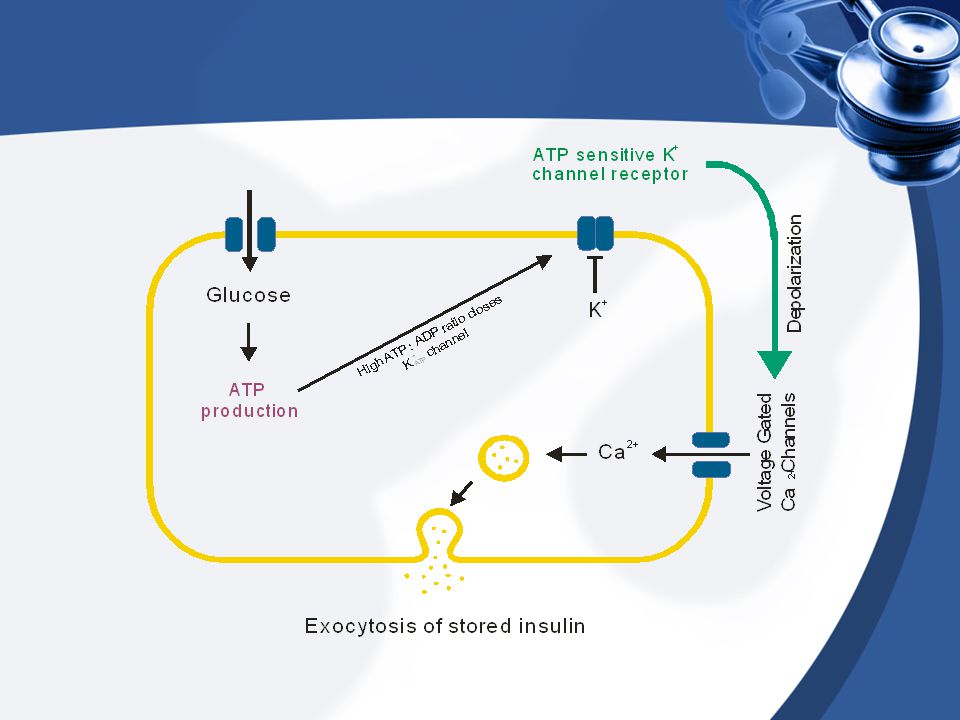

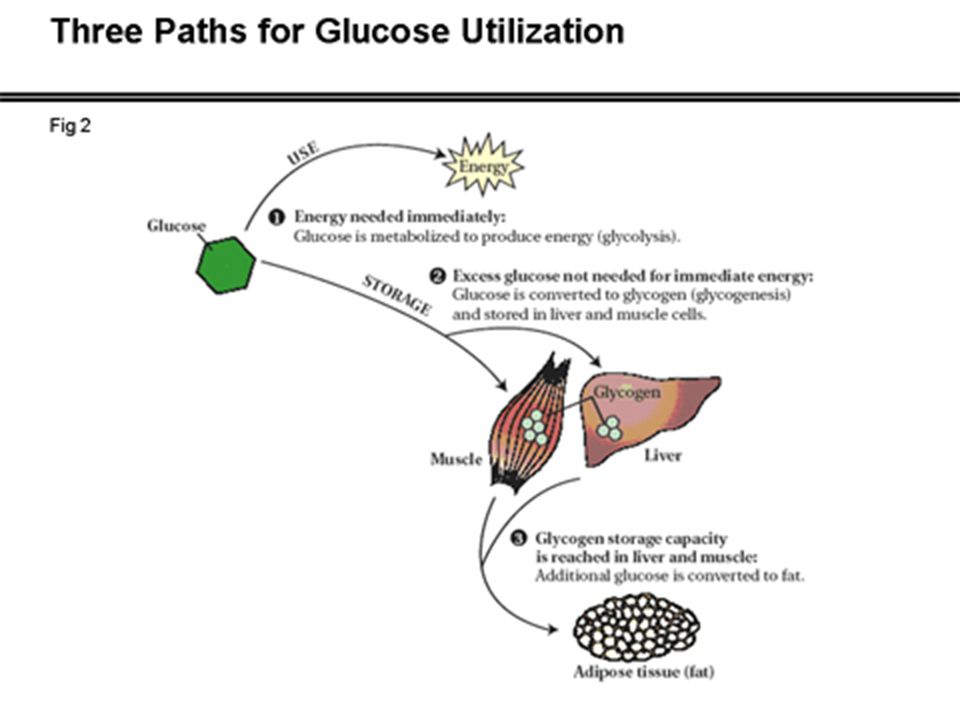
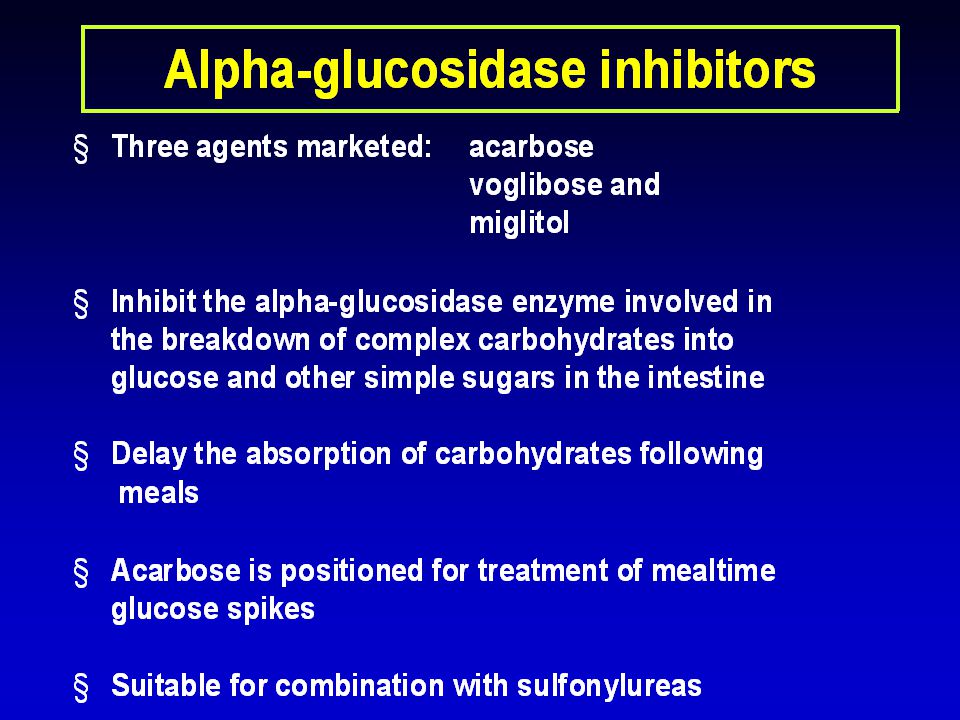
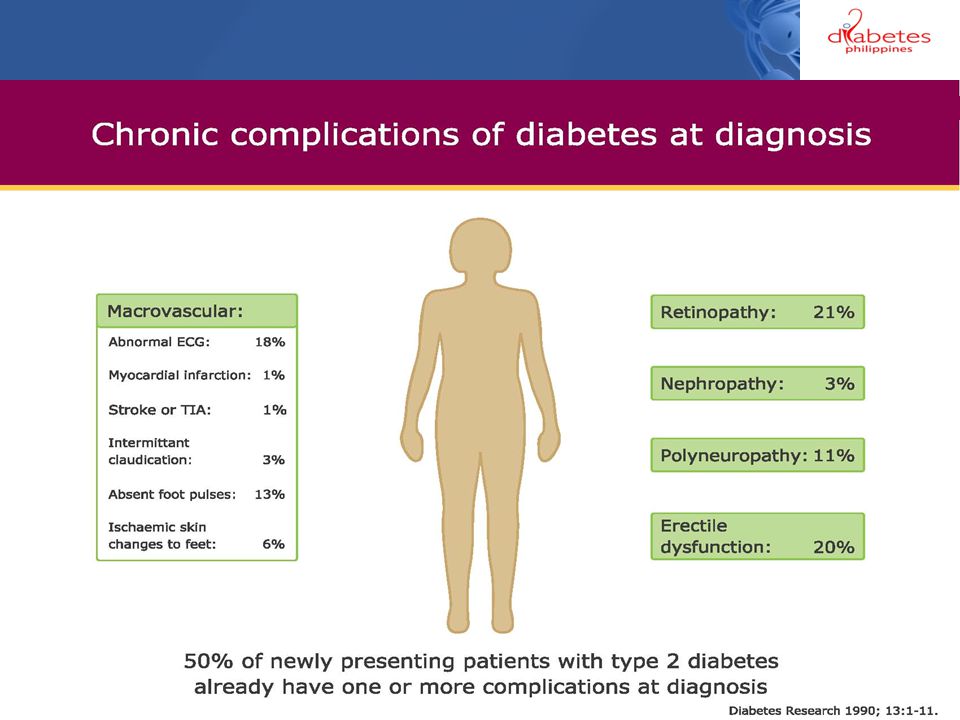


![Islets of Langerhan. Prof. K. Sivapalan. 08-01-14Islets of Langerhan2 Histology. A cells 20 % [glucogon] B cells 50% [Insulin] D cells 8% [somatostatin]](/15/4663650/big_thumb.jpg "Islets of Langerhan. Prof. K. Sivapalan. 08-01-14Islets of Langerhan2 Histology. A cells 20 % [glucogon] B cells 50% [Insulin] D cells 8% [somatostatin]>")


 muscle proteins liver glycogen fat lipids glucose.>")

 muscle proteins liver glycogen fat lipids glucose.>")


