Download presentation
Presentation is loading. Please wait.

1
The number of organisms per unit area
Population Density The number of organisms per unit area

2
Which has a higher population size?
United States New York City 0 of 5

3
Which has a higher population density?
United States New York City 0 of 5

4
3 Types of Dispersion Draw Each Uniform Clumped Random

5
3 Types of Dispersion 1) Uniform 2) Clumped 3) Random
Ex: ______ __________ ________

6
Type of dispersion: White-Tailed Deer
Uniform Clumped Random 0 of 5

7
Type of dispersion: Black Bear
Uniform Clumped Random 0 of 5

8
Type of dispersion: Bison
Uniform Clumped Random 0 of 5

9
Type of dispersion: Mountain Lion
Uniform Clumped Random 0 of 5

10
Type of dispersion: Seeds dispersed by wind
Uniform Clumped Random 0 of 5

11
Type of dispersion: Caribou
Uniform Clumped Random 0 of 5

12
Limiting Factors Items that influence population growth “Limit” growth

13
1. Density-dependent limiting factors
“Depends” on “density” a) Affect large, dense populations more than smaller, less- crowded populations
 Affect large, dense populations more than smaller, less- crowded populations.")
14
Density-dependent limiting factors
Predation: Fig. 5-7 Wolves & Moose on Isle Royale

15
Predator - Prey

16
Which increases first? Predator Prey 0 of 5

18
Density-dependent limiting factors
ii. Disease & Parasites: Easily spread in large, dense populations

19
Density-dependent limiting factors
iii. Competition: Fig Compete for available resources Food, water, space

20
iv. Crowding & Stress: The higher population density, the more crowding and stress on individual organisms

21
2. Density-independent factors
The density of the population DOES NOT MATTER It doesn’t matter if the population is 5 or 5,000, they will be affected

22
Density-independent factors
Hot/Cold Weather Fires Floods/Hurricanes/Tornadoes Human Activities – toxic waste spills, pesticides, deforestation

23
Population Growth Rate
How fast a population grows It depends on 4 major factors

24
Population Growth Rate
a) Natality = birthrate “neonatal intensive care” – newborns/preemies b) Mortality = death rate
 Natality = birthrate. neonatal intensive care – newborns/preemies. b) Mortality = death rate.")
25
Population Growth Rate
c) Emigration – “exit” or leaving population d) Immigration – “in” or moving into a population
 Emigration – exit or leaving population. d) Immigration – in or moving into a population.")
26
Population Growth Rate
Natality – Mortality + Immigration - Emigration

27
If natality is 10, mortality is 6, immigration is 3, and emigration is 2……the net effect on the population is… + 21 - 3 + 3 + 5 0 of 5

28
If the original population consisted of 10 individuals, what is the new population size?
20 15 5 0 of 5

29
If birth rate > death rate
The population will increase The population will stay the same The population will decrease 0 of 5

30
If birth rate < death rate
The population will increase The population will stay the same The population will decrease 0 of 5

31
1. Exponential Growth (J–shaped Curve)
If ideal conditions continue, the population will continue to grow rapidly Doubling and re-doubling 1, 2, 3, 8, 16, 32, 64, 128…….. Does NOT last long in nature – WHY?

32
Exponential Growth (J–shaped curve)
d) This is current human population growth worldwide How long can it last? Discuss
 This is current human population growth worldwide. How long can it last Discuss.")
33
Exponential Growth e) Draw graph
 Draw graph")
34
2. Boom and Bust As ideal conditions continue, population grows exponentially until it reaches a “peak” size (boom) and then crashes (bust) Ex: Rabbit population

35
Boom and Bust c) Draw graphs
 Draw graphs")
36
Yeast Population Growth

38
3. Logistic Growth (S-shaped curve)
a) Exponential growth at first, eventually the population size levels off as the growth rate slows down b) Carrying capacity: Largest number of individuals that the environment can support
 Exponential growth at first, eventually the population size levels off as the growth rate slows down b) Carrying capacity: Largest number of individuals that the environment can support")
39
Logistic Growth c) Draw graph
 Draw graph")
40
Logistic Growth (S-shaped curve)
d) Things that prevent the population from getting too big: Lack of food or water Home/shelter availability
 Things that prevent the population from getting too big: Lack of food or water. Home/shelter availability.")
41
Which of the following are NOT true about exponential growth?
It occurs at the beginning of logistic growth curves It shows an S-shaped growth curve It occurs only if ideal conditions exist Populations have unlimited resources 0 of 5

42
Reproductive Patterns
r-strategy: rate strategy Generally are small Short life spans Produce many offspring rat, fruit fly, locusts

43
Reproductive Patterns
k-strategy: carrying capacity strategy Larger organisms, long life span Produces few offspring –better chance of survival Take care of the offspring, usually for a long time Kangaroo, elephant

44
Reproductive Pattern: Rabbits & Dolphins
Both r-strategists Both k-strategists r-strategist & k-strategist k-strategist & r-strategist 0 of 5

45
Demography The study of human population size, density, distribution, movement, and birth and death rates

46
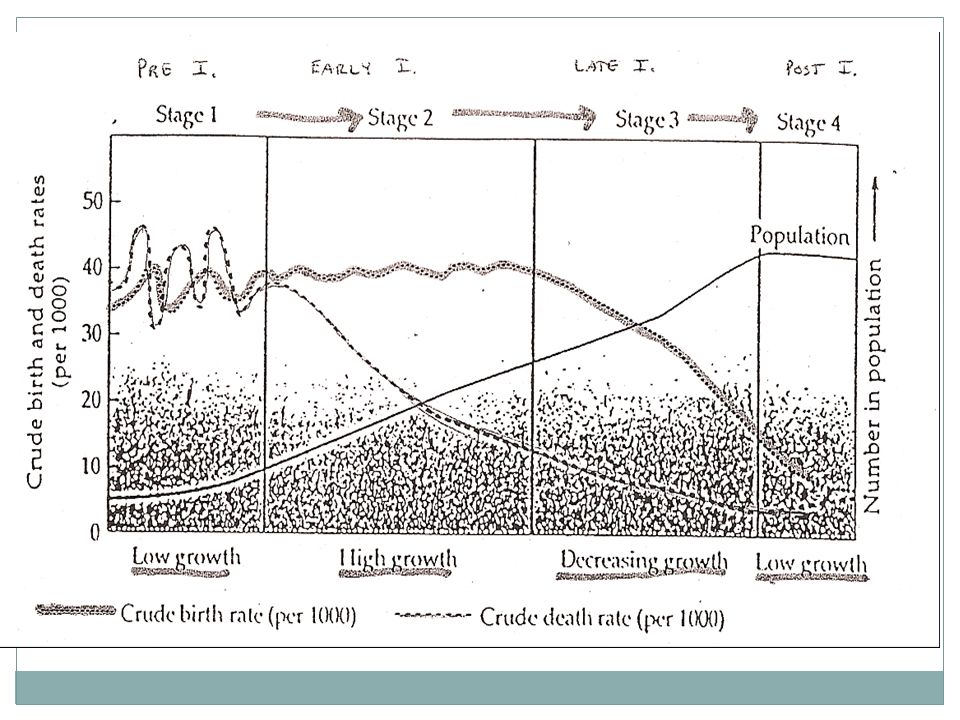
Demographic Transition
A change in a population from high birth and death rates to low birth and death rates

48
Demographic Transition
Stage 1: birth rate & death rate Stage 2: birth rate & death rate Stage 3: birth rate & death rate Stage 4: birth rate & death rate Discuss & answer questions on Notes handout

49
Zero Population Growth
Birth rate = Death rate

50
Age-Structure Diagram
# of males & females in 3 age groups: Pre-reproductive stage Reproductive stage Post-reproductive stage

52
Age-Structure Diagrams
Fig – predict future population sizes… Pyramid shaped (pre-reproductive larger) Every age group about the same Smaller at the bottom (pre-reproductive #’s smaller)
 Every age group about the same Smaller at the bottom. (pre-reproductive #’s smaller) ")
53
Population will increase Population will stay the same
Predict future population sizes: Pyramid shaped (pre-reproductive larger) Population will increase Population will stay the same Population will decrease 0 of 5
 Population will increase. Population will stay the same. Population will decrease. 0 of 5.")
54
Predict future population sizes: Every age group about the same size
Population will increase Population will stay the same Population will decrease 0 of 5

55
Population will increase Population will stay the same
Predict future population sizes: Smaller at the bottom (pre-reproductive smaller) Population will increase Population will stay the same Population will decrease 0 of 5
 Population will increase. Population will stay the same. Population will decrease. 0 of 5.")
57
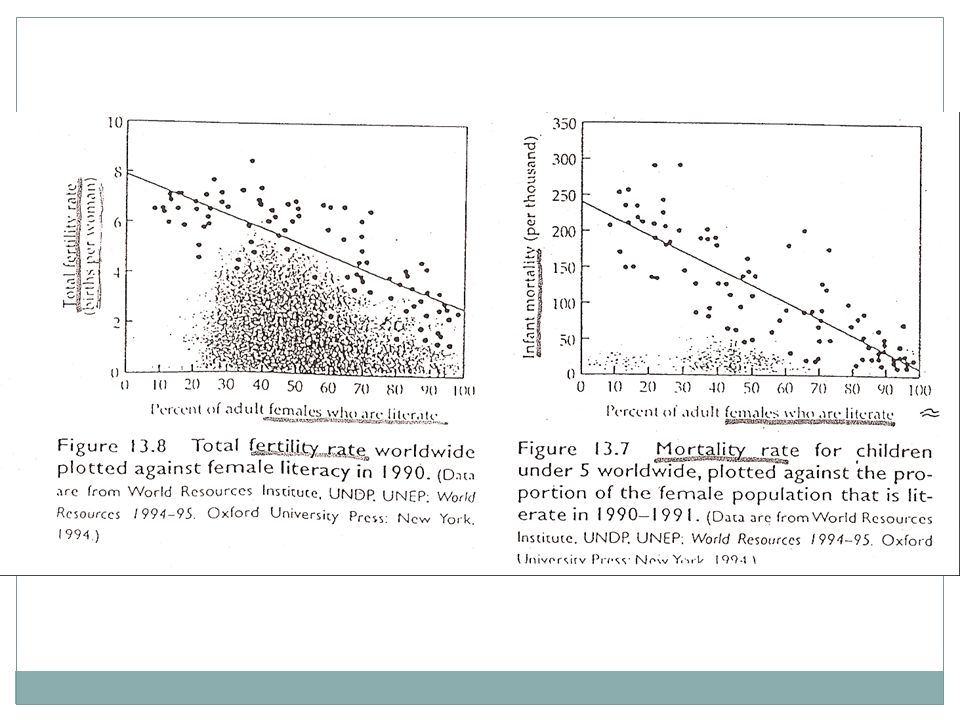
Education & Demographic Transition
What does the first graph tell us? What does the second graph tell us? What is a key factor in reducing the overall worldwide population growth?

Similar presentations