Download presentation
Presentation is loading. Please wait.

1
Teachers use of data to support student learning
Patrick Griffin Assessment Research Centre Melbourne Graduate School of Education

2
Agenda for the session Time Focus 9.00 The team approach to the use of data 9.15 Teacher collaboration 9.30 Use of data 9.45 Team leadership 10.15 Changing the culture 10.45 Morning Tea 11.10 Scaling up and sustainability 12.30 Plenary - questions and comments

3
The aetiology of a team approach
CEO(M) review of tests Review of test data Linking tests to a common empirical continuum Use an existing PLT structure in 20 schools The importance of team leadership Focus on intervention and data Observation and documentation of what worked Situating in theory Rasch, Vygotsky and Glaser Tiered accountability Evidence not inference Challenge not share
 review of tests. Review of test data. Linking tests to a common empirical continuum. Use an existing PLT structure in 20 schools. The importance of team leadership. Focus on intervention and data. Observation and documentation of what worked. Situating in theory. Rasch, Vygotsky and Glaser. Tiered accountability. Evidence not inference. Challenge not share.")
4
Progressive achievement
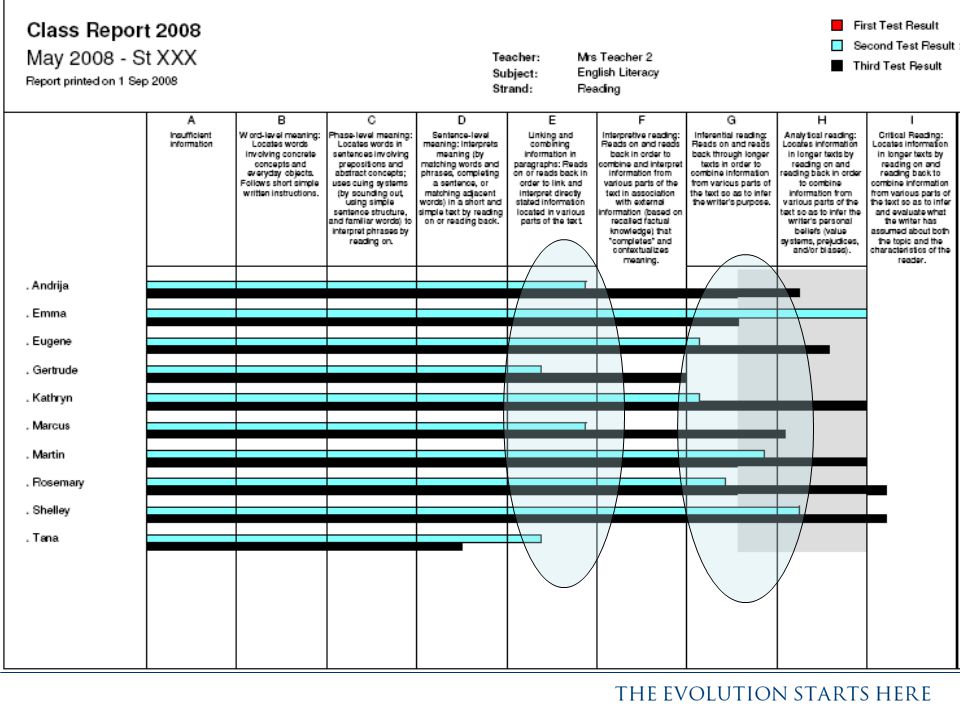
School level data showed growth but this was not surprising given the effects of maturation and normal expected progress of students. Example of typical school’s data -The horizontal axis represents the eight levels in the reading comprehension scale. The vertical axis represents the percentage of students at each level. The two superimposed bar charts represent the assessments at October in each of 2005 and The shift to the right is interpreted as growth. Was it just maturation? It might be, but if it was, it was astonishing and uniform maturation across the 19 schools. Based on large scale studies using item response analyses there is solid evidence of a substantial shift in reading comprehension development. In national, state and international studies the general gain per year level is one half logit per school year. This includes general gains on the AIM test used in this project when it is used in a state level cohort testing. The average gain per school in this study was approximately 1 to 1.5 levels or 1.5 logits – three times the normal expected gain. But the average gain is not the only way to describe the shift. Consider the lowest group. They have moved upwards by 2 levels – four times the expected growth! Less growth is evident at the upper levels, but this could be because of the limits of the measurement instruments. In any pre-test post-test design, as used in this program, students who are lower initial performers will appear to grow or improve more than those students at higher initial performance levels. This effect, known as “regression-to-the-mean”, will occur irrespective of any intervention. So while the gains in the lower levels are impressive, some might be attributed to maturation, some to regression and some to practice effect due to the retesting procedures. 4

5
Progressive achievement
School B: Three testing periods October - ,March - and October Another analysis of student data over three testing periods indicated that students had made progress as measured across the developmental progression. Not only had the cohort moved up the scale but that the spread had not increased. This suggested that that all students were developing and that the ‘tail’ of the distribution was not being left behind or remaining static. It was also clear that a year’s expected gain (about one half a logit) was exceeded many times over by groups, but there were also individual students who appeared to regress. Teachers set about specific intervention with those individuals but always emphasised the readiness issue in determining the what and how of teaching and learning. This investigation is on going. 5
 was exceeded many times over by groups, but there were also individual students who appeared to regress. Teachers set about specific intervention with those individuals but always emphasised the readiness issue in determining the what and how of teaching and learning. This investigation is on going. 5.")
8
Teachers using data make better decisions
What did we learn? Student outcomes are a function of teacher attitudes, skills and knowledge!!!! Teachers using data make better decisions Teachers collaborating are more effective than working solo!!! Structured approaches to collaboration are more effective than ad hoc approaches!!! Schools providing support and infrastructure are more effective!!! Leadership needs to be strong and focused on learning outcomes. Differentiated and targeted instruction is more effective than whole class teaching!!

9
Truisms are true!!!!!

10
How did we use what le learned?

11
Linking assessments to developmental learning Reading and Number
The assessments Linking assessments to developmental learning Reading and Number SWANS instruments social skills emotional self-management and cognitive development, communication and literacy Monitoring and promoting student development

12
Teacher Collaboration
12

13
The Professional Learning Team
Team composition Team Leader Assessment instrument selection Peer accountability Frequency and length of meetings

14
Team Procedures

15
Monitoring and accountability
Team Procedures Meetings? Time Funding Leadership Size Structure Monitoring and accountability

16
Team log records and accountability
Student Code: ……………………… Level: ………………………. Review date: ……………….. Is the student’s level what was expected? What makes you say that? What goals are set for this student’s learning? What teaching strategies could be used to achieve the goals? What resources are needed? What evidence would show the goals are met? Where is s/he? Where does he/she need to go next? (progress/ consolidate? How will s/he get there? How will we know? What are the implications across the curriculum?

17
Ticking the effective team boxes
TEAMS

18
What might be the implications for your network schools?
Discussion What might be the implications for your network schools? How might teams be structured in your network schools? Who are the first contact points – how would it be initiated?

19
Using data 19

20
Harvard approach for school leadership
Data wise

21
Available assessment tools
PROGRESS tests - mainstream VCAA Reading and Number – VELS 2 to 5 Student completion ~ 60 mins Twice a year to monitor growth SWANS schedules for students not able to respond to Progress Tests Emotional and Cognitive, Interpersonal, - Communication and Literacy Teacher completion online Need to monitor teacher activities (LDF, e5? and PLT logs, PND?)
")
22
Monitoring with the Progress Tests for teachers

23
Test selection: Progress Tests
Progress Test VELS 4.5 – 5.0 Progress Test VELS 4.0 – 4.5 Progress Test VELS 3.5 – 4.0 Progress Test VELS 3.0 – 3.5 Progress Test VELS 2.5 – 3.0 Progress Test VELS 2.0 – 2.5 1 2 2 1 SWANS

24
Monitoring Comprehension Development Progress tests

25
Close up

26
Pathways and levels SWANS

27
Swans close up

29
Professional Learning Team log
Student Code: ……………………… Level: ………………………. Review date: ……………….. Is the student’s level what was expected? What makes you say that? What goals are set for this student’s learning? What teaching strategies could be used to achieve the goals? What resources are needed? What evidence would show the goals are met? Where is s/he? Where does he/she need to go next? (progress/ consolidate? How will s/he get there? How will we know? What are the implications across the curriculum?

30
How to improve teachers’ capacity to use data?
Developmental models emphasise all students’ growth? Developing collaborative decision making? Professional development of the team members?

31
Team Leadership 31

32
Data wise - Harvard

33
The analysis and interpretation cycle
We can envisage the process as a cycle. At each of the meetings of the team leaders our first task will always be a focus on the overall project and the data in its aggregate form. Our research team will report on analyses and interpretations in each of the three domains and illustrate how the instruments are performing and how each developmental progression can be interpreted. Each team leader will be asked to report on their team progress and procedures from the previous period of time between professional learning team meetings. This will be an important sharing process in which we will learn a great deal from the good work of the team leaders and the way in which they have helped the PLT members understand the data and use it to benefit the pupils. At this point we will need to ask each other why certain things were done and what was our evidence that we used to justify the procedure. Our whole approach is one that must be evidence based and we will emphasise that in the leaders meetings to create the expectation that the leaders will replicate this in the schools within the PLTs After we examine the aggregate data and we hear from the schools we’ll will distribute the software and examine the way in which the data has developed and captured the progress and gains, or losses, of individual pupils. We will have a look at a mockup of this sort of procedure during this workshop. In our team meetings the leaders will mostly form working groups. Members of the groups will discuss and interpret their school and individual pupil data in such a way that we will begin the initial sharing of potential strategies and learning possibilities for each pupil recorded in the data. This discussion should develop over time into a very sophisticated discussion of teaching and learning resource allocation and goal setting for pupils depicted in the data. The implications of the data and the position of pupils on the developmental continuum should provide a great deal of information for planning new approaches to teaching and learning. It should also enable team leaders working with their peers to plan their professional learning team meeting that will follow the presentation and interpretation of data. This will be an important planning session to form the basis of discussion of what they are about to do back in school and to make notes of this intention. We will provide record sheets for this discussion so that there is a record of the interpretation and planning that is intended for the professional learning team meetings. When the team leader returns to school they will need to organise their professional learning team meeting following an agenda that they have discussed with their peers. Their team will review the software, the data, and discuss amongst themselves the potential interpretation using the range of graphs and charts and ready reckoners. The discussion in the PLT should also develop over time into a sophisticated examination of data and the link between the data and the teaching and learning interventions. One of the roles of the team leaders will be to guide the development of the discussion and to assist in steering the discussion to put a link between evidence and decision-making. During this project our research team will make no attempt to discuss how the children should be taught. We will not make recommendations about specific teaching strategies nor will we give advice about appropriate resources or time that might be devoted to specific cases. Our task is to steer the discussion to the link between data used as evidence and decision-making in terms of learning and teaching. We will focus only on the use of data to inform decision-making. At all times we regard the team leaders as the experts and the professional learning team members as the professional practitioners. We do not make any claims in that area at all. We do expect the team leader to prepare a report on the conduct of the professional learning team meetings and the decisions and resources that were recommended as a result of the examination of the data. This will certainly become the generic and powerful evidence-based decision-making that can be disseminated particularly when these data are linked to successful growth amongst the pupils.

34
Expectations of the PLT members

35
Expectations

36
Expectations

37
Expectations

38
Expectations

39
Why do we need to work in teams?
39

40
Working in teams to link teaching and learning
40

41
Changing the way we think about students
41

42
Learning how to use assessment data
42

43
Drawing on the support of a team
43

44
The model 44

45
Promote a focus on teaching and learning Communication
The team leader’s role Promote a focus on teaching and learning Communication Focus on evidence not inference. Link data to developmental learning. Accountability to school leadership Accountability to other team leaders. Professional development of team members Replace sharing with challenge Changing the culture

46
How would be the criteria for their selection?
Discussion Who can be the leaders? How would be the criteria for their selection? What are the prior conditions for successful leadership? What support would the leaders need? What infrastructure is needed in the school?

47
Changing the culture 47

48
Team differences The data collection can take place in a number of ways. The ideal procedure would be for each pupil to be discussed in turn by all members of the professional learning team. The least ideal is for each teacher to work solo and complete each questionnaire on each of the pupil without any discussion amongst their colleagues. They would both take time and the solo activity possibly takes less coordination and leadership by the team leader. In between these two extremes there are modifications that may provide greater of the quality that we seek. The team leader will need to provide advice to the project team regarding the manner in which the instruments were completed, while we cant control this process, and we are aware of the time demands, we will want to know what process was used. Its an important data quality check.

49
Tiered Peer Accountability “My class” to “our students”
PLT focus Tiered Peer Accountability “My class” to “our students” Collaboration and joint ownership Evidence not inference Set expectations for all students Development not deficit models Teach to the construct not the test Challenge - not share

50
Assessment is for teaching Evidence not inference
mantras Do say make write Assessment is for teaching Evidence not inference Formal and informal assessments Talk about students – not teachers Challenge and defend not share

51
Evidence and Bloom’s taxonomy
Know defines; describes; enumerates; identifies; labels; lists; matches; names; reads; records; reproduces; selects; states; views Understand classifies; cites; converts; describes; discusses; estimates; explains; generalizes; gives examples; makes sense out of; paraphrases; restates (in own words); summarizes; traces; understands Apply acts; administers; articulates; assesses; charts; collects; computes; constructs; contributes; controls; determines; develops; discovers; establishes; extends; implements; includes; informs; instructs; operationalises; participates; predicts; prepares; preserves; produces; projects; provides; relates; reports; shows; solves; teaches; transfers; uses; utilizes Analyse breaks down; correlates; diagrams; differentiates; discriminates; distinguishes; focuses; illustrates; infers; limits; outlines; points out; prioritizes; recognizes; separates; subdivides Evaluate appraises; compares & contrasts; concludes; criticizes; critiques; decides; defends; interprets; judges; justifies; reframes; supports Create adapts; anticipates; categorizes; collaborates; combines; communicates; compares; compiles; composes; contrasts; creates; designs; devises; expresses; facilitates; formulates; generates; incorporates; individualizes; initiates; integrates; intervenes; models; modifies; negotiates; plans; progresses; rearranges; reconstructs; reinforces; reorganizes; revises; structures; substitutes; validates.
; summarizes; traces; understands. Apply. acts; administers; articulates; assesses; charts; collects; computes; constructs; contributes; controls; determines; develops; discovers; establishes; extends; implements; includes; informs; instructs; operationalises; participates; predicts; prepares; preserves; produces; projects; provides; relates; reports; shows; solves; teaches; transfers; uses; utilizes. Analyse. breaks down; correlates; diagrams; differentiates; discriminates; distinguishes; focuses; illustrates; infers; limits; outlines; points out; prioritizes; recognizes; separates; subdivides. Evaluate. appraises; compares & contrasts; concludes; criticizes; critiques; decides; defends; interprets; judges; justifies; reframes; supports. Create. adapts; anticipates; categorizes; collaborates; combines; communicates; compares; compiles; composes; contrasts; creates; designs; devises; expresses; facilitates; formulates; generates; incorporates; individualizes; initiates; integrates; intervenes; models; modifies; negotiates; plans; progresses; rearranges; reconstructs; reinforces; reorganizes; revises; structures; substitutes; validates.")
52
Affective Domain

53
Purpose of the assessment
To inform teaching… identifying the level of student development - To promote student development establish baseline measures against which to evaluate change over time Explain process of how individual forms of the Progress Tests are scored in order to identify difficulty levels of items; that items are then (back) analysed / subjected to a skills audit in order to identify bundles of items that appear to sample specific skills; that these bundles are then arranged along a continuum that demonstrates a growing sophistication in terms of the skills set; and that students’ scores are then plotted along this continuum to show each student’s zone of proximal development.
 analysed / subjected to a skills audit in order to identify bundles of items that appear to sample specific skills; that these bundles are then arranged along a continuum that demonstrates a growing sophistication in terms of the skills set; and that students’ scores are then plotted along this continuum to show each student’s zone of proximal development.")
54
Changing the culture What needs to be done? How- and by whom?

55
Sustainability 55

56
SUSTAINABILITY Contact from the network at the start of each year re plans for involvement Professional reading and research updates prompted by team leader Efficient online assessment, analysis and reporting systems Revisit the developmental progressions to check currency and validity Updates on work in other schools and networks Data and intervention discussions at start each year Formalise the assessment schedule for two data collections per year Avoid ‘watering down’ the process Document PLT procedures Access to Web site for information - ‘Ultranet’ Publish the list of schools involved with their contact details List the experienced PLT leaders Maintain the action research led by PLT members and leaders Emphasise focused and targeted teaching Maintain leaders network meetings

57
SUCCESSION PLANNING Network with experienced PLT leaders Maintain the action research records across schools Emphasise focused teaching in PLT meetings Decide on the network PLT leaders group – regular per term? Who to convene? funding? Have a deputy or proxy at cross school meetings for succession planning Project folder on the server at school with up to date information and materials Ensure that project materials are available as a resource bank (Ultranet?) Have a network induction plan for new leaders Find ways of developing PLT procedure skills at a school level
 Have a network induction plan for new leaders. Find ways of developing PLT procedure skills at a school level.")
58
Maintain contact across schools
NETWORKING Maintain contact across schools Regular and scheduled team leaders meetings as part of the school’s PD program Maintain contact with experienced team leaders Meeting of the leaders group – regular per term? Who to convene? funding? Structure Leaders meetings with peer reporting duties Formalise partnerships and links across schools Cross school reporting on strategies and resources

59
Dependence on team leaders
The weaknesses Dependence on team leaders Focus on data only and ignoring intervention Lack of accountability within and between teams Teaching to the test Need for whole of school support

60
Sustaining change

61
For any project how many of these characters are in place?
Sustainability For any project how many of these characters are in place? What causes initiatives to fall away and decline?

62
Scaling up 62

63
Scaling up in the Wellington Network

64
Involvement

65
Involvement

66
Involvement

67
Involvement

68
Involvement Making Time, Improving access to data
Supporting the work and promoting collaboration Leadership Team , External specialists

69
Systemic support Targeted Professional development
E5 and its applications within teams Leadership Development framework P&D framework The Ultranet as a resource Online reporting and analysis Coaches Teaching and learning Literacy Numeracy Ultranet Net books and it initiatives for the students SSSP for the SWANS materials Regeneration School and community partnerships Earned autonomy Role for the Institute of Educational leadership for team leaders

70
Action How can these infrastructure elements be used to improve data driven, evidence – based teaching and learning decisions? What is in place to support data driven learning and teaching in your network? What support is needed?

71
Action plan 71

72
Identify the Team leader Form the teams IT administrator
Timeline immediate Identify the Team leader Form the teams IT administrator Check that On Demand Testing is set up and teachers know how to use it School Administration Allow for time and leadership Admin staff need to know what is happening Coordinators and information networks in the school

73
Timeline Testing Period – Two week period Students sit VCAA Progress tests Teachers complete SWANS online School IT Administrator to upload results After a further two weeks Print reports for Team Leader Meeting Team Leader Meeting Ongoing At end of testing period upload the analyse Discuss at the PLT meeting Team leader to document and defend decisions for Leaders’ meeting Online support

74
The model 74

Similar presentations


 and Instructional/Assessment Strategies Purpose: The intended.>")


