Download presentation
Presentation is loading. Please wait.

1
Waterborne Pathogens and State-of-art Detection Methods
Dr Bharat Patel, Associate Professor in Molecular Microbiology & Director, Clinical Microbiology PG Program, School of Biomolecular & Biomedical Sciences, Griffith University, Brisbane Australia Firstly, I would like to welcome all of you to the workshop on “Waterborne pathogens and state-of-the-art detection methods” which will be presented by myself and Dr Wen-Tso Liu. I hope that will find the 2 day workshop an enjoyable learning event. I also hope that you will participate in this workshop with questions, comments and suggestions and make the workshop into a learning forum for both, you as attendees and us as speakers. Your participation will make this workshop less formal and make it more encompassing. What I would like to do is give you a brief introduction by the speakers, that is, myself and Dr Wen-Tso. I hope that we can follow this by brief introductions by all of you.

2
Indicators of Water Pollution
Section I. Indicators of Water Pollution

3
CONTENT The Australian Cooperative Research Centres (CRC) 1.1 Concept 1.2 The FiveWater Related CRC 1.3 CRC Water Quality & Treatment 2. Introduction 2.1 Microbes on our planet & their role 2.2 Water as an environment 2.3 Microbes & their role in water 2.4 Why monitor water supplies? 2.5 Ensuring the safety of drinking water. 3. Bacterial Indicators of Pollution 3.1 What are Bacterial indicators of pollution 3.2 Total coliforms 3.3 Changes in coliform definitions 4. Alternatives to Total Coliforms

4
Risk Assessment Analysis Framework and Pathogens
Section II. Risk Assessment Analysis Framework and Pathogens

5
2.The current list of pathogens
CONTENT 1. Epidemiological data on some pathogens. 2.The current list of pathogens 3.How to monitor and assess the risk of pathogens?

6
SECTION III. Molecular Biology Databases and Tools

7
Molecular Biology Bioinformatics Databases Online tools
CONTENT Molecular Biology Bioinformatics Databases Online tools

8
SECTION IV. The Biology, Methods for Detection, Identification & Quantitation of Water-borne Pathogens

9
1. The Biomolecules & Molecular Biology of Cells
CONTENT 1. The Biomolecules & Molecular Biology of Cells 2. Biomolecule Based Technics 3. The Biology & Detection Methods of Some Pathogens 4. Modern Techologies a. Polymerase Chain Reaction (PCR) b. Real Time PCR c. Pulse Field Gel Electrophoresis d. New High Throughput Methods
 b. Real Time PCR. c. Pulse Field Gel Electrophoresis. d. New High Throughput Methods.")
10
Indicators of Water Pollution
Section I. Indicators of Water Pollution

11
1. The Australian Cooperative Research Centres (CRC)
")
12
1.1 The Concept of Cooperative Research Centres (CRC) in Australia
Participation by industry, universities, CSIRO and State Government bodies $1 (in cash / in kind contributions) : $1 (cash from Fedral Government Commercial focus Skill acquisition and training for the industry. Usually run by an independent board 65 CRCs currently on the books ($320 million pa from participants to $140 million pa cash from Fedral Government). CRCs may have synergies: CRC Water Quality & Treatment CRC Freshwater ecology CRC Microelectronic engineering CRC Wastewater Treatment
 : $1 (cash from Fedral Government. Commercial focus. Skill acquisition and training for the industry. Usually run by an independent board. 65 CRCs currently on the books ($320 million pa from participants to $140 million pa cash from Fedral Government). CRCs may have synergies: CRC Water Quality. & Treatment. CRC Freshwater. ecology. CRC Microelectronic. engineering. CRC Wastewater. Treatment.")
13
1.2 The Five Water Related CRCs
CRC for Catchment Hydrology CRC for Waste Management and Pollution Control CRC for Freshwater Ecology CRC for Water Quality And treatment CRC for Coastal Zone, Estuaries and Waterway Management

14
1.3 The Cooperative Research Centre for Water Quality & Treatment
2nd Round of Funding: Participants: 12 Research organisations (8 Universities), 16 Industry & 8 Associate partners Key Objectives: create a centre of excellence with the capability of pursuing world class research and training. ensure that participants with their differing disciplines and backgrounds will interact effectively to optimise research outcomes. increase the human skills base of the water supply industry and to train new post graduate students with specialist water quality skills. commercialise Project Intellectual Property in such a manner as to ensure that the maximum benefit accrues to the Australian water industry, the Australian environment and the Australian economy generally
, 16 Industry & 8 Associate partners. Key Objectives: create a centre of excellence with the capability of pursuing world class research and training. ensure that participants with their differing disciplines and backgrounds will interact effectively to optimise research outcomes. increase the human skills base of the water supply industry and to train new post graduate students with specialist water quality skills. commercialise Project Intellectual Property in such a manner as to ensure that the maximum benefit accrues to the Australian water industry, the Australian environment and the Australian economy generally.")
15
2. INTRODUCTION

16
2.1 Microbes on our planet & their roles
60% of the organisms are microbial (more microbes than human cells) Surive & thrive in virtually in all environments, often where no other “higher forms” of life exist. 1% have been characterised (24 kingdoms) & 99% remain uncharacterised (the tree of life has been generated using rRNA as chronometers) Efficient colonisers (rapid growth & doubling) Provide a service to the planet: Ecosystem servicing (biogeochemical cycle, flux) Biotechnology (vitamins, amino acids) Also produce harm: Directly as pathogens Indirectly producing byproducts (toxins) Simple morphology provides very little clues to their identities
 Surive & thrive in virtually in all environments, often where no other higher forms of life exist. 1% have been characterised (24 kingdoms) & 99% remain uncharacterised (the tree of life has been generated using rRNA as chronometers) Efficient colonisers (rapid growth & doubling) Provide a service to the planet: Ecosystem servicing (biogeochemical cycle, flux) Biotechnology (vitamins, amino acids) Also produce harm: Directly as pathogens. Indirectly producing byproducts (toxins) Simple morphology provides very little clues to their identities.")
17
Water Microbiology as it Relates to Public Health
NEW Water Microbiology as it Relates to Public Health Animal reservoirs Human reservoir Domestic use Land surface Groundwater Shellfish Aerosol Recreation Wastewater Surface water Aerosols Crops Three main routes must be considered to prevent the spread of waterborne (& foodborne) diseases. The particular pathogen, its reservoir and its mode of transmission. The figuree shows the potential route(s) of transmission and the reservoirs. For examples, cows are sources for crypotosporodiosis and poultry are sources for campylosis.
 diseases. The particular pathogen, its reservoir and its mode of transmission. The figuree shows the potential route(s) of transmission and the reservoirs. For examples, cows are sources for crypotosporodiosis and poultry are sources for campylosis.")
18
2.2 Water as a Changable Heterogeneous Environment
Climate variability Rainfall Soil erosion Catchment runoff Reservoir Environmental flows Water allocation Irrigation Billabong (wetland) 10. Drinking water Filtration plant 11. Constructed wetland 12. Urban run-offs 13. Wastewater treatment 14. Industrial use 15. Industrial Re-use 16. Bore 17. Water table 18. River sediment 19. Mangrooves 20. Estuary 21. Recreational use
 10. Drinking water Filtration plant. 11. Constructed wetland. 12. Urban run-offs. 13. Wastewater treatment. 14. Industrial use. 15. Industrial Re-use. 16. Bore. 17. Water table. 18. River sediment. 19. Mangrooves. 20. Estuary. 21. Recreational use.")
19
8

20
2.3 Microbes & their role in water
In nature, microbes live as communities (compete, synergy, complement) They can change the environment for their growth Most natural ecosystems are pristine ie very little nutrients What about reservoirs or dams (man made to maximise storage) A case study of what goes on in a reservoir: Activities affecting a reservoir
 They can change the environment for their growth. Most natural ecosystems are pristine ie very little nutrients. What about reservoirs or dams (man made to maximise storage) A case study of what goes on in a reservoir: Activities affecting a reservoir.")
21
C, N, S, O fluxes & transformations
Danger Donot enter Recreation Farming activities stratification pump Forestry activities C, N, S, O fluxes & transformations Filtration & treatment Lead pipe Copper pipe Distribution system INTERACTIVITY & INTERDEPENDENCY Ecology, Environmental & Public Health Microbiology Groups Regulatory Group Transparency Group PVC pipe Biofilm development ?

22
2.4 Why monitor water supplies?
Pathogens (produce disease): Present in water due to human / animal fecal contamination Bacteria, virus, protozoa, helminths Diverse types present (eg 100 types of viruses) Chemical pollutants Carcinogens, toxins, endocrine disruptors & treatment byproducts Present due to industry, microbial activities, geological Risk to Human Health Dose, host resistance (age, immunity), length of exposure
: Present in water due to human / animal fecal contamination. Bacteria, virus, protozoa, helminths. Diverse types present (eg 100 types of viruses) Chemical pollutants. Carcinogens, toxins, endocrine disruptors & treatment byproducts. Present due to industry, microbial activities, geological. Risk to Human Health. Dose, host resistance (age, immunity), length of exposure.")
23
2.5 Ensuring the safety of drinking water (management)
Primary assessment: Correct operation of water supply system Verification: Proof that water is safe after supply. This includes monitoring for compliance. Risk assessment: Maximum Acceptable Concentration (MAC). Should be zero but rarely technically & economically feasible. Compliance parameters Compliance & risk assessment may be different for countries, states and applications. Improved awarness: Flexible, transparent, achievable & realistic outcomes
. Should be zero but rarely technically & economically feasible. Compliance parameters. Compliance & risk assessment may be different for countries, states and applications. Improved awarness: Flexible, transparent, achievable & realistic outcomes.")
24
2.6 Ensuring the safety by monitoring & detection
Direct measurement of harmful agents Microbes: Not usually undertaken. Difficult, expensive, time consuming & lack of technology. Risk -> Acute & short-lived Chemicals: Usually undertaken. Technology exists. Risk -> Chronic exposure & delay between sampling, testing & acting on results is okay Monitoring water quality barriers (catchment activities, filtration, disinfection) Complete risk management system for health. Gaining popularity. Currently used indicators of water quality Inadequate, but will be used until “new” & “better” methods tried, tested & ratified. Does not take into account emerging risks (microbes, chemicals). New risks, new ways.
 Complete risk management system for health. Gaining popularity. Currently used indicators of water quality. Inadequate, but will be used until new & better methods tried, tested & ratified. Does not take into account emerging risks (microbes, chemicals). New risks, new ways.")
25
3. Bacterial Indicators of Water Pollution

26
3.1 What are bacterial indicators of pollution?
Direct pathogen identification / isolation is impractical and / or impossible Alternate indirect “indicator organism” based inference is necessary: universally present in large nos. in warm blooded animal faeces readily detectable by simple methods do not grow in natural waters persistence in water treatment regimes is similar to that for pathogens

27
3.2 Coliforms & E.coli as bacterial indicators (Pre 1948)
Coliforms (coli-like, 1880) fulfill these criteria as they indicate fecal pollution and therefore “unsafe water” Total coliforms (Enterobacteriaceae): Escherichia, Klebsiella, Enterobacter & Citrobacter - Ferment lactose, 1% or 109/g human faeces. Used as a standard for testing (assuming that total coliforms = E. coli) PROBLEMS WITH TOTAL COLIFORM RULE Proportion of E. coli & coliforms as faeces leaves the body. (Coliforms are are normal inhabitants of unpolluted soils & water). Coliforms & waterborne disease outbreaks are not always linked & does not necessarily indicate potential health risk. The current guidelines for drinking water & freshwater recreational waters are shown in the next table as comparisons
 fulfill these criteria as they indicate fecal pollution and therefore unsafe water Total coliforms (Enterobacteriaceae): Escherichia, Klebsiella, Enterobacter & Citrobacter - Ferment lactose, 1% or 109/g human faeces. Used as a standard for testing (assuming that total coliforms = E. coli) PROBLEMS WITH TOTAL COLIFORM RULE. Proportion of E. coli & coliforms as faeces leaves the body. (Coliforms are are normal inhabitants of unpolluted soils & water). Coliforms & waterborne disease outbreaks are not always linked & does not necessarily indicate potential health risk. The current guidelines for drinking water & freshwater recreational waters are shown in the next table as comparisons.")
28
Maximum no of indicated organisms permitted / 100 ml of water type
Table Bacteriological drinking water & recreational freshwater standards or guidelines Source of standard Maximum no of indicated organisms permitted / 100 ml of water type Total coliformsa Thermotolerant coliforms Turbidtyb (NTU) Drinking Recreational WHO 1-10 <1-5 Canada <10 200c 35 European Economic Community <10,000d 0-4 United States 200e <2,000d 1 (monthly) Enterococci (recreational) a < 1 out of the <40 monthly samples analysed or < 5% of the > 40 samples analysed monthly should be positive for coliforms b Nephlometric Turbidity Units C > 90% are E.coli d Compulsory limits, bathing is restricted if >20% samples over 14 day period are positive e If 5 samples taken over 30 days are positive
 Drinking. Recreational. WHO <1-5. Canada. < c. 35. European Economic Community. <10,000d United States. 200e. <2,000d. 1 (monthly) Enterococci. (recreational) a < 1 out of the <40 monthly samples analysed or < 5% of the > 40 samples analysed monthly should be positive for coliforms. b Nephlometric Turbidity Units. C > 90% are E.coli. d Compulsory limits, bathing is restricted if >20% samples over 14 day period are positive. e If 5 samples taken over 30 days are positive.")
29
3.2 Coliforms & E. coli as bacterial indicators (Post 1948)
Rapid methods of identifying were E. coli developed Specific & well known thermotolerant (faecal) coliform test developed. The Total Coliform Rule has been revised, reviewed, reassessed but not dropped (Criteria based on quality & compliance & health risk assessment) Example 1. US Envrion. Protection agency (USEPA, 1990): The water authority must not find coliforms in > 5% samples. If found, repeat samples within 24 hrs. If repeat samples test positive then it must be analysed for faecal coliforms and E. coli. A positive test signifies Maximum Coliform Limits (MCC) violation & this neccessitates rapid state and public notification. Example 2 EU Directive, 1998: E. coli, Enterococci & Coliforms 0 / 100ml. Aesthetic parameters (color, conductivity, chloride, taste & ordour). The parameters should be taken in the context of health risk assessment.
 coliform test developed. The Total Coliform Rule has been revised, reviewed, reassessed but not dropped (Criteria based on quality & compliance & health risk assessment) Example 1. US Envrion. Protection agency (USEPA, 1990): The water authority must not find coliforms in > 5% samples. If found, repeat samples within 24 hrs. If repeat samples test positive then it must be analysed for faecal coliforms and E. coli. A positive test signifies Maximum Coliform Limits (MCC) violation & this neccessitates rapid state and public notification. Example 2 EU Directive, 1998: E. coli, Enterococci & Coliforms 0 / 100ml. Aesthetic parameters (color, conductivity, chloride, taste & ordour). The parameters should be taken in the context of health risk assessment.")
30
3.3 Recent changes in coliform definition
Coliforms: Members of the family Enterobactericeae; produce acid & gas from lactose ( ±2oC) Thermotolerant (fecal) coliforms: As above but were able to grow & ferment lactose at 44.5±0.2oC and include E. coli < Klebsiella, Enterobacter & Citrobacter (E. coli also produce indole from tryptophan). SEE “TESTS FOR DIFFERENTIATING COLIFORMS” SLIDE Report 71, 1994 Bacteriological Examination of Drinking water supplies: biochemical definition changed to “acid-only production from lactose” & therefore increased the numbers of species in the coliform category Enzymes: Lactose fermentation by the presence of -galactosidase is now considered as another modification to the coliform definition. Australiasia, UK, Europe & soon USEPA use commercial enyme kits & these detect coliforms that are not traditionally picked up culture media (Noncultural but viable) hence increasing the numbers of species in the coliform group.
 Thermotolerant (fecal) coliforms: As above but were able to grow & ferment lactose at 44.5±0.2oC and include E. coli < Klebsiella, Enterobacter & Citrobacter (E. coli also produce indole from tryptophan). SEE TESTS FOR DIFFERENTIATING COLIFORMS SLIDE. Report 71, 1994 Bacteriological Examination of Drinking water supplies: biochemical definition changed to acid-only production from lactose & therefore increased the numbers of species in the coliform category. Enzymes: Lactose fermentation by the presence of -galactosidase is now considered as another modification to the coliform definition. Australiasia, UK, Europe & soon USEPA use commercial enyme kits & these detect coliforms that are not traditionally picked up culture media (Noncultural but viable) hence increasing the numbers of species in the coliform group.")
31
Klebsiella, Enterobacter, Citrobacter
Table showing coliform members by evolving definition Acid & Gas from lactose Acid from lactose -galactosidase Escherichia Klebsiella, Enterobacter, Citrobacter Yersinia, Serratia, Hafnia, Pantoea, Kluyvera Cedecea Edwingella Moellerella Leclercia Rahnella Yokenella Coliforms that can be present in the environment & in human faeces (bold ) and coliforms that are only environmental (bold & underlined)
 and coliforms that are only environmental (bold & underlined)")
32
Commercial kits based detection methods for
microbial indicators Kit Manufacturers: IDEXX: Enterolert, Colisure, Colilert Hach: m-ColiBlue BioControl: ColiComplete Chromocult: Merck Gelman: MicroSure Indicator group Enzyme / (substrate) Total Coliforms -D-galactosidase (o-nitophenyl, 6-bromo-2-napthyl, 5-bromo-4-chloro-3-indolyl linked to -D-galactoside) SEE NEXT SLIDE E. coli -D-glucoronidase (5-bromo-4-chloro-3-indolyl, 4-methylumbelliferyl linked to -D-glucoronide) SEE NEXT SLIDE Enterococci -D-glucosidase (4-methylumbelliferyl, indoxyl- linked to -D-glucoroside)
 Total Coliforms. -D-galactosidase (o-nitophenyl, 6-bromo-2-napthyl, 5-bromo-4-chloro-3-indolyl linked to -D-galactoside) SEE NEXT SLIDE. E. coli. -D-glucoronidase (5-bromo-4-chloro-3-indolyl, 4-methylumbelliferyl linked to -D-glucoronide) SEE NEXT SLIDE. Enterococci. -D-glucosidase (4-methylumbelliferyl, indoxyl- linked to -D-glucoroside)")
33
Tests for differentiating coliforms
E. coli E. aerogenes K. pneumoniae Lactose 35 oC Enzyme -galactosidase ONPG Total coliforms Elevated temperature 44.5 oC Fecal coliforms -glucoronidase MUG If growth at of designate as all ferment at uses named detected with assay for Tests for differentiating coliforms

34
4. Alternatives to Coliforms as indicators of water pollution

35
Faecal coliform absence indicates enetric pathogens most likely absent but does not guarantee absence of viruses & protozoal cysts (survive longer in water & more resistant to disinfection) Enterococci, sulfite-reducing clostridia, Bacteroides fragilis, Bifidobacteria, bacteriophages & non-microbiological indicators (faecal sterols) have been proposed as alternatives to fecal coliforms Entercocci is the most preferred (also as alternative to E. coli) Common commensals in warm blooded guts 19 species (faecium, faecalis, durans, hirae dominate) Survive longer & do not grow in the environment An order of magnitude less than coliforms Commercial test available
 have been proposed as alternatives to fecal coliforms. Entercocci is the most preferred (also as alternative to E. coli) Common commensals in warm blooded guts. 19 species (faecium, faecalis, durans, hirae dominate) Survive longer & do not grow in the environment. An order of magnitude less than coliforms. Commercial test available.")
36
Risk Assessment Analysis Framework and Emerging Pathogens
Section II. Risk Assessment Analysis Framework and Emerging Pathogens

37
2.The current list of pathogens
1.Epidemiology of some waterborne pathogens. 2.The current list of pathogens 3.How to monitor and assess the risk of pathogens?

38
Epidemiology of some pathogens.
1. Epidemiology of some pathogens.

39
1. 90% water related illness are microbial
Information modified 1. 90% water related illness are microbial 2. Canada (1974 – 1987): 32 waterborne outbreaks - Giardia:10, Norwalk & HAV: 5, 17 unknown origin. 2000: E. coli O157, 2001 Cryptosporidium. 3. USA (1993 – 1998): Cryptosporidium (Milwaukee, Las Vegas, Nevada) 2001: Microcystin & cylindrospermopsin found in Florida drinking water plant (5 times WHO guideline) 4. Europe (1980 –1990): Cryptosporidium (UK) 6. Vibrio cholera surveillance in India: 34 k (33 deaths) Flood related since July 2001 5. E. coli >feces contaminated soil, to irrigation water, to food (Both E. coli 0157:H7 and VT6 gene strains isolated) Swaziland: 1992 (20k), Missouri: 1989, UK: several outbreaks reported, Wyoming: 1998, NY: 1999 (1k involved, 2 deaths, Campylobacter also implicated), Canada: 2001 (2K involved, 7 deaths- heavy rainfall & inadequate treatment) 6. Northern Ireland: 2001 Cryptosporidium 7. Portugal: 2001 Cyanobacteria toxins reported
: 32 waterborne outbreaks - Giardia:10, Norwalk & HAV: 5, 17 unknown origin. 2000: E. coli O157, 2001 Cryptosporidium. 3. USA (1993 – 1998): Cryptosporidium (Milwaukee, Las Vegas, Nevada) 2001: Microcystin & cylindrospermopsin found in Florida drinking water plant (5 times WHO guideline) 4. Europe (1980 –1990): Cryptosporidium (UK) 6. Vibrio cholera surveillance in India: 34 k (33 deaths) Flood related since July E. coli >feces contaminated soil, to irrigation water, to food. (Both E. coli 0157:H7 and VT6 gene strains isolated) Swaziland: 1992 (20k), Missouri: 1989, UK: several outbreaks reported, Wyoming: 1998, NY: 1999 (1k involved, 2 deaths, Campylobacter also implicated), Canada: 2001 (2K involved, 7 deaths- heavy rainfall & inadequate treatment) 6. Northern Ireland: 2001 Cryptosporidium. 7. Portugal: 2001 Cyanobacteria toxins reported.")
40
8. Multiagent waterborne disease outbreaks:
- Switzerland: 2001, coinfection of small round structured virus (SSRV) + Shigella + Campylobacter - Canada: 2001, E. coli 0157:H7 & Campylobacter -> 2300 ill, 27 developed haemolytic uraemic syndrome complications (HUS), 7 deaths.
 + Shigella + Campylobacter. - Canada: 2001, E. coli 0157:H7 & Campylobacter -> 2300 ill, 27 developed haemolytic uraemic syndrome complications (HUS), 7 deaths.")
41
2. Common Waterborne Pathogens

42
Waterborne Pathogens:
are classified as members of domains Bacteria, Eucarya or virus. they differ in: morphologies growth physiology & metabolism fine genetic details Both classification & Identification is now increasingly based on their molecular events & molecular details (see next figure). The pathogens listed in the following tables have been detected in water and / or in outbreaks. An attempt has been made to provide their classification on the newly introduced molecular trend. The biology of a number of the pathogens will be described and the possible targets sites for their identification highlighted.
. The pathogens listed in the following tables have been detected in. water and / or in outbreaks. An attempt has been made to provide. their classification on the newly introduced molecular trend. The biology of a number of the pathogens will be described and the possible targets sites for their identification highlighted.")
43
Evolution of Universal Ancestor (3.5 billion yrs)
EUKARYA (7) ARCHAEA (3) BACTERIA (21) Trichomonads Crenarchaeota Euryarchaeota Pyrodicitum Slime molds Red algae Fungi Green algae Dinoflagellates Ciliates Methanocococcus Plants Dictyoglomus Desulfurococcus Thermomicrobia Halophiles Animals Thermococcus Thermodesulfobacteria Thermotoga Chrysiogenetes Brown algae Aquifex Deferribacter Proteobacteria Thermales Nitrospira Flagellates Cyanobacteria Methanopyrus Firmicutes Verrucomicrobia Microsporidia Acidobacteria Korarchaeota Fibrobacter Diplomonads Planctomycetes Some 15 years ago, Woese and his colleagues provided evidence based on comparisons of rRNA sequences that all life cellular forms could be unified into one “universal tree of life”. They also showed that they were 3 cellular lines of descent radiating from the tree of life which they proposed to call domain (super kingdoms). This was different from the dichotomous concept of Procaryotes and Eucaryotes (based on EM) and also different to the 5 kingdomw classification system (based mainly on phenotypic or expressed features). Subsequently, they were able to root the tree of life, that is, showed which was the most ancient domains and which was the most modern domain. Fossil evidence and the rRNA work provided evidence that cellular life started to evolve some 3.5 billion to 4 billion years ago. The tree of life is based on molecular sequences, namely rRNA. Eucarya are the most recently evolved (300 million), the Archae the most ancient. Eucarya and Archae are sister branches at the molecular level. More closely related than Archae and Bacteria (though both are both procaryotes ie resemble each other at the EM level) The Bacteria are the most diverse, 21 kingdoms cultured & at least 15 kingdoms, inferred from 16S rRNA gene sequences have no cultured representatives The ancestor for all cells were most likely from high temperature environments, simple biochemically (anaerobic, autotroph and no light) The difference in length of the node of one branch to another is known as the distance. The closer the distance the more related they are. NOTES: Water borne pathogens of domain Bacteria include members of the phyla (kingdoms) Proteobacteria (alpha, beta, gamma and delta subdivisions) Spirochetes, Cyanobacteria and Actinobacteria. Actinobacteria Chlamydia Evolution of Universal Ancestor (3.5 billion yrs) Fusiforms Spirochetes Bacteroides The Tree of Life - 16th November 2000
 ARCHAEA (3) BACTERIA (21) Trichomonads. Crenarchaeota. Euryarchaeota. Pyrodicitum. Slime molds. Red algae. Fungi. Green algae. Dinoflagellates. Ciliates. Methanocococcus. Plants. Dictyoglomus. Desulfurococcus. Thermomicrobia. Halophiles. Animals. Thermococcus. Thermodesulfobacteria. Thermotoga. Chrysiogenetes. Brown algae. Aquifex. Deferribacter. Proteobacteria. Thermales. Nitrospira. Flagellates. Cyanobacteria. Methanopyrus. Firmicutes. Verrucomicrobia. Microsporidia. Acidobacteria. Korarchaeota. Fibrobacter. Diplomonads. Planctomycetes. Some 15 years ago, Woese and his colleagues provided evidence based on comparisons of rRNA sequences that all life cellular forms could be unified into one universal tree of life . They also showed that they were 3 cellular lines of descent radiating from the tree of life which they proposed to call domain (super kingdoms). This was different from the dichotomous concept of Procaryotes and Eucaryotes (based on EM) and also different to the 5 kingdomw classification system (based mainly on phenotypic or expressed features). Subsequently, they were able to root the tree of life, that is, showed which was the most ancient domains and which was the most modern domain. Fossil evidence and the rRNA work provided evidence that cellular life started to evolve some 3.5 billion to 4 billion years ago. The tree of life is based on molecular sequences, namely rRNA. Eucarya are the most recently evolved (300 million), the Archae the most ancient. Eucarya and Archae are sister branches at the molecular level. More closely related than Archae and Bacteria (though both are both procaryotes ie resemble each other at the EM level) The Bacteria are the most diverse, 21 kingdoms cultured & at least 15 kingdoms, inferred from 16S rRNA gene sequences have no cultured representatives. The ancestor for all cells were most likely from high temperature environments, simple biochemically (anaerobic, autotroph and no light) The difference in length of the node of one branch to another is known as the distance. The closer the distance the more related they are. NOTES: Water borne pathogens of domain Bacteria include members of the phyla (kingdoms) Proteobacteria (alpha, beta, gamma and delta subdivisions) Spirochetes, Cyanobacteria and Actinobacteria. Actinobacteria. Chlamydia. Evolution of Universal Ancestor (3.5 billion yrs) Fusiforms. Spirochetes. Bacteroides. The Tree of Life - 16th November")
44
2. A list of bacterial waterborne pathogens
Bacterial pathogen Phylum Feces Urine Disease H A Sphingomonas Potential Burkeholdaria E. coli 0157:H7 (hemorrhagic) E. coli (enteroinvasive) E. coli (enterpathogenic) E. coli (enteroitoxigenic) Enterobacterales + - Strain dependent cramps, vomit, diarrhea, fever Salmonellae species Salmonella enterica (serovar typhi) Watery, bloody diarrhea Typhoid, enteric fever, abdominal pain Shigella (S.flexneri, S. sonnei, S. dysenteriae, S. boydii) Shigellosis (bacillary dysentery) Plesiomonas shigelloides ? Fish & crustaceans Vibrio cholera 01 Vibrio cholera non-01 Vibrionales Cholera (Asiatic flu, Indian, El Tor) Legionella Legionellales Legionellosis Pseudomonas Pseudomanadales Aermomonas hydrophila Aeromoandales Water diarrhea Desulfovibrio species Desulovibrionales Stomach colitis (?) Campylobacteria Diarrhea Arcobacter Helicobacteria Stomach ulcers Leptospira Spirochaetes Weil’, swineherd’s, hemorrhagic Mycobacteria avium-intracelllare & other species Actinobacteria Lung disease Cyanobacteria (toxins) Cyanobacteria: taxonomy in flux Mycrocystins (60), Cylindrospermopsin Proteobacteria Duration of disease is between 1 to 42 days
 E. coli (enteroinvasive) E. coli (enterpathogenic) E. coli (enteroitoxigenic) Enterobacterales. + - Strain dependent cramps, vomit, diarrhea, fever. Salmonellae species. Salmonella enterica (serovar typhi) Watery, bloody diarrhea. Typhoid, enteric fever, abdominal pain. Shigella (S.flexneri, S. sonnei, S. dysenteriae, S. boydii) Shigellosis (bacillary dysentery) Plesiomonas shigelloides. Fish & crustaceans. Vibrio cholera 01. Vibrio cholera non-01. Vibrionales. Cholera (Asiatic flu, Indian, El Tor) Legionella. Legionellales. Legionellosis. Pseudomonas. Pseudomanadales. Aermomonas hydrophila. Aeromoandales. Water diarrhea. Desulfovibrio species. Desulovibrionales. Stomach colitis ( ) Campylobacteria. Diarrhea. Arcobacter. Helicobacteria. Stomach ulcers. Leptospira. Spirochaetes. Weil’, swineherd’s, hemorrhagic. Mycobacteria avium-intracelllare. & other species. Actinobacteria. Lung disease. Cyanobacteria (toxins) Cyanobacteria: taxonomy in flux. Mycrocystins (60), Cylindrospermopsin. Proteobacteria. Duration of disease is between 1 to 42 days.")
45
Problems associated with bacterial identification
Information modified Problems associated with bacterial identification Phylum Cyanobacteria (blue green algae): Some 50 to 60 genera; some produce oligopeptide toxins& are of increasing concern (dermal, cytotoxin, mutantion causing and carcinogens). Lifelong exposure vs short term acute exposure Toxins are produced by (a) nonribosomal peptide synthetase (NRPS) which have iterative catalytic domains. Overproduction of one or several sets up a catalytic reaction leading to production of the toxins. (b) Peptide kinase synthetase (PKS). MALDI-TOF MS shows a large spectrum of oligopeptides & other poorly undertood metabolities from cyanobacteria. Microcystis exist as toxigenic organism in reservoirs & form blooms (summer to late autumn) but reports of non-toxicogenic strains have been reported. Some 60 toxins (collectively called Microcystin) are produced; these are thought to react with chlorine to produce other toxin bye-products They have been traditionally classified on the basis of morphology & physiology which has created confusion. Based on 16S rRNA and DNA homology studies, the 23 species have now been identified as belonging to M. aeruginosa Toxin production in strains vary based on growth conditions (in vivo and in situ) causing more confusion.
: Some 50 to 60 genera; some produce oligopeptide toxins& are of increasing concern (dermal, cytotoxin, mutantion causing and carcinogens). Lifelong exposure vs short term acute exposure. Toxins are produced by (a) nonribosomal peptide synthetase (NRPS) which have iterative catalytic domains. Overproduction of one or several sets up a catalytic reaction leading to production of the toxins. (b) Peptide kinase synthetase (PKS). MALDI-TOF MS shows a large spectrum of oligopeptides & other poorly undertood metabolities from cyanobacteria. Microcystis exist as toxigenic organism in reservoirs & form blooms (summer to late autumn) but reports of non-toxicogenic strains have been reported. Some 60 toxins (collectively called Microcystin) are produced; these are thought to react with chlorine to produce other toxin bye-products. They have been traditionally classified on the basis of morphology & physiology which has created confusion. Based on 16S rRNA and DNA homology studies, the 23 species have now been identified as belonging to M. aeruginosa. Toxin production in strains vary based on growth conditions (in vivo and in situ) causing more confusion.")
46
Nostoc punctiforme PCC 73102.
"Anabaena cylindrica" str. NIES19 PCC 7122. Pseudoanabaena biceps PCC 7367. Lyngbya confervoides PCC 7419. "Calothrix desertica" PCC 7102. Cylindrospermopsis raciborskii str. AWT205. "Anabaena variabilis" IAM M-3. 10% Nostoc muscorum PCC 7120. Planktothrix rubescens str. BC-Pla 9303. "Oscillatoria agardhii" str. CYA 18. "Oscillatoria corallinae" str. CJ1 SAG8.92. Trichodesmium species Spirulina subsalsa str. M-223. Prochloron didemni. Cyanobacterium stanieri PCC 7202. "Oscillatoria rosea" str. M-220. Merismopedia glauca str. B Gloeothece membranacea. Microcystis wesenbergii. Microcystis novacekii str. TAC20. Microcystis viridis. Microcystis ichthyoblabe str. TAC48. Microcystis aeruginosa. Chamaesiphon subglobosus PCC 7430. Octopus Spring microbial mat DNA Yellow Leptolyngbya boryanum PCC "Plectonema boryanum" UTEX 485. Leptolyngbya foveolarum str. Komarek 1964/112. Gloeochaete wittrockiana str. SAG B 46.84 Glaucocystis nostochinearum str. SAG 45 Cyanophora paradoxa (colorless flagellate alga) -- cyanelle. "Oscillatoria limnetica" str. MR1 Phormidium mucicola str. M-221. The identification of cyanobacteria, the causative agents for a number of toxin-producing illnesses, is in a state of flux. The previous identification by morphology & / or toxin production does not reflect the rRNA based molecular phylogeny. Phormidium ambiguum str. M-71. Microcystis holsatica. Microcystis elabens. Prochlorococcus marinus PCC 9511. Synechococcus elongatus. Prochlorothrix hollandica. "Oscillatoria neglecta" str. M-82 Phormidium "ectocarpi" str. N182. Phormidium minutum str. D5.
 -- cyanelle. Oscillatoria limnetica str. MR1. Phormidium mucicola str. M-221. The identification of cyanobacteria, the causative agents for a number of toxin-producing illnesses, is in a state of flux. The previous identification by morphology & / or toxin production does not reflect the rRNA based molecular phylogeny. Phormidium ambiguum str. M-71. Microcystis holsatica. Microcystis elabens. Prochlorococcus marinus PCC Synechococcus elongatus. Prochlorothrix hollandica. Oscillatoria neglecta str. M-82. Phormidium ectocarpi str. N182. Phormidium minutum str. D5.")
47
2. A list of protozoal waterborne pathogens
Source Disease Animal feces Non-fecal Entamoeba histolytica Rare No Amebiasis (dysentry, enetritis, colitis) Giardia lamblia Yes Giardiasis (hikers disease) Cryptosporidium parvum Cryptosporodiosis (cramp, vomit, fever, diarrhea) Microsporidia: Enterocytozoon Septata ? Cramp, vomit, fever, diarrhea Cyclospora cayatenensis Toxoplasma gondii Acanthamoeba Blantidium coli Abdominal pain, bloody diarrhea
 Giardia lamblia. Yes. Giardiasis (hikers disease) Cryptosporidium parvum. Cryptosporodiosis (cramp, vomit, fever, diarrhea) Microsporidia: Enterocytozoon. Septata. Cramp, vomit, fever, diarrhea. Cyclospora. cayatenensis. Toxoplasma gondii. Acanthamoeba. Blantidium coli. Abdominal pain, bloody diarrhea.")
48
Picorna, Corona, parvo, picobirna, picotrirna
2. A List of viral waterborne pathogens Virus Group Faecal Source Disease Human Animal Cytopathogenic human orphan (ECHO), polio, coxsackies Entero Yes No Aseptic meningitis, infantile diarrhea, polio Hepatitis A Virus (HAV) Hepatitis E Virus (HEV) Hepatitis Pigs ? Infectious Hepatitis Rotavirus A Rotavirus B Rotavirus Acute gastroenteritis Nowalk virus Snow mountain Calicivirus ? Astrovirus 100’s of others (Developing new method to work with them?) Small small round structured virus (SSRV) Picorna, Corona, parvo, picobirna, picotrirna Uncertain
, polio, coxsackies. Entero. Yes. No. Aseptic meningitis, infantile diarrhea, polio. Hepatitis A Virus (HAV) Hepatitis E Virus (HEV) Hepatitis. Pigs Infectious Hepatitis. Rotavirus A. Rotavirus B. Rotavirus. Acute gastroenteritis. Nowalk virus. Snow mountain. Calicivirus. Astrovirus. 100’s of others (Developing new method to work with them ) Small small round structured virus (SSRV) Picorna, Corona, parvo, picobirna, picotrirna. Uncertain.")
49
Viruses: Role of some human enteric & respiratory viruses (& some animal viruses) as waterborne pathogens has been well established Most are nonenveloped (except corona & picobirna-viruses) – more ressistant to physical & chemical agents then the lipid containing enveloped viruses Potential transmission route directly or indirectly from animal human & this is of concern
 – more ressistant to physical & chemical agents then the lipid containing enveloped viruses. Potential transmission route directly or indirectly from animal human & this is of concern.")
50
By using risk assessment analysis frame work
3. How to prioritise the list of pathogens for further studies? By using risk assessment analysis frame work

51
Table 2 Ecology / occurrence framework for waterborne pathogens
Occurrence determinants: Incidence, Lifecycle(s), Epidemiological data – worldwide, reservoirs of agents (animal / human), geological distribution Detection: General, viable?, temperature (water pollution) Water-based vs water borne: Secondary hosts Biofilm Treatment barriers: Source water quality Watershed management Treatment process configuration (driven by source water quality) Distribution concerns Microbial adaptation: Treatment chain Distribution system Pathways: Ingestion Dermal Inhalation
, Epidemiological data – worldwide, reservoirs of agents (animal / human), geological distribution. Detection: General, viable , temperature (water pollution) Water-based vs water borne: Secondary hosts. Biofilm. Treatment barriers: Source water quality. Watershed management. Treatment process configuration (driven by source water quality) Distribution concerns. Microbial adaptation: Treatment chain. Distribution system. Pathways: Ingestion. Dermal. Inhalation.")
52
Table3 Treatment framework for waterborne pathogens
Organism properties & origins: Physical: Size, surface properties, (charge, hydrophobicity, affinity for adsobtion), surface structure, settling rate, aggregration, spore-formation Oxidant: Mechanism of action Origin: human, animal, naturally occurring Disinfection kinetics: Disinfection sensitivity (chlorine/chloroamine, chlorine dioxide, ozone, advanced oxidation processes (AOP), UV, pottasium permanganate Synergistic / sequential Contact time Organism survivability: Survival/transport Inactivation/injury/culturability Survival in sludges Organism growth / regrowth: Regrowth Growth in filters Microbial protection / antagonism: Engineering Plant operation: Source basin (size, settling rate, residence time, turnover) intake characteristics (level, position, hydrology), filter operations, line breaks / replacements Maintenance practices (flushing) Water Quality Characteristics: Particulates Chemical & physical (pH, temp, NOM, hardness, alkalinity) Watershed management: Human activity (sewage inputs) Animal & environmental sources
, surface structure, settling rate, aggregration, spore-formation. Oxidant: Mechanism of action. Origin: human, animal, naturally occurring. Disinfection kinetics: Disinfection sensitivity (chlorine/chloroamine, chlorine dioxide, ozone, advanced oxidation processes (AOP), UV, pottasium permanganate. Synergistic / sequential. Contact time. Organism survivability: Survival/transport. Inactivation/injury/culturability. Survival in sludges. Organism growth / regrowth: Regrowth. Growth in filters. Microbial protection / antagonism: Engineering Plant operation: Source basin (size, settling rate, residence time, turnover) intake characteristics (level, position, hydrology), filter operations, line breaks / replacements. Maintenance practices (flushing) Water Quality Characteristics: Particulates. Chemical & physical (pH, temp, NOM, hardness, alkalinity) Watershed management: Human activity (sewage inputs) Animal & environmental sources.")
53
Conclusions from discussion on pathogens
Many pathogens cause water-borne diseases Complex habitats for their growth Pathogenic bacteria, virus & protozoa may co-exist Symptoms similar but causative agents may be different.Therefore assisted diagnosis is not always possible Identification essential as patient treatment regimes depend on the type of causative agent (bacteria vs virus vs protozoa) Alternative methods to assess the risk of the pathogens present in water are necessary which can be achieved by using various frameworks
 Alternative methods to assess the risk of the pathogens present in. water are necessary which can be achieved by using various. frameworks.")
54
The Need for Molecular methods for the identification &
detection of pathogens Current US$380 million market & a 20% annual increase is expected Emerging sophisticated gene technologies (indicators & pathogens) Skilled (bioinformatics, genomics, phenomics) staff required. Multicomprehension (ecology, environmental etc) required Method rapid flexible, reproducible & can be ariticulated to particular needs of different countries Initial research & development outlay is expensive (research costs)
 Skilled (bioinformatics, genomics, phenomics) staff required. Multicomprehension (ecology, environmental etc) required. Method rapid flexible, reproducible & can be ariticulated to particular. needs of different countries. Initial research & development outlay is expensive (research costs)")
55
Next? Finding molecular biology “information libraries”
Understanding the principles of molecular biology Finding & using tools for molecular methods

56
SECTION III. Molecular Biology Databases and Tools

57
Molecular Biology Bioinformatics Databases Online tools
CONTENT Molecular Biology Bioinformatics Databases Online tools Microbial Genomes

58
Molecular Biology DataBases
Biologists have been very successful in finding DNA & protein sequences: - high-speed automated DNA sequencing equipme - the Microbial Genomes (and eucaryotic genomes - bulk sequences of cDNAs (ESTs) especially for eucaryotic genomes. Why? - Bioinformatics scientists collect, organize and make sequence data that is generated, available to all biologists - Today data is shared and integrated between the three major data depositories, namely, GenBank, which forms part of the NCBI, European Molecular Biology Laboratory (EMBL) and the DNA Database of Japan (DDBJ). - During Oct. 1996, GenBank contained 1,021,211 sequence records = 652,000,000 bases of DNA sequence = 3.1 gigabytes of computer storage space. In June 1997 this escalated to 1,491,000 records and 967,000,000 bases. Check the sequence record out for for 2000 - The contents of GenBank are now doubling in less than a year, and the doubling rate is accelerating ie the data generated and collected is growing exponentially. - Whole genome data has been generated with 32 microbial genomes sequenced. A list of completely sequenced genomes and ongoing genome projects are maintained at Genomes Online Database (GOLD).
 especially for eucaryotic genomes. Why - Bioinformatics scientists collect, organize and make sequence data that is generated, available to all biologists. - Today data is shared and integrated between the three major data depositories, namely, GenBank, which forms part of the NCBI, European Molecular Biology Laboratory (EMBL) and the DNA Database of Japan (DDBJ). - During Oct. 1996, GenBank contained 1,021,211 sequence records = 652,000,000 bases of DNA sequence = 3.1 gigabytes of computer storage space. In June 1997 this escalated to 1,491,000 records and 967,000,000 bases. Check the sequence record out for for The contents of GenBank are now doubling in less than a year, and the doubling rate is accelerating ie the data generated and collected is growing exponentially. - Whole genome data has been generated with 32 microbial genomes sequenced. A list of completely sequenced genomes and ongoing genome projects are maintained at Genomes Online Database (GOLD).")
59
- Even simple computation or searching these enormous database requires a huge amount of computer power. What will be needed in 5 to 10 years time is hard to image. B. The Resources at NCBI Established in 1988 as a national resource for molecular biology information. It creates public databases, conducts research in computational biology, develops software tools for analyzing genome data, and disseminates biomedical information - all for the better understanding of molecular processes affecting human health and disease. The NCBI can be summarised as having 3 arms: GenBank Data Base: The GenBank Database is a sequence database and has a collecti on of publically available sequence data. It is part of National Institute of He alth (NIH), USA. GenBank, DataBank of Japan (DDBJ) and European Molecular Biolog y Laboratory (EMBL) have formed the International Nucleotide Sequence Database C ollaboration project under which the 3 organisations exchange data on a daily basis. In this database, new protein and nucleic acids sequences are deposited by researchers. These sequences are annotated and placed in the sequence database for access and public viewing. The database can also be searched.
, USA. GenBank, DataBank of Japan (DDBJ) and European Molecular Biolog y Laboratory (EMBL) have formed the International Nucleotide Sequence Database C ollaboration project under which the 3 organisations exchange data on a daily basis. In this database, new protein and nucleic acids sequences are deposited by researchers. These sequences are annotated and placed in the sequence database for access and public viewing. The database can also be searched.")
60
Literature Data Base: This is refered to as PubMed
Literature Data Base: This is refered to as PubMed. The database holds the abstracte of published articles. The various Sequence Data Bases and PubMed literature Data Base are linked via ENTREZ. ENTREZ is at the core of the search and retrieval system that integrates and links th e various databases. In order to maximise the benfits of the various databases it is imperative that you read and learn from the ENTREZHELP FILE Bioinformatics Tools: The most commonly used tool is known as BLAST and enables the user to input a sequence and search for the most similar sequences in the Data Base. C The Ribosomal DataBase Project (RDP): Contains downloadable GenBank formatted aligned and unaligned small subunit ribosomal rRNA sequences. Mainly extracted from the GenBank Data Base - is a GenBank subset specialist Data Base. It also conatins a set of integrated online analysis bioinformatics tools useful for aligning user input sequences based on rRNA secondary structural constraints and for constructing phylogeny. D. KEGG Data Base:
: Contains downloadable GenBank formatted aligned and unaligned small subunit ribosomal rRNA sequences. Mainly extracted from the GenBank Data Base - is a GenBank subset specialist Data Base. It also conatins a set of integrated online analysis bioinformatics tools useful for aligning user input sequences based on rRNA secondary structural constraints and for constructing phylogeny. D. KEGG Data Base:")
61
Some Useful Online Molecular Biology Tools
Search launchers at Computational Biology at EMBL: National Centre for Genome Research: UC Sac Diego Motif Search & alignment tools: The tools at InfoBiogen, France: The tools at the University of Pennsylvania: Compilation of tools & references at the University of California, Santa Cruz:

62
Why study microbial genomes?
until whole genome analysis became viable, life sciences have been based on a reductionist principle – dissecting cell and systems into fundamental components for further study studies on whole genomes and whole genome sequences in particular give us a complete genomic blueprint for an organism we can now begin to examine how all of these parts operate cooperatively to influence the activities and behavior of an entire organism – a complete understanding of the biology of an organism microbes provide an excellent starting point for studies of this type as they have a relatively simple genomic structure compared to higher, multicellular organisms studies on microbial genomes may provide crucial starting points for the understanding of the genomics of higher organisms

63
analysis of whole microbial genomes also provides insight into microbial evolution and diversity beyond single protein or gene phylogenies in practical terms analysis of whole microbial genomes is also a powerful tool in identifying new applications in for biotechnology and new approaches to the treatment and control of pathogenic organisms

64
History of microbial genome sequencing
first complete genome to be sequenced was bacteriophage X bp first genome to be sequenced using random DNA fragments - Bacteriophage bp mitochondrial (187 kb) and chloroplast (121 kb) genomes of Marchantia polymorpha sequenced early 90’s - cytomegalovirus (229 kb) and Vaccinia (192 kb) genomes sequenced first complete genome sequence from a free living organism - Haemophilus influenzae (1.83 Mb) late 1990’s - many additional microbial genomes sequenced including Archaea (Methanococcus jannaschii ) and Eukaryotes (Saccharomyces cerevisiae )
 and chloroplast (121 kb) genomes of Marchantia polymorpha sequenced. early 90’s - cytomegalovirus (229 kb) and Vaccinia (192 kb) genomes sequenced first complete genome sequence from a free living organism - Haemophilus influenzae (1.83 Mb) late 1990’s - many additional microbial genomes sequenced including Archaea (Methanococcus jannaschii ) and Eukaryotes (Saccharomyces cerevisiae )")
65
Microbial genomes sequenced to date
currently there are 32 complete, published microbial genomes – 25 domain Bacteria, 5 Domain Archaea, 1 domain Eukarya ( around 130 additional microbial genome and chromosome sequencing projects underway

66
Laboratory tools for studying whole genomes
conventional techniques for analysing DNA are designed for the analysis of small regions of whole genomes such as individual genes or operons many of the techniques used to study whole genomes are conventional molecular biology techniques adapted to operate effectively with DNA in a much larger size range. An example is that of pulsed field gel electrophoresis (PFGE), the principle of which will be discussed in detail under Molecular Methods section. PFGE is utilised routinely for epidemiological studies and for fingerprinting of E. coli and Neisseria meningitidis genomes. A potential useful tool for studying species, strain and serovariants
, the principle of which will be discussed in detail under Molecular Methods section. PFGE is utilised routinely for epidemiological studies and for fingerprinting of E. coli and Neisseria meningitidis genomes. A potential useful tool for studying species, strain and serovariants.")
67
Characteristics of sequenced genomes
the 32 complete genome sequences currently available cover a diverse range in terms of phylogeny and environments (eg. human pathogens, plant pathogens, extremophiles etc.) what conclusions can be made by comparing the genomes of these organisms regarding specific adaptations to proliferation in remarkably different environments? What conclusions can be made about evolutionary relationships between these organisms?
 what conclusions can be made by comparing the genomes of these organisms regarding specific adaptations to proliferation in remarkably different environments What conclusions can be made about evolutionary relationships between these organisms")
68
Horizontal gene transfer
before microbial genome sequences became available most of the focus of microbial evolution was on ‘vertical’ transmission of genetic information – mutation recombination and rearrangement within the clonal lineage of a single microbial population genome sequences have demonstrated that horizontal transfer of genes (between different types of organisms) are widespread and may occur between phylogentically diverse organisms generally speaking, essential genes (such as 16S rRNA) are unlikely to be transferred because the potential host most likely already contains genes of this type that have co-evolved with the rest of its cellular machinery and and cannot be displaced genes encoding non-essential cellular processes of potential benefit to other organisms are far more likely to be transferred (eg. those involved in catabolic processes) clearly, lateral transfer of genomic information has enormous potential in improving an microorganisms ability to compete effectively - this may explain why horizontally transferred genes appear so frequently and ubiquitously in microbial genomes an example of this is horizontally transferred genes has been found in pathogenic microbes
 are widespread and may occur between phylogentically diverse organisms. generally speaking, essential genes (such as 16S rRNA) are unlikely to be transferred because the potential host most likely already contains genes of this type that have co-evolved with the rest of its cellular machinery and and cannot be displaced. genes encoding non-essential cellular processes of potential benefit to other organisms are far more likely to be transferred (eg. those involved in catabolic processes) clearly, lateral transfer of genomic information has enormous potential in improving an microorganisms ability to compete effectively - this may explain why horizontally transferred genes appear so frequently and ubiquitously in microbial genomes. an example of this is horizontally transferred genes has been found in pathogenic microbes.")
69
Whole genome phylogenetic analysis
most of the evolutionary relationships between microorganisms are inferred by comparison of single genes – usually 16s rRNA genes although extremely effective, single gene phylogenetic trees only provide limited information which can make determining broad relationships between major groups difficult phylogenetic relationships can be determined by whole genome comparisons of the observed absence or presence of protein encoding gene families in effect this is similar to using the distribution of morphological characteristics to determine phylogeny – without the problem of convergent evolution trees produced using this method are similar to 16s rRNA trees, however, as more genome sequences become available more detailed conclusions can be drawn using this method

70
Species and strain specific genetic diversity
although genome sequencing and analysis is very useful when comparing phylogenetically distant taxa, it is also of interest to examine the genomes of very closely related microorganisms this allows a more quantitative approach for examining the relationships between genotype and phenotype complete genome sequences have been determined for two species of the genus Chlamydia (pneumoniae and trachomatis) although the overall genome structure was quite similar, C.pneumoniae contained an additional 214 genes most of which have an unknown function two strains of the bacterium Helicobacter pylori have been completely sequenced (26695 and J99) overall the two strains were very similar genetically with only 6% of genes being specific to each strain
 although the overall genome structure was quite similar, C.pneumoniae contained an additional 214 genes most of which have an unknown function. two strains of the bacterium Helicobacter pylori have been completely sequenced (26695 and J99) overall the two strains were very similar genetically with only 6% of genes being specific to each strain.")
71
Case study - Neisseria meningitits
N. meningititis causes bacterial meningitis and is therefore an important pathogen genome is 2.2 megabases in size 2121 ORF’s were identified with many having extremely variable G+C% (recently acquired genes) many of these recently acquired genes are identified as cell surface proteins there is a remarkable abundance and diversity of repetitive DNA sequences nearly 700 neisserial intergenic mosaic elements (NIME’s) - 50 to 150 bp repeat elements these repeat elements may be involved in enhancing recombinase specific horizontal gene transfer
 many of these recently acquired genes are identified as cell surface proteins. there is a remarkable abundance and diversity of repetitive DNA sequences. nearly 700 neisserial intergenic mosaic elements (NIME’s) - 50 to 150 bp repeat elements. these repeat elements may be involved in enhancing recombinase specific horizontal gene transfer.")
72
Case study - Borellia burgdorferi
B. burgdorferi is a spirochaete which causes Lyme disease it has a 0.91 megabase linear genome and at least 17 linear and circular plasmids which total 0.53 megabases 853 predicted ORF’s identified - these encode a basic set of proteins for DNA replication, transcription, translation and energy metabolism no genes encoding proteins involved in cellular biosynthetic reactions were identified - appears to have evolved via gene loss from a more metabolically competent precursor there is significant amount of genetic redundancy in the plasmid sequences although a biological role has not been determined it is possible the these plasmids undergo frequent homologous recombination in order to generate antigenic variation in surface proteins

73
What can we learn from microbial genomes?
Comparative Genomics: Multiple Pathogenecity Associated Islands (PAI) of 4 uropathogenic E.coli strains against the backdrop of E. coli strain K-12. The PAIs of 25 to 190 k, are inserted within or adjacent to tRNA genes & contain a different % GC content to the genomic DNA. Transfer mechanism(s)? pheR ~25 kb selC 70 kb pheV >170 kb thrw E. coli K-12 Chromosome 94 min 97 min 64 min 27 min 5.6 min 44 min 536 Strain # CFT073 J96 535 82 min leuX 190 kb metV 60 kb asnT 45 kb
 of 4 uropathogenic E.coli strains against the backdrop of E. coli strain K-12. The PAIs of 25 to 190 k, are inserted within or adjacent to tRNA genes & contain a different % GC content to the genomic DNA. Transfer mechanism(s) pheR. ~25 kb. selC. 70 kb. pheV. >170 kb. thrw. E. coli K-12. Chromosome. 94 min. 97 min. 64 min. 27 min. 5.6 min. 44 min Strain # CFT073. J min. leuX. 190 kb. metV. 60 kb. asnT. 45 kb.")
74
What can we learn from microbial genomes?
Another case study of a microbial genome

75
Summary Microbial genome sequencing and analysis is a rapidly expanding and increasingly important strand of microbiology important information about the specific adaptations and evolution of an organism can be determined from genome sequencing however, genome sequencing merely a strong starting point on road to completely understanding the biology of microorganisms further characterisation of ORF’s of unknown function, in combination with gene expression analysis and proteomics is required

76
SECTION IV. The Biology, Methods for Detection, Identification & Quantitation of Water-borne Pathogens

77
1. The Biomolecules & Molecular Biology of Cells
CONTENT 1. The Biomolecules & Molecular Biology of Cells 2. Biomolecule Based Technics 3. The Biology & Detection Methods of Some Pathogens 4. Modern Techologies a. Polymerase Chain Reaction (PCR) b. Real Time PCR c. Pulse Field Gel Electrophoresis d. New High Throughput Methods
 b. Real Time PCR. c. Pulse Field Gel Electrophoresis. d. New High Throughput Methods.")
78
1. The biomolecules & molecular biology of cells

79
DNA RNA PROTEINS TOTAL DNA: Mol%G+C rRNA sequencing
Restriction Patterns (RFLP, PFGE) Genome size DNA homology rRNA sequencing LMW RNA profiles 23S 16S DNA SEGMENTS: PCR based fingerprinting (ribotyping, ARDDRA, RAPD, AFLP, AP-PCR, rep-PCR) DNA probes DNA sequencing 5S Plasmid DNA tRNA DNA Electrophoretic patterns of total cellular or cell envelope proteins (1D or 2D) Multienzyme patterns (multilocus enzyme electrophoresis) PROTEINS mRNA CHEMOTAXONOMIC MARKERS EXPRESSED FEATURES Cellular fatty acids (FAME) Mycolic acids Polar lipids Quinones Polyamines Cell wall compounds Exopolysaccharides Morphology Physiology (Biolog, API, …) Enzymololgy (APIzyme) Serology (monoclonal, polyclonal) DIFFERENT TARGETS FOR MICROBIAL IDENTIFICATION
 Genome size. DNA homology. rRNA sequencing. LMW RNA profiles. 23S. 16S. DNA SEGMENTS: PCR based fingerprinting (ribotyping, ARDDRA, RAPD, AFLP, AP-PCR, rep-PCR) DNA probes. DNA sequencing. 5S. Plasmid DNA. tRNA. DNA. Electrophoretic patterns of total cellular or cell envelope proteins (1D or 2D) Multienzyme patterns (multilocus enzyme electrophoresis) PROTEINS. mRNA. CHEMOTAXONOMIC MARKERS. EXPRESSED FEATURES. Cellular fatty acids (FAME) Mycolic acids. Polar lipids. Quinones. Polyamines. Cell wall compounds. Exopolysaccharides. Morphology. Physiology (Biolog, API, …) Enzymololgy (APIzyme) Serology (monoclonal, polyclonal) DIFFERENT TARGETS FOR MICROBIAL IDENTIFICATION.")
80
Selection of Different Targets
New Selection of Different Targets Cell surface: proteins (receptors, porins, siderophores): 200,000 / cell Polysaccharides (LPS): 2 million in Gram –ve cells Cytoplasmic: Ribosomes (rproteins & rRNA): 20,000 in dividing cells. Non-ribosomal RNA: 100 – 1,000 / cell (depending on rate of transcription or rate of degradation) Non-iobosomal proteins (RNA polymerase): 3,000 / cell The target concentrations in a 1 ml sample will be 0.03 attomolar(3,000 molecules / cell) to 20 attomolar (2 million / cell)
: 200,000 / cell. Polysaccharides (LPS): 2 million in Gram –ve cells. Cytoplasmic: Ribosomes (rproteins & rRNA): 20,000 in dividing cells. Non-ribosomal RNA: 100 – 1,000 / cell (depending on rate of transcription or rate of degradation) Non-iobosomal proteins (RNA polymerase): 3,000 / cell. The target concentrations in a 1 ml sample will be 0.03 attomolar(3,000 molecules / cell) to 20 attomolar (2 million / cell)")
81
2. Biomolecule based Technology

82
Technique Family Genus Species Strain Restriction Fragment Length Polymorphism (RFLP) Low frequency restriction fragment analysis (PFGE) Phage and bacteriocin typing Serological techniques Ribotyping DNA amplification (AFLP, AP-PCR, RAPD) Zymograms (multilocus enzymes) Total cellular protein electrophoretic patterns DNA homology Mol% G+C DNA amplification (ARDRA) tDNA-PCR Chemotaxonomic markers Cellular fatty acid fingerprinting (FAME) rDNA / rRNA sequencing DNA probes DNA sequencing Highthrougput assays (Microarrays, Cantilever arrays) The limits of resolution of various techniques in microbial identification
 Zymograms (multilocus enzymes) Total cellular protein electrophoretic patterns. DNA homology. Mol% G+C. DNA amplification (ARDRA) tDNA-PCR. Chemotaxonomic markers. Cellular fatty acid fingerprinting (FAME) rDNA / rRNA sequencing. DNA probes. DNA sequencing. Highthrougput assays (Microarrays, Cantilever arrays) The limits of resolution of various techniques in microbial identification.")
83
3. The biology & detection methods of some pathogens

84
Virulence Factors (VF) of Water-borne Pathogens
VF encoded by genes their presence makes the microbe pathogenic Most E. coli in human/animals not pathogenic as VF genes are absent Aquatic environment may be reservoir where “virulence breed” by Plasmids/phage transmissision of VF (E. coli, Y.eneterocolitica & A. hydrophila) Viruses: Virus multiplication Most non-enveloped. Antigenic shift & drift in capsid proteins Bacteria: Salmonella – O (in LPS, endotoxin) & Vi (capsule) antigens E. coli may contain > 1 VFs: -EIEC enteroinvasive: Shiga-like toxin (SLT), -ETEC enterotoxigenic: Vibrio like heat labile/stable toxin (ST, LT), ID > 1 million cells. Interfere with Na & Cl across CM, travelers diarrhea. -EPEC, enteropathogenic: Adhesive VF for GI epithelia., infantile diarrhea in developing countries -EHEC, enterohemorrhagic: Shiga-like toxin (SLT), ID < 1000 cells, Since 1982, strain O157:H7 has affected 20,000 in US (>100 deaths), Found in ground beef & now in cider & fruit juices. Vibrio cholera: Cholera txin resides on plasmids which are transferred by phage
 Viruses: Virus multiplication. Most non-enveloped. Antigenic shift & drift in capsid proteins. Bacteria: Salmonella – O (in LPS, endotoxin) & Vi (capsule) antigens. E. coli may contain > 1 VFs: -EIEC enteroinvasive: Shiga-like toxin (SLT), -ETEC enterotoxigenic: Vibrio like heat labile/stable toxin (ST, LT), ID > 1. million cells. Interfere with Na & Cl across CM, travelers diarrhea. -EPEC, enteropathogenic: Adhesive VF for GI epithelia., infantile diarrhea in. developing countries. -EHEC, enterohemorrhagic: Shiga-like toxin (SLT), ID < 1000 cells, Since. 1982, strain O157:H7 has affected 20,000 in US (>100 deaths), Found in ground. beef & now in cider & fruit juices. Vibrio cholera: Cholera txin resides on plasmids which are transferred by phage.")
85
Detection in water supplies is a challenge
Protozoal Parasites: Detection in water supplies is a challenge Biology remains unstudied, biomarkers unavailable Methods have limitation & cannot differentiate: human species form animal species infectious forms from noninfectious forms Techniques such as Microscopy, PCR & RFLP of limited use for diagnostics Characteristics: Entamoeba histolytica: a long history as a waterborne pathogen (no US major outbreaks reported for decades, no major nonhuman reservoir) Cryptosporidium parvum: Major problem. Microsporidia: Ubiquitous parasite of insects, human & animals. Significance unknown.
 Cryptosporidium parvum: Major problem. Microsporidia: Ubiquitous parasite of insects, human & animals. Significance. unknown.")
86
Diagnostic Methods 1. Recovery and Concentration:
To increase pathogen concentration by physical, chemical or enrichments. 2. Purification & Separation: Methods use knowledge of pathogen size, shape, density etc surface properties (hydrophilicity, reactivity, receptors), growth stages (spores, capsules, ooocytes) for this. 3. Assay & Characterisation: Differentiate pathogens from all others: Qualitative / quantitative, viable / nonviable. Cultural, immunological and NA based [ NA amplification (PCR), NA identification & characterisation methods (hybridisation by gene probes, RFLP & nucleotide sequencing)]. NA based methods are specific & sensitive but incapable of differentiating live but inactivated cells from dead / noninfectious ones.
, growth stages (spores, capsules, ooocytes) for this. 3. Assay & Characterisation: Differentiate pathogens from all others: Qualitative / quantitative, viable / nonviable. Cultural, immunological and NA based [ NA amplification (PCR), NA identification & characterisation methods (hybridisation by gene probes, RFLP & nucleotide sequencing)]. NA based methods are specific & sensitive but incapable of differentiating live but inactivated cells from dead / noninfectious ones.")
88
4. Modern Techologies

89
a. Polymerase Chain Reaction (PCR)
")
90
Figure 1B Figure 1A Figure 1C DNA Fundamentals

91
A short video clip to show the principle of PCR

92
2. What is PCR? DNA replication in a tube (in vitro). Xeroxing (copying) of DNA. 3. The Components of PCR The basic components of a PCR reaction are - one or more molecules of target DNA two oligonucleotide primers - thermostable DNA polymerase - dNTPs 4. The Process of PCR Each PCR cycle requires three temperature steps to complete a round of DNA synthesis:

93
Cycle 1: The original DNA template will continue to be copied by the DNA polymerase until it stops or the process is interrupted by the start of the next cycle. Cycle 2: Amplicons of intermediate lengths produced Cycle 3: Amplicons of defined lengths will be produced. Cycle 4 onwards: Target sequence will be amplified exponentially The final number of copies of the target sequences is expressed as: (2n-2n)x where n = no of cycles, 2n = 1st product obtained after cycle 1 & 2nd products obtained after cycle 2 with undefined length and x= no. of copies of the original template
x. where n = no of cycles, 2n = 1st product obtained after cycle 1 & 2nd products obtained after cycle 2 with undefined length and. x= no. of copies of the original template.")
94
PCR target molecules accumulate as a function of cycle number with the exponential phase lasting for about 30 cycles under standard reactions conditions. The plateau phase results from limiting amounts of enzyme and reduced enzyme activity. The production of 1 billion copies of the specific targeted DNA from 1 template during the 30 cycles is theoretically possible but never practically achieved because of lack of 100% PCR efficiency. The products formed during the process could be mixtures of specific and non-specific products and these factors reduce PCR efficiency from the theoretical 100%.

95
5. The Factors Affecting PCR
I. Generalities: pipette water first, followed by the other ingredients. work “on ice” in order to minimise primers binding to the DNA template and to prevent functioning of the polymerase (even theoretically) prior to the first denaturing step. avoid aerosols while pipetting (or use aerosol-ressistant pipette tips) & work under laminar flow hoods. Be very accurate when dealing with small volumes. (Multiplex PCR of two different genomic DNA samples can be very susceptible to errors in pipetting). II Thermocyclers and PCR vials: The same PCR program will work slightly different on different thermocyclers (temperature and time profiles may differ) and therefore the PCR results using the same primer pair may vary. New PCR machine designs accommodate thin-walled 0.2 ml PCR vials (and/or 96 wells microtiter dishes). Contact between the metal and plastic is very good and aided by the downward pressure from the heated lid. Older machines accommodated 0.5 or 1.5 ml vials and the contact between the vials and the metal block is not always perfect because of slight differences in shape and wall thickness amongst manufacturers, often resulting in reduced or no amplification
 prior to the first denaturing step. avoid aerosols while pipetting (or use aerosol-ressistant pipette tips) & work under laminar flow hoods. Be very accurate when dealing with small volumes. (Multiplex PCR of two different genomic DNA samples can be very susceptible to errors in pipetting). II Thermocyclers and PCR vials: The same PCR program will work slightly different on different thermocyclers (temperature and time profiles may differ) and therefore the PCR results using the same primer pair may vary. New PCR machine designs accommodate thin-walled 0.2 ml PCR vials (and/or 96 wells microtiter dishes). Contact between the metal and plastic is very good and aided by the downward pressure from the heated lid. Older machines accommodated 0.5 or 1.5 ml vials and the contact between the vials and the metal block is not always perfect because of slight differences in shape and wall thickness amongst manufacturers, often resulting in reduced or no amplification.")
96
II. Denaturing temperature and time:
150mM NaCl decreases the melting (denaturing) temperatures of 91-97oC (not 100 oC) Taq polymerase has a half-life of 30 min at 95oC. Denaturation temp as short as possible 2-5 minutes initial denaturing step prior to the start of cycling is not necessary 1 min at 94oC (usually between 15 sec to 30 secs) avoids loss of Taq enzyme activity III. Choosing and Primer Design: 17-28 bases. Longer primers bp for multiplexing both primers have a close melting temperature or Tm of within 5 oC. G+C content of 40-60% (Tms between 55-80oC are preferred). primer sequence with 1-2 GC pairs at the start and end improves priming efficiency three or more Cs or Gs at the 3'-ends of primers may promote mispriming Check for primer-primer interactions: 3'-ends of primers not complimentary Check for primer self-complementarity (ability to form 2o structures such as hairpins) primer sequences checked against DNA database (using BLAST programs) for “uniqueness” Useful ON-LINE programs for primer design can be found at the following URLs Primer0.5: WebPrimer: Primer3: IV. Primer Annealing Temperature: Calculate Tm of primer using “rule of thumb” 4(G + C) + 2(A + T)oC. Temperature of annealing (Ta) should be about < 5oC below the lowest Tm of the pair of primers V. Extension or Polymerisation: Taq polymerase incorporates about 2000 nucleotides/minute at optimal temperature 72-78o C Rule of thumb “1 min for a 1 kb product, 2 min for a two kb”
 temperatures of 91-97oC (not 100 oC) Taq polymerase has a half-life of 30 min at 95oC. Denaturation temp as short as possible. 2-5 minutes initial denaturing step prior to the start of cycling is not necessary. 1 min at 94oC (usually between 15 sec to 30 secs) avoids loss of Taq enzyme activity. III. Choosing and Primer Design: bases. Longer primers bp for multiplexing. both primers have a close melting temperature or Tm of within 5 oC. G+C content of 40-60% (Tms between 55-80oC are preferred). primer sequence with 1-2 GC pairs at the start and end improves priming efficiency. three or more Cs or Gs at the 3 -ends of primers may promote mispriming. Check for primer-primer interactions: 3 -ends of primers not complimentary. Check for primer self-complementarity (ability to form 2o structures such as hairpins) primer sequences checked against DNA database (using BLAST programs) for uniqueness Useful ON-LINE programs for primer design can be found at the following URLs. Primer0.5: WebPrimer: Primer3: IV. Primer Annealing Temperature: Calculate Tm of primer using rule of thumb 4(G + C) + 2(A + T)oC. Temperature of annealing (Ta) should be about < 5oC below the lowest Tm of the pair of primers. V. Extension or Polymerisation: Taq polymerase incorporates about 2000 nucleotides/minute at optimal temperature 72-78o C. Rule of thumb 1 min for a 1 kb product, 2 min for a two kb")
97
Properties of some thermostable DNA polymerases:
Some Commercial thermostable DNA polymerases and their sources: Deep Vent (Pyrococcus GB-D) Recombinant Vent (Thermococcus litoralis) Recombinant UlTma (Thermotoga maritime) Recombinant Tth (Thermus thermophilus) Recombinant Amplitaq (Thermus aquaticus) Recombinant Amplitaq Stoffel (Thermus aquaticus) Recombinant Hot Tub – (Thermus flavus) Natural Pyrostase (Thermus flavus) Natural Tbr (Thermus brockianus) Natural Tfl (Thermus flavus) Natural Pfu – (Pyrococcus furiosus) Natural Pwo – (Pyrococcus wosei) Natural Properties of some thermostable DNA polymerases:
 Recombinant. Vent (Thermococcus litoralis) Recombinant. UlTma (Thermotoga maritime) Recombinant. Tth (Thermus thermophilus) Recombinant. Amplitaq (Thermus aquaticus) Recombinant. Amplitaq Stoffel (Thermus aquaticus) Recombinant. Hot Tub – (Thermus flavus) Natural. Pyrostase (Thermus flavus) Natural. Tbr (Thermus brockianus) Natural. Tfl (Thermus flavus) Natural. Pfu – (Pyrococcus furiosus) Natural. Pwo – (Pyrococcus wosei) Natural. Properties of some thermostable DNA polymerases:")
98
VII. Primer Amount in PCR:
VI. Reaction Volumes: thin walled, 0.2 ml plastic vials for 96 well thermocyclers have heated lids (no oil). Reaction volumes (5, 25 or 100 ul) okay PCR product yield is higher in 5 µL compared to 100 µL volumes (product can be visualised) VII. Primer Amount in PCR: nM each primer Purchased as mM; 0.5-1ml primer is sufficient for ml PCR reactions VIII. Template concentrations: Within limits, increasing primer and template concentration may improve the outcome of the PCR reaction, and should be considered as a way to optimize PCR reactions IX. Nucleotides (dNTP): Stock of 25 mM each stored as small aliquots (2-5 µl) at -20o C. Centrifuge long term stored solutions as water condenses on the walls changing conc Dilute stocks in buffered water (10mM Tris pH ) as acid pH hydrolysis dNTP to dNDP and dNMP X. Relationship between MgCl2 and dNTP concentration: 200µM dNTP each and 1.5mM MgCl2 is recommended with Taq polymerase, (Perkin Elmer Cetus). Theoretically µg of DNA is synthesised from 25 µl reaction. Besides magnesium bound by the dNTP and the DNA, Taq polymerase requires free magnesium. This is probably the reason why small increases in the dNTP concentrations can rapidly inhibit the PCR reaction (Mg gets "trapped") whereas increases in magnesium concentration often have positive effects.
. Reaction volumes (5, 25 or 100 ul) okay. PCR product yield is higher in 5 µL compared to 100 µL volumes (product can be visualised) VII. Primer Amount in PCR: nM each primer. Purchased as mM; 0.5-1ml primer is sufficient for ml PCR reactions. VIII. Template concentrations: Within limits, increasing primer and template concentration may improve the outcome of the PCR reaction, and should be considered as a way to optimize PCR reactions. IX. Nucleotides (dNTP): Stock of 25 mM each stored as small aliquots (2-5 µl) at -20o C. Centrifuge long term stored solutions as water condenses on the walls changing conc. Dilute stocks in buffered water (10mM Tris pH ) as acid pH hydrolysis dNTP to dNDP and dNMP. X. Relationship between MgCl2 and dNTP concentration: 200µM dNTP each and 1.5mM MgCl2 is recommended with Taq polymerase, (Perkin Elmer Cetus). Theoretically µg of DNA is synthesised from 25 µl reaction. Besides magnesium bound by the dNTP and the DNA, Taq polymerase requires free magnesium. This is probably the reason why small increases in the dNTP concentrations can rapidly inhibit the PCR reaction (Mg gets trapped ) whereas increases in magnesium concentration often have positive effects.")
99
Real Time detection of PCR products
XI. Adjuvants in PCR Reactions: Between 5-10% DMSO or glycerol promotes increase in PCR yield 0.8µg/µl BSA promotes better yield than DMSO or glycerol Gel electrophoresis for detecting PCR products Agarose Gels: NuSieve agarose separates short products better than the regular agarose. More expensive but use less for the same gel strength as regular agarose. All regular agarose, irrespective of the brand, behave the same 600 bp separation: Run very fast (3-4 h for a cm long 2-3% agarose gel). Bands are sharper Non-denaturing PAA gels: 6-10% PAA gels used for PCR products differing in only a few bp in length Denaturing PAA gels: 6% PAA/7M urea sequencing gel is used to separate radiolabeled multiplex PCR products Real Time detection of PCR products No gels required. Recent method. Relies on the ability of a dye, SYBR Green, to intercalate with double stranded amplicons produced during PCR, to produce fluorescence which is detected in a flurometer. (Dealt with in a subsequent section)
. Bands are sharper. Non-denaturing PAA gels: 6-10% PAA gels used for PCR products differing in only a few bp in length. Denaturing PAA gels: 6% PAA/7M urea sequencing gel is used to separate radiolabeled multiplex PCR products. Real Time detection of PCR products. No gels required. Recent method. Relies on the ability of a dye, SYBR Green, to intercalate with double stranded amplicons produced during PCR, to produce fluorescence which is detected in a flurometer. (Dealt with in a subsequent section)")
100
Distinguishing between PCR & Real Time PCR
New Distinguishing between PCR & Real Time PCR PCR Primer design & annealing PCR cycling parameters 30 cycles Detection by Gel electrophoresis RealTime-PCR Primer Design & annealing Probe Design internal to PCR amplicons & Annealing PCR Cycling Parameters 30 cycles Detection of fluorescence every cycle (annealing and / or extension) Subsequent Gel Electrophoresis (if necessary)
 Subsequent Gel Electrophoresis (if necessary)")
101
b. RealTime-PCR

102
Real Time PCR Introduction General Principles & Concepts
A. What are Fluorescent dyes? B. What is Fluorescence Resonance Energy Transfer (FRET)? C. Some commonly used flurophores for labeling probes D. Quantitating Fluorescence E. Improving Fluorescence Signal Detection (new) 3. Instruments LightCycler (Idaho Technologies Roche) B. Rotor-Gene (Corbett Research) C. iCycler (BioRad) D. Mx4000™ Multiplex Quantitative PCR System (Stratagene) E. ABI Prism 7700 (Perkin-Elmer-Applied-Biosystem) F. SmartCycler (Cephid)
 C. Some commonly used flurophores for labeling probes. D. Quantitating Fluorescence. E. Improving Fluorescence Signal Detection (new) 3. Instruments. LightCycler (Idaho Technologies Roche) B. Rotor-Gene (Corbett Research) C. iCycler (BioRad) D. Mx4000™ Multiplex Quantitative PCR System (Stratagene) E. ABI Prism 7700 (Perkin-Elmer-Applied-Biosystem) F. SmartCycler (Cephid)")
103
4. Types of probes & design
DNA binding dyes Oligonucleotide Hybridisation Probes I. Hydrolysis Probes (TaqMan) II. Strand Displacement Probes Roche Dual probe B. Hair Pin Probes Molecular Beacon Sunrise UniPrimer Scorpion Stem & Loop Duplex FRET Duplex C. Peptide Nucleic Acid Probes (PNA) 5. Applications
 II. Strand Displacement Probes. Roche Dual probe. B. Hair Pin Probes. Molecular Beacon. Sunrise UniPrimer. Scorpion. Stem & Loop. Duplex. FRET Duplex. C. Peptide Nucleic Acid Probes (PNA) 5. Applications.")
104
Introduction

105
What is Real Time PCR? Real Time PCR is a technique in which fluoroprobes bind to specific target regions of amplicons to produce fluorescence during PCR. The fluorescence, measured in Real Time, is detected in a PCR cycler with an inbuilt filter flurometer.

106
WHAT IS THE DIFFERENCE BETWEEN PCR AND REALTIME PCR ?
Fluorescence is measured every cycle The signal is proportional to the amount of product Observed in Real Time during PCR

107
WHAT CAN BE DONE WITH Real Time PCR? Specific quantification of:
DNA RNA Protein

108
General Principles & Concepts
2. General Principles & Concepts

109
2A. What are Fluorescent dyes?
New 2A. What are Fluorescent dyes? When a population of fluorochrome molecules is excited by light of an appropriate wavelength, fluorescent light is emitted. The light intensity can be measured using a flurometer or by measuring a pixel-by-pixel digital image of the sample. In the later case, image analysis software, makes it possible to view, measure, render, and quantitate the resulting image. Excitation and Emission: Fluorodyes absorb light at one ê level (wavelength) & thereby boosts an electron to a higher energy shell (an unstable, excited state). The excited electron falls back to the ground state and the flurophore re-emits light but at a second lower ê, longer wavelength. This shift makes it possible to separate excitation light from emission light with the use of optical filters. The wavelength (nm) where photon energy is most efficiently captured is defined as the Absorbancemax & the wavelength (nm) where light is most efficiently released is defined as the Emissionmax. The difference in absorbed & emitted wavelength = Stoke’s shift (). can be a large or small number depending on the loss of energy during fluorescence process.
 & thereby boosts an electron to a higher energy shell (an unstable, excited state). The excited electron falls back to the ground state and the flurophore re-emits light but at a second lower ê, longer wavelength. This shift makes it possible to separate excitation light from emission light with the use of optical filters. The wavelength (nm) where photon energy is most efficiently captured is defined as the Absorbancemax & the wavelength (nm) where light is most efficiently released is defined as the Emissionmax. The difference in absorbed & emitted wavelength = Stoke’s shift (). can be a large or small number depending on the loss of energy during fluorescence process.")
110
2A. What are Fluorescent dyes?(cont’d)
New 2A. What are Fluorescent dyes?(cont’d) The wavelegth range for which flurodyes absorb light is small (~ < 50nm) and light outside this range will not cause the molecule to fluoresce. 2. Linearity: Theintensity of the emitted fluorescent light is a linear function of the amount of fluorochrome present when the illuminating light has a constant wavelength and intensity (for example, using a controlled laser light source). The signal becomes nonlinear at very high fluorochrome concentrations. 3. Brightness: Fluorochromes differ in how much intensity they are capable of producing. This is important because a dull fluorochrome is a less sensitive probe than a bright fluorochrome. The brightness depends on two properties of the fluorochrome- Its ability to absorb light (extinction coefficient). The efficiency with which it converts absorbed light into emitted fluorescent light (quantum efficiency). 4. Environmental factors: Environmental conditions can affect the brightness or the wavelength of the absorption or emission peaks. Such fluorochromes are useful for analyzing changes in H+, Mg2+, or Ca2+ concentration & detecting lipids or double-stranded DNA. Photodestruction (photobleaching) of photosensitive dyes (eg fluorescein) is caused by intense light. Use antifade agents or lower the laser power
 The wavelegth range for which flurodyes absorb light is small (~ < 50nm) and light outside this range will not cause the molecule to fluoresce. 2. Linearity: Theintensity of the emitted fluorescent light is a linear function of the amount of fluorochrome present when the illuminating light has a constant wavelength and intensity (for example, using a controlled laser light source). The signal becomes nonlinear at very high fluorochrome concentrations. 3. Brightness: Fluorochromes differ in how much intensity they are capable of producing. This is important because a dull fluorochrome is a less sensitive probe than a bright fluorochrome. The brightness depends on two properties of the fluorochrome- Its ability to absorb light (extinction coefficient). The efficiency with which it converts absorbed light into emitted fluorescent light (quantum efficiency). 4. Environmental factors: Environmental conditions can affect the brightness or the wavelength of the absorption or emission peaks. Such fluorochromes are useful for analyzing changes in H+, Mg2+, or Ca2+ concentration & detecting lipids or double-stranded DNA. Photodestruction (photobleaching) of photosensitive dyes (eg fluorescein) is caused by intense light. Use antifade agents or lower the laser power.")
111
Fluorescent dyes have become the preferred method of detection for nucleic acids in Molecular Biology. They are used as single conjugated dyes to oligonucleotides for: Automated fluorescent DNA sequencing, Fluorescent genotyping & Terminal Fragment Restriction Length Polymorphism (TFRLF) AND As double or multiple conjugated dyes to oligonucleotides for simultaneous detection, identification and quantitative techniques in Real Time PCR (Molecular Beacons) based on the principle of Fluorescence Resonance Energy Transfer (FRET) or quenching.
 AND. As double or multiple conjugated dyes to oligonucleotides for simultaneous detection, identification and quantitative techniques in Real Time PCR (Molecular Beacons) based on the principle of Fluorescence Resonance Energy Transfer (FRET) or quenching.")
112
2B. What is Fluorescence Resonance Energy Transfer (FRET)?
Modified 2B. What is Fluorescence Resonance Energy Transfer (FRET)? FRET is a distance dependent interaction interaction between the excited states of 2 dye molecules in which excitation is transferred from a donor molecule to an acceptor molecule without emission of a photon
 FRET is a distance dependent interaction interaction between the excited states of 2 dye molecules in which excitation is transferred from a donor molecule to an acceptor molecule without emission of a photon.")
113
2B. FRET (cont’d): The Donor and Acceptor in close physical proximity ( Angstrom) can lead to FRET or Quenching hv (a) Physical proximity + hv D A (FRET +ve) hv D A D A (b) No physical proximity + hv (c) No hv Hybridization probes hv R hv Q R Q (d) Physical proximity + hv (e) No Physical proximity + hv (Quenching) (Quenching released) TaqMan & Beacon Probes
 Physical proximity + hv. D. A. (FRET +ve) hv. D. A. D. A. (b) No physical proximity + hv. (c) No hv. Hybridization probes. hv. R. hv. Q. R. Q. (d) Physical proximity + hv. (e) No Physical proximity + hv. (Quenching) (Quenching released) TaqMan & Beacon Probes.")
114
2C. Some Commonly used flurophores for labeling probes
FLUORESCEIN TAMARA CY 5 494 / 518 nm 650 / 690 nm TET CY 3 HEX TEXAS RED LC-RED 595 / 615 nm Consider the cost, ease of synthesis, proprietary, delivery time etc

115
2D. Quantitating Fluorescence
A flurometer exploits the principles of fluorescence to quantitate fluorescent (dye) molecules in the following way: A strong light source which produces light within a specific light range ( eg xenon arc lamp) is focused down to a tight beam. The tight beam of light is sent through a filter which removes most of the light outside of the target wavelength range for a particular fluorescent molecule. The filtered light beam passes through the liquid target sample striking some of the fluorescent molecules in the sample. Light emitted from the fluorescent molecules that is traveling orthogonal to the excitation light beam pass through a secondary filter that removes most of the light outside of the target wavelength range.
 molecules in the following way: A strong light source which produces light within a specific light range ( eg xenon arc lamp) is focused down to a tight beam. The tight beam of light is sent through a filter which removes most of the light outside of the target wavelength range for a particular fluorescent molecule. The filtered light beam passes through the liquid target sample striking some of the fluorescent molecules in the sample. Light emitted from the fluorescent molecules that is traveling orthogonal to the excitation light beam pass through a secondary filter that removes most of the light outside of the target wavelength range.")
116
The filtered light then strikes a photodetector or photomultiplier which allows the instrument to give a relative measurement of the intensity of the emitted light. Fluorescent molecules can be detected at concentrations below a level visible to the subjective human eye & as fluorescence intensity vs. concentration is a linear relationship, dye concentrations can be determined with a good degree of accuracy

117
2E. Improving Fluorescence Signal Detection
A number of ways are available to improve detection and measurement of the emitted fluorescent signal. a. Elimination of the excited light from the collection pathway by several methods: Orienting the excitation light path so that the light does not shine into the collection pathway. Inserting optical filters into the collection pathway to reject the excitation wavelength. Delaying collection until after a pulse of excitation light has disappeared. b. The fluorescent signal can also be enhanced by increasing the dwell time or by scanning the sample multiple times and mathematically processing the signals to reduce random noise. Such methods are useful and practical for increasing the sensitivity at the low end. c. A band-pass optical filter can be used to reject broad-spectrum background emissions. This type of filter rejects wavelengths shorter and longer than the selected band, while allowing wavelengths in the selected wavelength range (centered around the fluorescent emissions of the sample) to pass through to the collection pathway.
 to pass through to the collection pathway.")
118
2F. Advantages of Fluorescence (New)
Wide variety: Fluorochromes with a wide variety of characteristics are available, including fluorochromes that - Respond to pH or ion concentrations. Localize based on hydrophobic and hydrophilic interactions. Can be cross-linked to proteins, NA, lipids, or polysaccharides. Commercial available: Fluorochromes are available crosslinked to many other molecules (eg fluorescently labeled monoclonal and polyclonal antibodies with a choice of fluorochrome, fluorescently labeled enzyme substrates, such as fluorescent chloramphenicol for chloramphenicol acetyl transferase (CAT) assays and fluorescein digalactoside for b-galactosidase assays (lacZ gene). Multiple-label possibility: A significant advantage of fluorescent labeling over other methods is the possibility of recording the fluorescence of two or more fluorochromes separately using optical filters and a fluorochrome separation algorithm. Thus, components can be labeled specifically and identified separately in the same sample or lane (EG Real Time PCR applications)
 assays and fluorescein digalactoside for b-galactosidase assays (lacZ gene). Multiple-label possibility: A significant advantage of fluorescent labeling over other methods is the possibility of recording the fluorescence of two or more fluorochromes separately using optical filters and a fluorochrome separation algorithm. Thus, components can be labeled specifically and identified separately in the same sample or lane (EG Real Time PCR applications)")
119
2F. Advantages of Fluorescence (cont’d) (New)
Stability: The long shelf life compared to radiolabeled molecules. Fluoromonoclonal antibodies, oligonucleotide hybridization probes, and PCR primers can be stored for six months or more but antibodies labeled with 125I and 32P-labeled nucleotides and oligonucleotides become unusable in a month and a week respectively. Reagent batches can be standardized and used for extended periods in antigen localization, ELISAs, enzyme assays (such as CAT and kinase), PCR-based genetic typing assays (such as STR analyses), DNA sizing and quantitation, DNA sequencing, protein sizing and quantitation. Low hazard: Most fluorochromes are easy to handle, however, proper care should be observed (eg gloves) with DNA and RNA stains (mutagenic as they bind to these molecules). In contrast, lead or acrylic shields are required for handling radioactive materials and require special disposal protocols (eg shielded storage, long-term decay, or regulated land-fill disposal) Lower cost: The long shelf life and cheaper transportation and disposal costs for fluorochromes make fluorescent labeling, in many cases, less expensive than radiolabeling.
, PCR-based genetic typing assays (such as STR analyses), DNA sizing and quantitation, DNA sequencing, protein sizing and quantitation. Low hazard: Most fluorochromes are easy to handle, however, proper care should be observed (eg gloves) with DNA and RNA stains (mutagenic as they bind to these molecules). In contrast, lead or acrylic shields are required for handling radioactive materials and require special disposal protocols (eg shielded storage, long-term decay, or regulated land-fill disposal) Lower cost: The long shelf life and cheaper transportation and disposal costs for fluorochromes make fluorescent labeling, in many cases, less expensive than radiolabeling.")
120
Real Time PCR Instruments
3. Real Time PCR Instruments

121
General Description of Instruments
PCR cycler: 96 well format, 8 tube format, capillary (glass) Air or block heater Temeperature ramp, temperature gradient Fluorescence emission & detection : Fluorometer CCD camera Excitation source: xenon, halogen, laser Fluorescent Dye Labeling of: Oligonucleotides Peptide Nucleic acids (PNA) Near Infra Red Dyes: Available but no commercial labeling service available
 Air or block heater. Temeperature ramp, temperature gradient. Fluorescence emission & detection : Fluorometer. CCD camera. Excitation source: xenon, halogen, laser. Fluorescent Dye Labeling of: Oligonucleotides. Peptide Nucleic acids (PNA) Near Infra Red Dyes: Available but no commercial labeling service available.")
122
Idaho LightCycler Xenon Arc lamp (250-1000 continuous)
Glass capillaries + Air (not metal block) = rapid Idaho LightCycler
 = rapid. Idaho LightCycler.")
123
The Lightcycler performs PCR in small-volume glass capillary tubes, contained within a rotor-like carousel, that are heated and cooled in an airstream. The carousel is rotated past a blue light-emitting diode, and fluorescence is read by three photodetection diodes with different wavelength filters that allow the use of spectrally distinct fluorescent probes. Assays based on DNA-binding dyes, hydrolysis probes, molecular beacons and dual hybridisation probes are possible. Up to 32 reactions are typically carried out in 5–20 µl volumes and PCR is completed in less than 20 min. The fluorescence readings taken at every cycle of the PCR reaction are displayed immediately after each measurement, allowing amplification runs to be terminated or extended, as appropriate, during individual runs.

124
Rotor-Gene from Corbett Research
Dual Light source Excitation: 470 & 530 32 x 0.2 ml plastic tubes Air heated, centrifugal mixing Rotor-Gene from Corbett Research

125
iCycler from BioRad Real Time Detection 1a. Excitation filters
1b. Emission filters Tungsten halogen light source ( nm continuous) Microplate format Cycler iCycler from BioRad
 Microplate format. Cycler. iCycler from BioRad.")
126
Biorad Instruments have recently launched an optical module that fits their standard thermal cycler and transforms it into a real-time RT-PCR system. This instrument is capable of generating and detecting a wider range of excitation frequencies than either the ABI 7700 or the Lightcycler. At present, it can monitor up to four different fluorescent reporters at any one time and can be used for any one of of the alternative fluorescent RT-PCR strategies. Furthermore, unlike the ABI 7700 which scans its 96 samples sequentially, this instrument can scan up to 96 samples simultaneously, with a sampling frequency that can be defined by the user.

127
Mx4000™ Multiplex Quantitative PCR System from Stratagene
Quartz tungsten halogen lamp (excitation range of 350 to 750nm) 96 well plates Fast cycling (90 min) CCD camera for capturing fluorescence Mx4000™ Multiplex Quantitative PCR System from Stratagene
 96 well plates. Fast cycling (90 min) CCD camera for capturing fluorescence. Mx4000™ Multiplex Quantitative PCR System from Stratagene.")
128
The ABI Prism 7700 (Perkin-Elmer–Applied Biosystems) contains a built-in thermal cycler with 96-well positions, and is able to detect fluorescence between 500 nm and 660 nm. Fluorescence is induced during the PCR by distributing laser light to all 96 samples contained in thin-walled reaction tubes via a multiplexed array of optical fibres. The resulting fluorescent emission returns via the fibres and is directed to a spectrograph with a charge-coupled device (CCD) camera. Because each well is irradiated sequentially, the dimensions of the CCD array can be used for spectral resolution of the fluorescent light. This instrument can be used for assays based on DNA-binding dyes, molecular beacons and hydrolysis probes.
 camera. Because each well is irradiated sequentially, the dimensions of the CCD array can be used for spectral resolution of the fluorescent light. This instrument can be used for assays based on DNA-binding dyes, molecular beacons and hydrolysis probes..")
129
4. Probe types & Design

130
A. Fluorescent DNA Binding Dyes

132
B. Oligonucleotide Hybridisation Probes I. Hydrolysis Probes (TaqMan)
")
133
This strand is not shown below
TaqMan Probe R Q Forward Primer Reverse Primer This strand is not shown below Probe The TaqMan probe binds to ssDNA at a combined annealing and elongation step. It is degraded by the polymerase which releases the reporter dye (R) from the quencher (Q).
 from the quencher (Q).")
134
Designing TaqMan Probes
New Designing TaqMan Probes TaqMan® Probe Design: Keep the G-C content in the 30—80% range. Avoid runs of an identical nucleotide especially Guanine Do not put Gs on the 5' end. Select the strand that gives the probe more Cs than Gs. For single-probe assays, Tm should be 68—70 °C Primer Design: Choose the primers after designing the probe. Design the primers as close as possible to the probe without overlapping the probe. The Tm should be 58—60 °C. The five nucleotides at the 3' end should have no more than two G and/or C bases. NOTE: Applied Biosystems provide Primer Express® for design of primers and probes in real time with Real Time Quantitative PCR systems (7700, 5700)
")
135
B. Oligonucleotide Hybridisation Probes II. Strand Displacement Probes
A. Roche Dual probe

136
Microbe using identification16S rRNA genes
Adjacent probes

137
Designing Dual Adjacent Hybridisation Probes
New Designing Dual Adjacent Hybridisation Probes (i) Identify useful Primer / probe regions (use any of the Primer software) (ii) Check primer / probe specificity using Fasta against Genbank database (iii) Check Tm using (iv) Check propenisity of probe to self anneal using Oligo Selection Program (v) Probe Tm’s should be near equal and 5-10C greater than primer Tm’s (vi) The 3’ end of the upstream probe should be labeled by fluorescein, which serves as the donor in the FRET and blocks extension from the probe (vii) the 5’ end of the downstream probe should be labeled by Cy5, which serves as the acceptor in the FRET, and the 3’ end of the probe should be phosphorylated to block extension the probes should be separated by one base (viii) the probes should be placed on one strand near a primer on the opposite strand.
 Identify useful Primer / probe regions (use any of the Primer software) (ii) Check primer / probe specificity using Fasta against Genbank database. (iii) Check Tm using (iv) Check propenisity of probe to self anneal using Oligo Selection Program. (v) Probe Tm’s should be near equal and 5-10C greater than primer Tm’s. (vi) The 3’ end of the upstream probe should be labeled by fluorescein, which serves as the donor in the FRET and blocks extension from the probe. (vii) the 5’ end of the downstream probe should be labeled by Cy5, which serves as the acceptor in the FRET, and the 3’ end of the probe should be phosphorylated to block extension the probes should be separated by one base. (viii) the probes should be placed on one strand near a primer on the opposite strand.")
139
FITC probe Cy5 probe Forward PCR primer Reverse PCR primer Designing rRNA gene directed fluorroprobes for detection & identification of Campylobacter & Arcobacter by Real Time PCR

140
2 1 Figure 1: Continuous monitoring of fluorescence during PCR in which DNA templates from A. butzleri ATCC (--), C. jejuni ATCC (-+-) and A. skirrowii ATCC (-х-) show a significant increase in fluorescence emission whereas templates from E. coli (--), C. upsaliensis (--) and C. hyointestinalis (-o-) show only a marginal increase when compared to no DNA template control (-◊-) which shows no increase. Template DNA was prepared using the rapid boiling method Figure 2. Derivative melting curves (-dF/dT) determined by the dissociation of fluorogenic adjacent hybridisation probes from the target amplicons enables discrimination of A. butzleri ATCC (Tm 68 oC), A. skirrowii (Tm 64 oC), C. jejuni ATCC and C. coli (Tm \ 66 oC) from each other. E. coli, C. upsaliensis, and C. hyointestinalis and template DNA produce no Tm.
, C. jejuni ATCC (-+-) and A. skirrowii ATCC (-х-) show a significant increase in fluorescence emission whereas templates from E. coli (--), C. upsaliensis (--) and C. hyointestinalis (-o-) show only a marginal increase when compared to no DNA template control (-◊-) which shows no increase. Template DNA was prepared using the rapid boiling method. Figure 2. Derivative melting curves (-dF/dT) determined by the dissociation of fluorogenic adjacent hybridisation probes from the target amplicons enables discrimination of A. butzleri ATCC (Tm 68 oC), A. skirrowii (Tm 64 oC), C. jejuni ATCC and C. coli (Tm \ 66 oC) from each other. E. coli, C. upsaliensis, and C. hyointestinalis and template DNA produce no Tm.")
141
Other Virulence Factor genes

142
Forward PCR primer Cy5 probe Reverse PCR primer Designing virulence gene directed fluorroprobes for detection, identification & differentiation of Campylobacter coli & Campylobacter jejuni from other species by Real Time PCR

143
2 1 Figure-1- Real time detection Real time detection of hippuricase gene for Campylobacter jejuni (-■-), Campylobacter coli (-▲-), Campyloacter hyointestinalis (-×-),Campylobacter upsaliansis(--),E. coli (-●-) and Negative control (-+-) (No template Figure 2: Melting temperature of hippuricase gene for Campylobacter species
, Campylobacter coli (-▲-), Campyloacter hyointestinalis (-×-),Campylobacter upsaliansis(--),E. coli (-●-) and Negative control (-+-) (No template. Figure 2: Melting temperature of hippuricase gene for Campylobacter species.")
144
Quantitation of gene copy numbers

145
B. Oligonucleotide Hybridisation Probes II. Strand Displacement Probes
B. Hair Pin Probes Molecular Beacon Sunrise UniPrimer Scorpion Stem & Loop Duplex FRET Duplex

146
The loop consists of target specific nucleotide (probe) sequences
MOLECULAR BEACONS Molecular Beacons are hairpin structures composed of a nucleotide base paired stem and a target specific nucleotide loop. The loop consists of target specific nucleotide (probe) sequences The stem is formed by annealing of complementary nucleotide bases of the probe sequence. A fluorescent moiety (reporter)is attached to one end of the arm and a non-fluorescent quenching moiety is attached to the other arm. The stem keeps both the moieties in close proximity so that fluorescence is quenched (Loop) Stem
 sequences. The stem is formed by annealing of complementary nucleotide bases of the probe sequence. A fluorescent moiety (reporter)is attached to one end of the arm and a non-fluorescent quenching moiety is attached to the other arm. The stem keeps both the moieties in close proximity so that fluorescence is quenched. (Loop) Stem.")
147
Primer molecular beacon
5’ 3’ Q 5’3’ 3’5’ R Denaturation Primer molecular beacon annealing Extension Operation of Molecular Beacon (MB): MB is non-fluorescent due to close proximity of the non-fluorescent quencer (Q) and the fluorescent Reporter. However when the probe denatures and the loop anneals to the target sequence of the amplicon, a conformational reorganization occurs separating the quencher from the fluorophore and thereby producing fluorescence which is proportional to the amplicons produced during PCR
![]()
148
Q SUNRISE UNIPRIMER PROBE
Similar to Molecular Beacon except that the stem contains a poly A (15 mer) tai. This tail is complimenatry to the polyT tail of one f the primers. Q AAAAAAAAAAAAAAA PolyA Tail
 tai. This tail is complimenatry to the polyT tail of one f the primers. Q. AAAAAAAAAAAAAAA. PolyA Tail.")
149
Sunrise UniPrimer Probe is a modification of Molecular Beacon
Primer with polyT tail TTTTTTTTTTTTTTT Sunrise Probe with polyA tail binds to the primer polyT tail at annealing. TTTTTTTTTTTTTTT AAAAAAAAAAAAAA Q R hv Q R AAAAAAAAAAAAAA The Sunrise probe changes conformation during denaturation & quenching by DABCYL is removed allowing FITC to fluoresce Sunrise UniPrimer Probe is a modification of Molecular Beacon
![]()
150
Scorpion stem-loop format
The template & probe denature The primer is part of the Scorpion probe Scorpion stem-loop format Primer, stopper to prevent read PCR through, probe sequence, fluorophore & quencher (detection system). The primer is extended The primer binds to the target The probe binds to the complimentary sequence of the DNA
. The primer is extended. The primer binds. to the target. The probe binds to the complimentary sequence of the DNA.")
151
Duplex Scorpion Format
Similar to the Ste-loop Scorpion except the probe sequence is part of the stem. There is no loop in this case.

152
FRET Duplex Scorpions with 3 different versions of the quencher oligonucleotides

153
Designing Stem Loop Molecular Beacon (MB) Probes New
In general, design complexty: Dual adjacent > Taqman > Stem Loop Ideally, MBs should hybridise at their annealing temps (fluorescent) & free MBs should be closed (nonfluorescent) Use Oligo4.0 or “percent GC rule” to calculate that the loop sequence length (usually nucleotides) is such that it dissociates from its target at temperatures 7-10 oC higher then the annealing temp of the PCR. Add two complimentary arms on either side of the loop probe sequence. (usually 5-7 nucleotides; 5 GC rich stems melt between 55 & 60, 6 between 60 & 65 and 7 between 65 & 70). In order that it remains closed in the absence of the target, the length & GC content should be 7-10 oC higher then the annealing temp of the PCR. The melting temperature of the stem cannot be predicted by the “GC rule” as the stems forms by an intramolecular hybridisation event There should be no in between conformational changes, ie should always be the intended hairpin structure an d nothing in between. Commercial program available for making MB probes. ..\..\My Documents\My Pictures\BD100Tour.exe
![]()
155
Probe Detection of the different fluorescent probes during Real Time PCR
, Dual probe

156
SOME REALTIME-PCR APPLICATIONS
Simultaneous identification, detection and quantitation of pathogenes in human/food/water/animal samples Gene expression analysis (splicing variants for example) Single Nucleotide Polymorphism (SNP) analysis Protein expression analysis Chromosome aberrations
 Single Nucleotide Polymorphism (SNP) analysis. Protein expression analysis. Chromosome aberrations.")
157
Application: Bacterial Pathogen detection
Listeria monocytogenes Campylobacter jejuni group Arcobacter group Leptospira group Application: Bacterial Non-Pathogen detection Thermoanaerobacter species Caloramator species Fervidobacterium species

158
Advantages of Adjacent Probe Technique with Real Time PCR (Idaho -> Roche):
1. Rapid requiring < 30 mins in a Light Cycler 2. rRNA and / or rRNA genes can be used = flexible 3. Simultaneous detection, identification & quantitation 4. PCR primer design + probe design = extremely specific assays possible 5. Different flurodyes available. Multiplexing possible 6. Population dynamics in an ecosystem can be followed 7. Forms a powerful tool when used in conjunction with rRNA sequencing & FISH

159
c. Pulse Field Gel Electrophoresis
(PFGE)
")
160
Pulsed Field Gel Electrophoresis (PFGE)
agarose gel electrophoresis is a fundamental technique in molecular biology but is generally unable to resolve fragments greater than 20 kilobases in size (whole microbial genomes are usually greater than 1000 kilobases in size) PFGE (pulsed field gel electrophoresis) is a adaptation of conventional agarose gel electrophoresis that allows extremely large DNA fragments to be resolved (up to megabase size fragments) essential technique for estimating the sizes of whole genomes/chromosomes prior to sequencing and is necessary for preparing large DNA fragments for large insert DNA cloning and analysis of subsequent clones also a commonly used and extremely powerful tool for genotyping and epidemiology studies for pathogenic microorganisms
 PFGE (pulsed field gel electrophoresis) is a adaptation of conventional agarose gel electrophoresis that allows extremely large DNA fragments to be resolved (up to megabase size fragments) essential technique for estimating the sizes of whole genomes/chromosomes prior to sequencing and is necessary for preparing large DNA fragments for large insert DNA cloning and analysis of subsequent clones. also a commonly used and extremely powerful tool for genotyping and epidemiology studies for pathogenic microorganisms.")
161
Principle of PFGE two factors influence DNA migration rates through conventional gels - charge differences between DNA fragments - ‘molecular sieve’ effect of DNA pores DNA fragments normally travel through agarose pores as spherical coils, fragments greater than 20 kb in size form extended coils and therefore are not subjected to the molecular sieve effect the charge effect is countered by the proportionally increased friction applied to the molecules and therefore fragments greater than 20 kb do not resolve PFGE works by periodically altering the electric field orientation the large extended coil DNA fragments are forced to change orientation and size dependent separation is re-established because the time taken for the DNA to reorient is size dependent

162
Principle of PFGE

163
Principle of PFGE the most important factor in PFGE resolution is switching time, longer switching times generally lead to increased size of DNA fragments which can be resolved switching times are optimised for the expected size of the DNA being run on the PFGE gel switch time ramping increases the region of the gel in which DNA separation is linear with respect to size a number of different apparatus have been developed in order to generate this switching in electric fields however most commonly used in modern laboratories are FIGE (Field Inversion Gel Electrophoresis) and CHEF (Contour-Clamped Homogenous Electrophoresis)
 and CHEF (Contour-Clamped Homogenous Electrophoresis)")
164
CHEF Switch Time Electric Field 1 Electric Field 2 - - - - - - - - + + + + + + + +

165
Preparation of DNA for PFGE
ideally a genomic DNA preparation that contains a high proportion of completely or almost completely intact genome copies would be suitable for PFGE conventional means of DNA preparation are unsuitable for PFGE as mechanical shearing and low-level nuclease activity will result in fragmented DNA with an average size much smaller than an entire microbial genome (usually less than 200 kb in size) the solution to this is to prepare genomic DNA from whole cells in a semisolid matrix (ie. agarose) that eliminates mechanical shearing a very high concentration of EDTA is also used at all times in order to eliminate all nuclease activity
 the solution to this is to prepare genomic DNA from whole cells in a semisolid matrix (ie. agarose) that eliminates mechanical shearing. a very high concentration of EDTA is also used at all times in order to eliminate all nuclease activity.")
166
Preparation of DNA for PFGE
1) intact cells are mixed with molten LMT agarose and set in a mold forming agarose ‘plugs’ 2) enzymes and detergents diffuse into the plugs and lyse cells 3) proteinase K diffuses into plugs and digests proteins 4) if necessary restriction digests are performed in plugs (extensive washing or PMSF treatment is required to remove proteinase K activity) 5) plugs are loaded directly onto PFGE and run
 intact cells are mixed with molten LMT agarose and set in a mold forming agarose ‘plugs’ 2) enzymes and detergents diffuse into the plugs and lyse cells. 3) proteinase K diffuses into plugs and digests proteins. 4) if necessary restriction digests are performed in plugs (extensive washing or PMSF treatment is required to remove proteinase K activity) 5) plugs are loaded directly onto PFGE and run.")
167
Preparation of DNA for PFGE
for restriction digests, conventional enzymes are unsuitable as they cut frequently on an entire genome sequence producing DNA fragments that are far too small ‘rare cutter’ restriction endonucleases cut genomic DNA with far less frequency than conventional restriction enzymes such as HindIII, BamHI etc. many rare cutter RE’s have 6-bp (or longer) recognition sites eg. NotI GCGGCCGC in many cases the frequency of cutting is highly species dependent eg. BamHI will cut far less frequently on a low GC% genome when compared to a intermediate or high GC content genome suitable rare cutter enzymes therefore have to be determined experimentally for each new species being studied
 recognition sites eg. NotI GCGGCCGC. in many cases the frequency of cutting is highly species dependent eg. BamHI will cut far less frequently on a low GC% genome when compared to a intermediate or high GC content genome. suitable rare cutter enzymes therefore have to be determined experimentally for each new species being studied.")
168
d. New High Throughput Methods

169
a. DNA MicroArrays

170
DNA Microarray a completely annotated microbial genome sequence, whilst a powerful scientific tool, still doesn’t provide all of the information needed to understand the complete biology of an organism as it essentially a static picture of the genome for truly complete characterisation, the dynamic nature of gene expression within a microbial cell needs to be determined microarray technology allows whole organism gene expression to be investigated PCR products of every gene from a complete genome sequence are bound in a high density array on a glass slide these arrays are probed with fluorescently labelled cDNA prepared from whole RNA under specific environmental conditions the level of cDNA for each ORF is then quantified using high resolution image scanners

171
DNA MICROARRAYS TECHNIQUES:
The development based on bioinformatics knowledge genes & genomes; High throughput & can analysise complex gene expression profiles There are different formats for DNA high density microarrays: cDNA arrays (Stanford University development 1999): 0.5 – 5kb Oligonucleotide synthesised (Genechip®) arrays (Affymetrix, 1998): base Oligomers / PNA, in situ or spotted An example of how a microarray is made by in situ synthesis approach is shown as a movie. ..\..\My Documents\GeneChip.mov
: 0.5 – 5kb. Oligonucleotide synthesised (Genechip®) arrays (Affymetrix, 1998): base. Oligomers / PNA, in situ or spotted. An example of how a microarray is made by in situ synthesis approach is shown as a movie. ..\..\My Documents\GeneChip.mov.")
172
STEPS IN THE DNA ARRAY TECHNIQUE:
Probe Selection - cDNA / oligo with known identify: Small oligos, cDNA, chromosome Chip Fabrication – Putting probes on the chip: photolithography, pipette, drop-touch, piezoelectric (inkjet), electric Target – fluroscently labeled sample: RNA (mRNA) to cDNA Assay: Hybridisation, ligase, base addition, electric, electrophoresis, fluocytometry, PCR-DIRECT, TaqMan Readout: Flurorescence Informatics: Robotic controls, image processing, DBMA, WWW, bioinformatics EXAMPLES: BioMerieux is developing for a water company a 4 h fecal indicator test using Affymetrix technology 1cm2 has 400k oligonucleotide probes, small volumes of sample required limits the usefulness TaqMan type: Leptospira for WHO regional reference laboratory, Campylobacter & Arcobacter for QHSS, Brisbane.
, electric. Target – fluroscently labeled sample: RNA (mRNA) to cDNA. Assay: Hybridisation, ligase, base addition, electric, electrophoresis, fluocytometry, PCR-DIRECT, TaqMan. Readout: Flurorescence. Informatics: Robotic controls, image processing, DBMA, WWW, bioinformatics. EXAMPLES: BioMerieux is developing for a water company a 4 h fecal indicator test using Affymetrix technology. 1cm2 has 400k oligonucleotide probes, small volumes of sample required limits the usefulness. TaqMan type: Leptospira for WHO regional reference laboratory, Campylobacter & Arcobacter for QHSS, Brisbane.")
173
An example of Microarray hybridisation
a microarray containing 97% of the predicted ORF’s from Mycobacterium tuberculosis was used to investigate the response to the antituberculosis drug isoniazid (INH) INH was found to induce several genes related to outer lipid envelope biosynthesis – consistent with the drugs physiological mode of action a number of additional genes were also induced which may provide potential drug targets in the future
 INH was found to induce several genes related to outer lipid envelope biosynthesis – consistent with the drugs physiological mode of action. a number of additional genes were also induced which may provide potential drug targets in the future.")
174
INH untreated - green INH treated - red Overlay Yellow = Red + Green (no change in expression) Green (untreated controls) ie expressed without INH treatment Red = expressed as a result of INH treatment The effect of Isoniazid (INH) on the gene expression of Mycobacterium tuberculosis using DNA microarray technique
 ie expressed without INH treatment. Red = expressed as a result of INH treatment. The effect of Isoniazid (INH) on the gene expression of Mycobacterium tuberculosis using DNA microarray technique.")
175
The Future of DNA Microarrays New
1. Studies on the mechanism of toxicity of drugs to humans: INH is very safe, but like any medicine it can sometimes cause side effects. (yellowish skin, dark urine, vomiting, loss of appetite, nausea, changes in eyesight, unexplained fever, unexplained fatigue & stomach cramps). Human DNA arrays can be used to investigate the mechanism of toxicity on human which may not be possible using animal models. 2. Studies on cyanobacterial toxins extracted from nature blooms: A human DNA array can be used for testing water which has been contaminated by cyanobacterial blooms before and after treatment. This will provide useful information on exposure levels (time & concentration). 3. The role of “uncultured” viruses on different human cell lines: This will provide a rapid method for identifying the most susceptible cell lines that can be used to isolate the “offending” pathogen.
. Human DNA arrays can be used to investigate the mechanism of toxicity on human which may not be possible using animal models. 2. Studies on cyanobacterial toxins extracted from nature blooms: A human DNA array can be used for testing water which has been contaminated by cyanobacterial blooms before and after treatment. This will provide useful information on exposure levels (time & concentration). 3. The role of uncultured viruses on different human cell lines: This will provide a rapid method for identifying the most susceptible cell lines that can be used to isolate the offending pathogen.")
176
Cantilever arrays

177
What are cantilever arrays?
Cantilever arrays are produced by microfabrication in silicon using dry- and wet-ething techniques. The cantilevers are 500 µm long, 100 µm wide and about 1 µm thick. The spring constant is 20 milliNewton per meter, resulting in a resonance frequency of about 4 kHz. The reproducibility of the resonance frequency from cantilever to cantilever within the array is better than 2%. Owing to their high flexibility, such cantilevers are appropriate for measuring tiny changes in surface stress. For such applications as mass determination, we have designed special cantilevers with a thickness of about 8 µm, producing a resonance frequency of around 50 kHz.

178
Cantilevers are used for imaging in scanning force microscopy but is now being tested as a nanotech sensor. A thin flexible beam made of silicon coated with a sensor layer serves as a chemical sensor. Eight cantilevers aligned in a row form a nanomechanical cantilever sensor array, which can detect small amounts of analytes via very specific reactions. The analyte can also be characterized via its diffusion properties through the coating, e.g. a polymer layer. Nanomechanical cantilever array sensor If analyte molecules dock on the surface of the cantilevers the surface stress at the interface changes, causing the cantilever to bend.The amount of bending is quantitated.

179
DNA hybridisation cantilever array
The binding of two complementary single stranded oligonucleotides can be observed in a setup of two cantilevers, each functionalized with a different synthetic oligonucleotide (red and blue). If the complementary oligonucleotide (green) is injected, it binds preferably to the red oligomer, but not to the blue one. This hybridization process involves bending of the cantilever due to steric and charging effects. If the complementary sequence to the blue strand is injected, the second cantilever bends.
. If the complementary oligonucleotide (green) is injected, it binds preferably to the red oligomer, but not to the blue one. This hybridization process involves bending of the cantilever due to steric and charging effects. If the complementary sequence to the blue strand is injected, the second cantilever bends.")
180
Thank you for your attention

Similar presentations

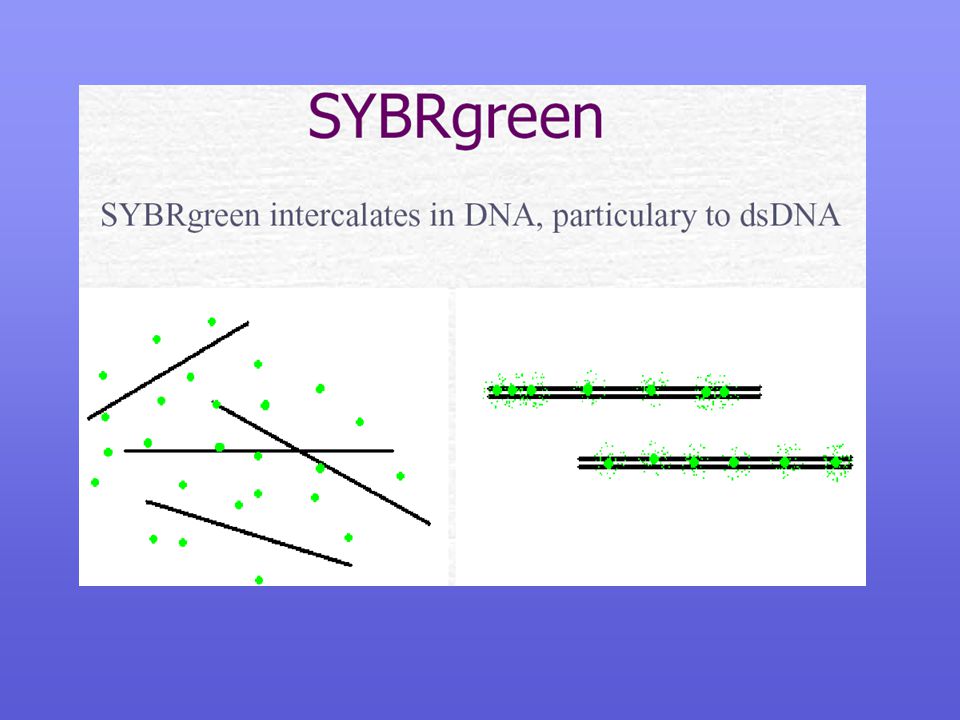
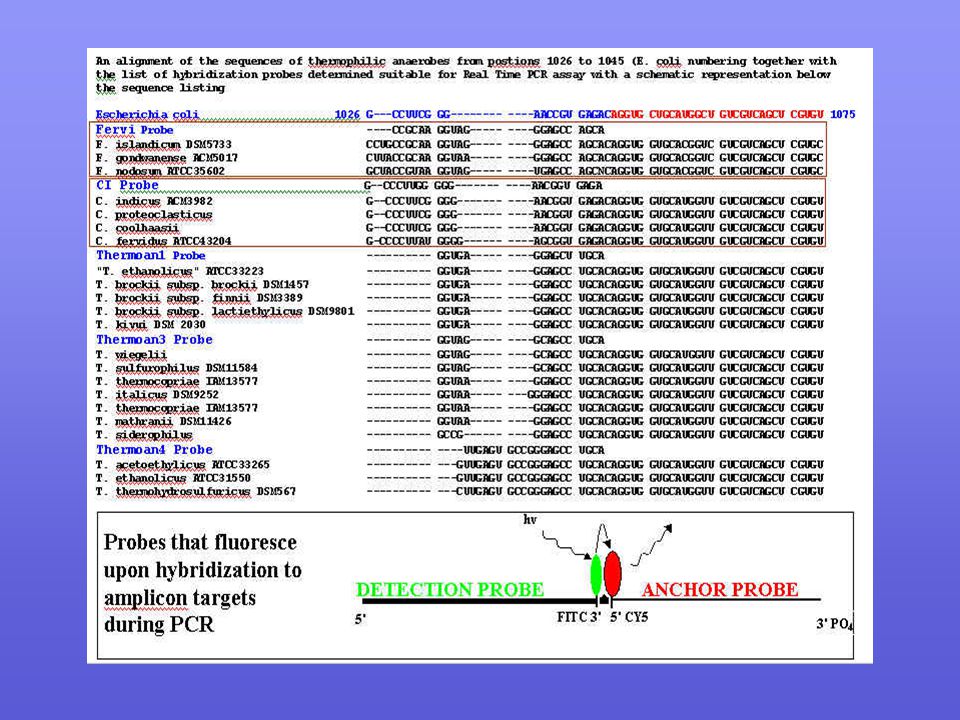
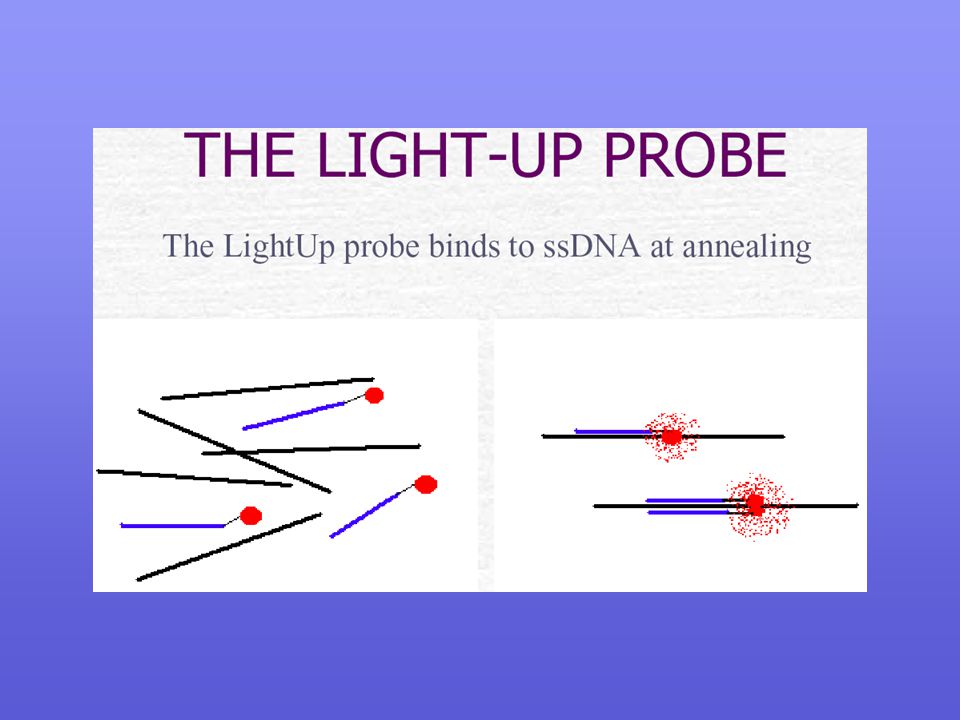


>")


 Analysis of DNA (Sequencing) Chemical Synthesis.>")


