Download presentation
Presentation is loading. Please wait.

1
ACHIEVEMENT CONTRACT SCHOOL DISTRICT No.42 MAPLE RIDGE / PITT MEADOWS
Submitted July 2010 Second Year of the 3 Year Plan

2
School District No. 42 Vision, Mission and Core Values
Our Vision is for every individual to feel valued, and for all learners to reach their full potential. Mission Our Mission is to fully support all individuals in their personal development as successful learners and respectful contributors to society. Core Values Responsibility to all Learners Uniqueness of Each Individual Personal and Social Responsibility High Expectations for Success Culture, Community and Citizenship Diverse Learning Opportunities

3
District Context Maple Ridge/Pitt Meadows is a very unique district in its size and location. We are not Metro in size and complexity yet we are also not Fraser Valley in terms of needs and make-up. The size of SD 42 allows very personal connections which in turn allows us to readily focus on the needs of our kids in a very strategic way.

4
District Context This year has been a very difficult year in that we have had to close 2 of our elementary schools. Also due to continued budget pressures we have had to remove much of our Collegial Support time that we had previously placed in schools to support improved teaching and learning practice. We are currently working on placing emphasis on Building Capacity as we know that the budget pressures will continue based on the fact that we are projected to continue to decline in enrollment over the next several years.

5
District Context (cont’d)
We completely restructured our Senior Team this year and reduced by 3 staff members at the District Office. We have one superintendent (new this year)and three directors, each of whom spend a third of the year in the role of Deputy Superintendent. We have also hired a new Secretary Treasurer who is currently assisting us with creating efficiencies and getting us to best practice.
and three directors, each of whom spend a third of the year in the role of Deputy Superintendent. We have also hired a new Secretary Treasurer who is currently assisting us with creating efficiencies and getting us to best practice.")
6
A Focus on Student Learning Table of Contents:
Early Learning – A focus on students requiring targeted and intensive support. Students with Learning Disabilities and Behavior Challenges – A focus on improvement. Secondary Education – A focus on Engaging the Learner and Diversifying Instruction.

7
A Focus on Student Learning Table of Contents (cont’d)
21st Century Learning – A focus on Inquiry projects and a 21st century rubric for assessing 21st century skills. Elementary Literacy – A focus on disaggregating the data to identify cohorts needing intervention. Aboriginal Education – A focus on what our Aboriginal students and how our work aligns with the Enhancement Agreement.

8
EARLY LEARNING A Focus on Students Identified as “at risk”

9
What have we done so far:
Early Learning Early learning data particularly focused on kindergarten and preschool initiatives… Continued to promote and expand Early Learning initiatives in School District 42: Strongstart, Ready Set Learn, PALS, Welcome to Kindergarten. Worked with kindergarten teachers to enhance the opportunities that Kindergarten students are given to cut, paste, paint, and explore fine motor activities.

10
What have we done so far:
Early Learning (cont’d) In-serviced teachers in ‘Handwriting Without Tears’. Identified time at the Kindergarten network meetings to discuss student achievement. Developed a comprehensive 2 year plan to support the introduction and implementation of the full day kindergarten program across all 20 elementary schools.
 In-serviced teachers in ‘Handwriting Without Tears’. Identified time at the Kindergarten network meetings to discuss student achievement. Developed a comprehensive 2 year plan to support the introduction and implementation of the full day kindergarten program across all 20 elementary schools.")
11
Why did we choose this area of focus?
Early learning is the foundation of student engagement and success. The educational focus in many of our classrooms has moved away from a focus on the “whole child”, play based programming and “developmentally appropriate activities”. The pending introduction of full day kindergarten required a comprehensive review and re-visioning of what an effective kindergarten program looks like.

12
Why did we choose this area of focus? (cont’d)
In 2008/2009 Kindergarten teachers identified (34%) students as being at risk in one or more areas of development. Girls are viewed by teachers as being much less at risk in all areas than boys
 students as being at risk in one or more areas of development. Girls are viewed by teachers as being much less at risk in all areas than boys.")
13
Why did we choose this area of focus? (cont’d)
Boys and aboriginal learners were identified as being particularly at risk in the areas of attendance, fine motor, oral language and attention span/focus on task. Students of aboriginal background were viewed by teachers to be at least 50% more at risk than non aboriginal students in all areas.

14
What did we learn in 2009/10 In 2009/10, Kindergarten teachers identified 302 of the 974 (31%) students as being at risk in one or more areas, compared to 318 of 941(34%) in 2008/09. The % of students which teachers view as at risk in the identified areas has reduced in contrast to the 2008/09 data. This may be due to an increased awareness by teachers of appropriate “curricular and developmental expectations” and a clearer identification at the district level of what “at risk” means in each area.
 students as being at risk in one or more areas, compared to 318 of 941(34%) in 2008/09. The % of students which teachers view as at risk in the identified areas has reduced in contrast to the 2008/09 data. This may be due to an increased awareness by teachers of appropriate curricular and developmental expectations and a clearer identification at the district level of what at risk means in each area.")
15
What did we learn in 2009/10? The areas that teachers identified as “at risk” changed in priority between 2008/2009 and 2009/2010. 2008/2009 Areas identified as most “at risk” 2009/2010 Areas identified as most “at risk” Literacy 123/318 = 39% Fine Motor 117/318 = 37% Attention 111/318 = 35% Oral Language 107/318 = 34% Attendance /318 = 33% Fine Motor 101/302= 33% Oral Language /302 = 28% Attendance 81/302 = 27% Attention (circle) 80/302 = 26% Literacy (sounds) 79/302 = 26%
 80/302 = 26% Literacy (sounds) 79/302 = 26%")
16
What did we learn in 2009/10? (cont’d)
Girls are still viewed by teachers as being less at risk in most areas than boys, in the area of attendance however, they have been identified as being slightly more at risk. Boys are still viewed by teachers to be more “at risk” in all areas except attendance, the spread between the % of boys and girls “at risk” has reduced Students of aboriginal background are still viewed by teachers to be significantly more at risk than non aboriginal students in all areas.

17
What are we happy about and proud to show with this data?
There has been a percentage drop in the number of “at risk” kindergarten students identified by kindergarten teachers in all areas. Literacy – at risk dropped approximately 12%, Oral Language 6%, Fine Motor 4%. The data has stimulated teacher discussion related to “developmentally appropriate” activities and expectations and the sharing of strategies and practices that can increase and support student learning.

18
What are we happy about and proud to show with this data? (cont’d)
Representatives from Aboriginal Education, English as a Second Language, and Student Support Services staff are now dialoguing with kindergarten teachers Discussions are focused on ways to imbed culturally appropriate and universal strategies into the kindergarten program so that ALL children can be successful.

19
What have we discovered we would like to change, alter or refocus on as a result of what we have found? The % of boys who are considered “at risk” as compared to the % of girls particularly in the areas of fine motor, oral language and attention/time on task. The % of aboriginal students who are considered at risk in comparison to “non aboriginal” students.

20
What have we discovered we would like to change, alter or refocus on as a result of what we have found? (cont’d) It appears that our current programming lends itself more easily to supporting the learning styles of girls than boys. This would appear to be even more true when looking at aboriginal learners.

21
Where to next? In light of the need to improve success for boys and aboriginal learners and to reflect the Ministry “full day” kindergarten mandate we will be focusing on: Developing a “play based”, “project oriented” kindergarten program Providing opportunities for students to demonstrate their learning in ways that support their learning styles Offering activities and interventions that build student skills and abilities particularly in the areas of fine motor, oral language and increasing attention/time on task.

22
Where to next? (cont’d) Working directly with kindergarten teachers to align their practice with the new kindergarten handbook and current knowledge of the importance of a “whole child”, “play based”, “developmentally appropriate’ programming. Continue to use the District Kindergarten steering committee comprised of principals, kindergarten teachers, MRTA executive, aboriginal support teachers, and student support services staff to guide our journey to full day kindergarten in all schools by September 2011/12.

23
Where to next? (cont’d) Specific focus and dialogue will occur district wide on how to integrate targeted and intensive support seamlessly into a kindergarten program in a systematic, structured and effective manner. An enhanced focus on including kindergarten and grade 1 teachers in dialogue, and discussion on how the district can support and enhance programming for early learners in SD 42 to improve student success in all curricular and developmental areas.

24
Where to next? (cont’d) A specific focus on following the cohorts of students identified as “at risk” this year into their grade one year. The development of “intervention” programs to address each student’s areas of vulnerability and risk with a focus on “developmentally appropriate” interventions. The continued refining of the data that is collected to ensure objectivity and relevancy.

25
Students with Learning Disabilities and Behavior Challenges

26
A Focus on Students with Learning Disabilities

27
What have we done so far? Laptop Initiative for students with LD. 30 students with a designation of learning disability and corresponding school teams were provided with personal laptops, assistive software and training. The intention was to see if increased access to technology would have a positive affect on success for these individuals. Assistive Technology -professional development/ in-service: Offered ongoing professional development opportunities to support teachers and classroom teachers on the use of accommodations and adaptations in the form of assistive technology for LD students.

28
What have we done so far? (cont’d)
Exploring effective practices and other district models: The LD committee visited other districts to examine examples of effective practice for students with learning disabilities. The committee reported out on examples of systems practices and the application of tiered support systems, looking specifically at effective targeted and intensive interventions for these students. In addition a literature review of current North American research highlighting effective practices for learning disabled students (including effective interventions for preventing school ‘drop out’) was completed.
 was completed.")
29
What have we done so far? (cont’d)
Student Interviews – Letting Our Students Tell Their Stories:. The LD committee interviewed secondary school students who were indentified as having a learning disability in order to obtain anecdotal reports on what students felt were the challenges and effective supports that have had an impact on their own educational experiences. Developed base line data to monitor student achievement for LD students at a district level.

30
Why did we choose this area of focus?
District graduation rates in 2007/08 for students with learning disabilities show a steady decline in improvement from previous years ( 8% decline in graduation rates over two years). Graduation rates for students with learning disabilities from across Canada are still extremely low (approx 23% federally 5 year and 59% provincially 6 year) and places this demographic at high risk for school failure.
. Graduation rates for students with learning disabilities from across Canada are still extremely low (approx 23% federally 5 year and 59% provincially 6 year) and places this demographic at high risk for school failure.")
31
Student Learning Data that we used:
Quantitative: LD Six Year Graduation Rate for Dogwood – Showing an improvement from the last 3 years. FSA and Grade 10 Provincial and Grade 12 Provincial Results for LD Non-Completers - Indicating school failure may begin much earlier than high school. Qualitative: Anecdotal comments taken from district interviews of secondary school students with a learning disability. Indicating: Strategies, Challenges and Support Systems

32
LD Graduation Rate

33
LD Non-Completers 2008/09 Number that meet expectations on Gr
LD Non-Completers 2008/09 Number that meet expectations on Gr. 7 FSAs Number that wrote Grade 10 Eng Provincial Exam Number that wrote Grade 12 Eng and Com Provincial Exam

34
LD Student Survey 2009-2010 Strategies These Students Use:
“I just finished reading “Lord of the Flies” and my support teacher put it on tape for me” “Oral exams are the way I like to show what I know” “Breaking down things into smaller bits” “Learning Centre is very helpful I probably wouldn’t be in Grade 12 without their one-on-one help” Technology such as books on MP3 players, text to speech software, laptops Making good use of your support block Be organized - use your planner Ask questions in class or after class Ask to work or take tests in a quieter environment Break down the learning into smaller chunks

35
LD Student Survey Support systems of teachers/students families: “Instead of just giving you an assignment and telling you this is what you have to hand in, telling you what they expect and what they are looking for and explaining how you would do that” “Mr. ****** since grade 9 has been my favorite teacher, he stops by and asks if I need help because I won’t raise my hand – I’m shy” “My mom is really good at helping me” “Without Mr. ****, I wouldn’t be here today.” Find a teacher who you can talk to Let your friends help you Know that someone cares about whether you succeed or don’t Get a tutor Find a teacher who is willing to explain what they want you to do

36
LD Student Survey 2009-2010 Challenges:
“Overcoming the feeling that I am not smart enough” “Not understanding what the teacher wants me to do” “Reading novels is hard” “Spelling is difficult” “Finding information in a textbook is hard” Source: Video Production by LD Sub Committee: Ken Arkell, Deirdre Way & Rosemary Broavac SD 42

37
What did we learn? Improving success for students with learning disabilities has been a focus for the past three years in the achievement contract. While graduation rates have shown improvement it is important to build on this success by maintaining and developing appropriate interventions system wide. The focus of the past year was primarily to assess potential accomplishments and challenges within the district with regards to interventions and support systems for students with LD. The focus for the upcoming year will be to implement strategies based on these findings.

38
What are we happy about and proud to show with this data?
6 year District Graduation rates for students with learning disabilities has improved 16% from the previous year. This is above the provincial average for students with an designation of LD. Many students with LD identify teachers as being a key element in finding success at school. LD students have indentified that increased access to technology is tool that has helped them succeed in some of their core subject areas. This may indicate that the laptop project for students with LD is already having a positive impact.

39
What have we discovered we would like to change, alter or refocus on as a result of what we have found? Improved Graduation Rates for students with a learning disability suggest that practice is improving. Our focus will be on sustaining this success, while implementing effective support systems system wide. FSA results, and Grade 10 English, Grade 12 English and Communications Provincial Exam completion suggests that school failure for students with LD occurs before Grade 10, and perhaps well into elementary school. File reviews of these students from K-12 will occur to see if there are any common trends that indicate why and when students with LD disengage from school.

40
What have we discovered we would like to change, alter or refocus on as a result of what we have found? (cont’d) The qualitative data taken form the student interview suggests that student self-advocacy and the ability to ask for help plays an important role in their success at school. Assisting students in the development of these skills, as well as teacher training in the use of accommodations and adaptations, will play an integral role in building success for these students.

41
Where to next? Area of Focus for 2010/2011 - Learning Disabilities
A. Learning Disabilities Pilot Project: Three elementary schools to engage in a LD pilot project that focuses on a tiered model of support including: Early Screening – Kindergarten Level Ongoing screening and intervention at Grade 3 and grade 5 A focus self advocacy for Grade 6 and 7 A focus on Grade 7 to 8 transition

42
Where to next? (cont’d) Area of Focus for 2010/2011 - Learning Disabilities
B. Secondary School Focus: Each secondary to review school achievement with regards to learning disabilities and to create an action plan for increasing achievement for these students – to assign up to .5 staffing from each school to assist with implementation of the plan. To engage in consultation with secondary schools regarding the implementation of a specific LD focus in Grade 8 and 9 – attaching a LD support focus to Grade 8 Pod structure.

43
Where to next? (cont’d) Area of Focus for 2010/2011 - Learning Disabilities
C. Increase Use of Assistive Technology District Wide: Continuation of SSS district wide Laptop Project for students with a learning disability: To provide 30 additional laptops for indentified students in the district that would benefit form the use of a personal laptop. To increase classroom teacher training on the use of assistive technology in the form of accommodations. Implement a district wide Kurzweil server. Continue district wide training in both Kurzweil and ARC

44
Where to next? (cont’d) Area of Focus for 2010/2011 - Learning Disabilities
D. Increase training for classroom teachers: In-service and professional development opportunities to review the Ministry Planning Tool for LD with classroom teachers. Meet with representatives from different departments to create a adaptations and accommodations guide specific to subject/grade level areas.

45
Where to next? (cont’d) Area of Focus for 2010/2011 - Learning Disabilities
E. Data Based Decision Making: An analysis of past report cards - examining strengths and challenges for students with LD at the elementary school level - is an important next step in building successful support systems. Early identification and intervention for these students appears to be necessary in building further success. Share results of the student survey/ video with school teams to guide support planning at school level.

46
A Focus on Students with Behaviour Challenges

47
What have we done so far? Continued implementation of coordinated district structures and initiatives, including the development of a clear model for referral, identification and intervention pathways for students experiencing behavioural challenges in school. Continued promotion of a school wide focus for building positive culture and behavioural intervention at a district level. Working with three schools on full implementation of a school wide Positive Discipline Model.

48
What have we done so far? (cont’d)
Creation of a Secondary Behavioural Support Network so that teachers and school psychologist from each secondary school could share and reflect on effective practices. Facilitated training/ capacity building at each secondary school with regards to functional assessments, positive behaviour support plans and “check-in check- out” interventions.

49
What have we done so far? (cont’d)
Worked with school teams to assist them in the implementation their own systems for creating data based decision making in terms of monitoring and indentifying at-risk students. Implemented the use of student engagement surveys at each secondary school. Developed base line data to establish a systematic district collection of qualitative and quantitative measures of achievement tracking of students from Grade 7 through to Grade 12.

50
What have we done so far? (cont’d)
Continued to offer a variety of learning pathways and educational options for students as they progress through secondary school, such as integrated trades programs, and other alternative educational options. Re-examined the role of the school counselor and increased collaboration of counselors, child care workers and outside agencies to assist in wrap around services for students and their families.

51
Why did we choose this area of focus?
Six year district graduation rates for students with Behavioural Disabilities in 2007/08 showed a slight decrease in achievement for these students. While the grad rates for students with a behavioural disability was still higher in SD 42 than compared to the provincial average, the results are far lower than the average 6 year graduation rate as compared to the general student population indicating that this remains to be our most at-risk student demographic. A continued focus on effective interventions are needed if we are to see an increase of success for this population.

52
What student learning data are we using?
A. Behaviour Disability - Six Year Graduation Rate for Dogwood B. FSA and Grade 10 Provincial and Grade 12 Provincial Results for Behaviour Non- Completers

53
Behavioural Disabilities: Six Year Graduation Rate 2003-2009

54
Behavioral Disabilities: FSA and Provincial Exam Data fro Six year Non-completers. Number of students with an H or R designation that meet expectations on Gr. 7 FSAs Number of students with an H or R designation that wrote Grade 10 Eng Provincial Exam Number of students with an H or R designation that wrote Grade 12 Eng and Com Provincial Exam

55
What did we learn? Improving success for students with behavioural disabilities has been an ongoing focus in School District 42’s achievement contract. Graduation rates have shown some improvement since 2003, but have not been consistently increasing from year to year. Our area of focus will be to build on structures and systems put in place from the previous years achievement contract, with the hope of seeing a steady increase in graduation rates for students with an H or R designation.

56
What are we happy about and proud to show with this data?
District Graduation rates for students with behaviour disabilities has improved by 3% from the previous year. This is above the provincial average for students with behavioural disabilities. This may be a result of district focus on alternative educational choices for students with behavioural difficulties and targeted staffing at the secondary level to increase school capacity in proactive behavioral interventions.

57
What have we discovered we would like to change, alter or refocus on as a result of what we have found? FSA, Grade 10 Eng and Grade 12 Eng and Communications results suggest that school failure for students with behavioral disabilities occurs before Grade 10, and perhaps well into elementary school. An analysis of past report cards examining strengths and challenges for students with behavioural disabilities at the elementary school level is an important next step.

58
What have we discovered we would like to change, alter or refocus on as a result of what we have found? (cont’d) The high percentage of students with behavioural difficulties that are experiencing school failure prior to entering high school indicates that a school wide approach to behaviour is needed at both the elementary and secondary level. Anecdotal data and the district wide teacher satisfaction survey suggest that classroom teachers still identify behavioural difficulties as the biggest challenge in their classrooms. Intervention, therefore, needs to take the form of school wide universal interventions. A district wide initiative for universal, targeted and intensive interventions may be needed in order to support schools with proactive discipline strategies.

59
Where to Next? A. Capacity Building:
To continue capacity building at the school level through training and guided practice in developing positive behaviour support plans for support and classroom teachers. Targeted funding (up to .5 staffing) to schools to support students with challenging behaviour. Each secondary to review school achievement with regards to learning disabilities and to create an Action Plan for increasing achievement for these students
 to schools to support students with challenging behaviour. Each secondary to review school achievement with regards to learning disabilities and to create an Action Plan for increasing achievement for these students.")
60
Where to Next? Capacity Building: (cont’d)
Provide training to Special Education Assistants and in-service opportunities for teachers in strategies that support students with challenging behaviour. Continue the joint committee of counselors, Mental Health Personnel and Student Support Services staff. Move from investigation to implementation of strategies suggested by committee.

61
Where to Next? B. Supporting District Implementation of School- Wide Positive Discipline Models. Continued implementation of and training of district structures including a clear model of referral, identification and intervention pathways (universal, targeted and intensive) for students experiencing challenges in school. Continue to work with schools that identify behaviour support as a part of their school growth plan to promote a school wide focus for building positive culture and behavioural intervention.
 for students experiencing challenges in school. Continue to work with schools that identify behaviour support as a part of their school growth plan to promote a school wide focus for building positive culture and behavioural intervention.")
62
Where to Next? Supporting District Implementation of School-
Wide Positive Discipline Models. (cont’d) Support schools in the development of systematic data collection of qualitative and quantitative data on achievement, and behavioural data. Work with schools to implement data based decision making when implementing behavioural interventions school wide. Collaborate with school teams to examine the role of the school counselor and child care worker in supporting universal targeted and intensive behavioural interventions.
 Support schools in the development of systematic data collection of qualitative and quantitative data on achievement, and behavioural data. Work with schools to implement data based decision making when implementing behavioural interventions school wide. Collaborate with school teams to examine the role of the school counselor and child care worker in supporting universal targeted and intensive behavioural interventions.")
63
SECONDARY EDUCATION A Focus on Engaging the Learner and Diversifying Instruction

64
6 Year Graduation Rate What have we done so far?
Recognizing there are a number of variables in this data and the fact that it is a snapshot, SD42 has remained consistent over the past few years. Our six year graduation rate for resident students ranges between 78% and 81%. We have been able to filter residents from non-residents within the results and have reduced the impact of short term visits of international students. We now track each individual student to determine why they have not graduated. We now break down the data to better understand results at individual schools, both Secondary and Elementary.

65
6 Year Graduation Rate What have we done so far? (cont’d)
We have adjusted the Keeping Kids in School mandate adding an attendance protocol (as described later in this document). We have provided staffing to each school to gather attendance data, analyze, communicate with students and their parents, and finally, provide appropriate interventions. We have increased the number and quality of engaging programs in our District including a wide range of trade partnerships, academies, and opportunity for students to take courses in schools other than their home school.
. We have provided staffing to each school to gather attendance data, analyze, communicate with students and their parents, and finally, provide appropriate interventions. We have increased the number and quality of engaging programs in our District including a wide range of trade partnerships, academies, and opportunity for students to take courses in schools other than their home school.")
66
6 Year Graduation Rate Why did we choose this area of focus?
All Students % Resident Student % 76.7 78.2 75.1 81.2 Why did we choose this area of focus? The Ministry of Education has identified completion rate as a performance measure in the Service Plan. Secondary Principals recognize 6 year completion rate as one of our fundamental purposes in education. Completion rates long been a performance measure in our school district. When we compare our results with other lower mainland and island school districts we note we have work to do.

67
6 Year Graduation Rate Where to Next?
Continue to find ways to engage all of our learners, make school enjoyable, and provide opportunities for students to take control of their learning (with guidance). Better understand student needs and build relationships. Increased follow-up when students withdraw from school or transfer to an alternate setting within the District. Regular and consistent tracking of progress. Early recognition and intervention. Wrap around services in partnership with the community.
. Better understand student needs and build relationships. Increased follow-up when students withdraw from school or transfer to an alternate setting within the District. Regular and consistent tracking of progress. Early recognition and intervention. Wrap around services in partnership with the community.")
68
School Based Marks What have we done so far?
We began to collect this data last year and have followed the grade cohort and the cohort of individuals that have remained at the school. The goal is to use this data allowing networks of teachers to discuss effective teaching/learning strategies, best assessment practices. This data set, by itself, allows for deep discussion about curriculum and students. Provincial exams need not be the only quantitative data available. Forms the basis of conversation between schools and teachers of like courses.

69
School Based Marks Why did we choose this area of focus?
When we received the Ministry’s comparison of school based marks and provincial exam marks, specifically English 10 and Science 10, we began to question why the average school based mark was lower. Reflecting on school based marks by individual teachers leads to curriculum review, provincial examination review, and the connection between the two. When we reviewed the school based marks data, it really became obvious that our students are operating (on average) in the C to C+ range. We wanted to know if that was the best that they could do, if we were happy with these results, what results are they getting in neighboring Districts, and what we could change to ‘get better’?
 in the C to C+ range. We wanted to know if that was the best that they could do, if we were happy with these results, what results are they getting in neighboring Districts, and what we could change to ‘get better’")
70
School Based Marks A 68% 67% 64% 65% 66% B 70% 72% 69% C 73% 74% 71% D
English 8 English 9 English 10 Math 8 Math 9 Math 10 Science 8 Science 9 Science 10 Socials 8 Socials 9 Socials 10 A 68% 67% 64% 65% 66% B 70% 72% 69% C 73% 74% 71% D 63% E 78% 75% 59% F 61% 60% 2007/2008 2008/2009 2009/2010

71
School Based Marks A 72% 70% 65% 62% 66% 63% 69% 67% 76% B 71% 68% 75%
English 9 English 10 English 11 Math 9 Math 10 Math 11 Science 9 Science 10 Biology 11 Chem 11 Socials 9 Socials 10 Socials 11 A 72% 70% 65% 62% 66% 63% 69% 67% 76% B 71% 68% 75% C 56% 61% D 74% 58% E 59% 57% 73% 54% F 52% 64% 2007/2008 2008/2009 2009/2010

72
School Based Marks A 60% 61% 70% 68% 66% 64% 62% 81% 74% 63% 67% B 73%
English 10 English 11 English 12 Math 10 Math 11 Math 12 Science 10 Bio 11 Bio 12 Chem 11 Chem 12 Socials 10 Socials 11 A 60% 61% 70% 68% 66% 64% 62% 81% 74% 63% 67% B 73% 69% 75% 71% C 72% 80% 65% D 77% 59% E 76% 56% 54% 47% 57% 51% F 53% 2007/2008 2008/2009 2009/2010

73
School Based Marks What is the desired outcome in presenting this data? A focus on school based marks, as opposed to ‘teaching to the provincial exam’ provides opportunity for teachers to connect curriculum to students and students to curriculum.

74
School Based Marks What do we hope to gain through these
conversations? A renewed energy to focus on learning, student engagement, best assessment practices for learning, Freedom to explore learning outcomes and objectives more deeply and with greater understanding, Reduce the minutia and regurgitation of information that occurs frequently in the classroom; essentially, stop teaching to the test, That our overall school based marks get better, and that the provincial exam marks follow naturally, and finally, Our six year graduation rate gets to the level we know it should.

75
Attendance and School Refusal
What have we done so far? We saw a direct connection (supported by research) between success at school and attendance. We also know there is a direct correlation between withdrawal from school and attendance. We have spent a significant amount of resources on Keeping Kids in Schools and felt we needed to narrow the focus of the initiative. We feel (supported by research) that the earlier the intervention, the better chance to re-engage the student. The desired outcome is to reduce the withdrawal rate and increase 6 year graduation rates.
 between success at school and attendance. We also know there is a direct correlation between withdrawal from school and attendance. We have spent a significant amount of resources on Keeping Kids in Schools and felt we needed to narrow the focus of the initiative. We feel (supported by research) that the earlier the intervention, the better chance to re-engage the student. The desired outcome is to reduce the withdrawal rate and increase 6 year graduation rates.")
76
Attendance and School Refusal
What have we done so far? (cont’d) A team consisting of a vice principal, counselor, and child care worker were formed at every school. Weekly attendance was collected to determine which students were missing significant numbers of classes. The school based network communicated and took responsibility for communicating, tracking, and providing interventions as needed. Bi-monthly meetings were held involving all members. At these meetings, information was shared to make student tracking easier, round table discussions were held to communicate effective intervention strategies and data was collected demonstrating success.
 A team consisting of a vice principal, counselor, and child care worker were formed at every school. Weekly attendance was collected to determine which students were missing significant numbers of classes. The school based network communicated and took responsibility for communicating, tracking, and providing interventions as needed. Bi-monthly meetings were held involving all members. At these meetings, information was shared to make student tracking easier, round table discussions were held to communicate effective intervention strategies and data was collected demonstrating success.")
77
Attendance and School Refusal
What happened throughout the district in terms of data collection, student interventions? Truancy Related Suspensions: School Year Total 2009/ 2008/ 2000/ 1999/ Rather than using out of school suspensions to address school refusal, schools are now using in-school suspensions. Providing opportunities for after-school learning (e.g., I Day After Dark), and most importantly are working in teams to develop positive behaviour support plans that examine the school refusal behaviour, and develop hypotheses and logical interventions in relation.
, and most importantly are working in teams to develop positive behaviour support plans that examine the school refusal behaviour, and develop hypotheses and logical interventions in relation.")
78
Attendance and School Refusal
Where to next? We will provide the same amount of resources to this initiative. We will continue to work with our Keeping Kids in School, Child Care Workers, and Aboriginal Support staff to coordinate services and interventions. The data collection through BCeSIS is somewhat time consuming and awkward. We will look to create a program that is more user friendly.

79
Engaging all Learners What have we done so far?
As a District, we committed to a theme of engaging all learners. At the secondary level we agreed to common professional days and as a result, were able to bring in speakers to support the theme. The belief we share is that if students are engaged and in control of their learning, they will enjoy school more, learn, and graduate.

80
Engaging all Learners What have we done so far? (cont’d)
We came up with 5 questions that we believe will help us create a direction for change and/or celebration. The 5 questions were asked of students in each of the grade levels at each of the schools. What are the ways you like to learn? At school, outside of school? What forms of assessment motivate you or help you learn more? What are some examples of ways you don’t like to learn, or ways you don’t like how learning is presented? What technology or tools that you use in school or out of school most support your learning? How? If you could design a school that was specific to your needs, what would it look like? What would your day look like?

81
Engaging all Learners (cont’d)
Why did we choose this area of focus? While we spend a great deal of time examining 6 year grad rate, this data offers a different view. If our goal in education is to support all of our students, including those that do not graduate, this data might be an indicator that students are staying with the District more now than they used to. An assessment of this data over time will provide more concrete information.

82
How do we know we are on the right track?
This graph shows the total number of students who were enrolled at the secondary level at various times in the year. Year 30-Sep 28-Feb 31-May # student difference between September 30 and May 30 6470 6457 6429 -51 6742 6699 6707 -35 6792 6598 6595 -197 6734 6590 6514 -220 6620 6486 -191 6465 6343 6252 -213 6230 6109 6030 -200 6011 5907 5837 -174

83
Engaging all Learners (cont’d)
What conclusions/hypothesis can be drawn as a result of this data? This data indicates that, within our 6 secondary schools and 2 alternative programs, our student numbers have remained relatively consistent between September and June over these past 2 years. This slide shows a distinct difference between the last 2 years and those previously noted. It is important to note that this data does not include the data from the adult learning center, where some of our students transfer during the regular school year.

84
Engaging all Learners Why is this data important and what is the connection to 6 year graduation rates? This data shows that the number of students lost from September to June is decreasing. Our admission/withdrawal data shows that students are not moving in and out of the District as often as they once did. These two pieces of data might indicate that students are not dropping out of school or that we are attracting students throughout the year. While the reason that the numbers of students we keep throughout the year has improved, our 6 year graduation rate is consistent (again, within 2 to 3%). We believe we have structures within our District that has attracted students to stay and in many cases, re-enter the system. The connection between the numbers of students and 6 year graduation rate is important because we believe we are servicing more students now, and that over time, these connected students will become graduates; many of them after the 6 year snapshot.
. We believe we have structures within our District that has attracted students to stay and in many cases, re-enter the system. The connection between the numbers of students and 6 year graduation rate is important because we believe we are servicing more students now, and that over time, these connected students will become graduates; many of them after the 6 year snapshot.")
85
Engaging all Learners Where to next?
To share these findings with our administrators, teachers, and partner groups to determine if we should look at the results, change where necessary or celebrate our successes. Combine with the results of the Satisfaction Survey and other District based surveys. Again, once we discover trends, begin to examine possible areas of change. Use these results as Directors, present to school based staff with the belief that teachers will continue to reflect on daily practice. These questions also form the basis for further school based conversations with respect to engagement, instruction, and assessment.

86
21st Century Learning A Focus on Inquiry and Assessing 21st Century Skills

87
21st Century Skills include:
We have 20 laptop classes which includes 3 French Immersion classes. The program is in 11 schools. Developing inquiry questions Planning Gathering and evaluating information Collaborating Reasoning Creativity and innovation Using technology tools Presenting information and ideas

88
Which area of student learning are we focusing on for 2010?
Skills that students need to be successful as learners, citizens, and at work in the 21st century Research, inquiry and action on real-world issues that involve applying what they learn

89
What have we done so far? Results from previous years demonstrate clearly that the laptop program improves writing Students today need an increasing array of ‘21st Century’ skills that enable them to meet new challenges, solve problems, and use the tools and technology of today and tomorrow Inquiry and challenge-based learning combine the strengths of traditional learning with new directions that engage students and extend and deepen their learning This project was designed to build on the strengths in improving writing, the strong capacity for supporting technology integration, and increasing research on the impact of inquiry and challenge

90
What have we done so far? (cont’d)
is the first year of the 21st century skills project A large focus has been developing and trying out assessment materials for: developing inquiry plans processes of inquiry presentations of inquiry project results Assessment materials follow the BC Performance Standards pattern of using clearly established criteria to describe student achievement in terms of expectations (not yet meeting; meeting at minimal to moderate level; fully meeting; exceeding) Data from Spring 2010 will become baseline data for subsequent years
 Data from Spring 2010 will become baseline data for subsequent years.")
91
21st Century Skills Project 2009/10
Comparing pre/post planning skills It was not feasible to ask students to do ‘pre’ inquiry projects However, before providing instruction, we did ask them to create plans for an inquiry related to the importance of celebrities; these were collected and stored Teams of teachers scored the original plans and the plans for the ‘final’ projects in April. Plans were assessed for: overall quality; development of questions; planning; creativity; collaboration; use of resources and technology; evaluation of sources

92
21st Century Skills Project 2009/10 (cont’d)
Growth in Understanding and Planning Skills As indicated on the following graph, students showed extremely strong gains in their ability to plan an inquiry, including understanding issues, information, tools and technology. In November, 54% of the plans were ‘not meeting expectations’; by May, that was reduced to 17%, while the percent ‘fully meeting ‘or ‘exceeding’ increased from 4% to 32% Looked at another way, the average score (on a 4- pt scale), increased from 1.5 to 2.2, a gain of one full standard deviation, both statistically and educationally significant
, increased from 1.5 to 2.2, a gain of one full standard deviation, both statistically and educationally significant.")
93
21st Century Skills Project 2009/10 (cont’d)
")
94
21st Century Skills Project 2009/10 (cont’d)
Growth in Specific Aspects of Planning Students’ skills increased in all aspects of planning and inquiry. As shown in the following graph, the gains were greatest for creating a realistic plan (from 39% to 81% meeting expectations), for overall planning/understanding (46% to 83%), and showing creativity (42% to 79%) Gains were least for planning how to work together, largely because the November scores were relatively high (74% to 81%)
, for overall planning/understanding (46% to 83%), and showing creativity (42% to 79%) Gains were least for planning how to work together, largely because the November scores were relatively high (74% to 81%)")
95
21st Century Skills Project 2009/10 (cont’d)
")
96
21st Century Skills Project 2009/10 (cont’d)
Final Inquiries and Presentations In May, students worked in groups of 2-4 to: Develop an inquiry question related to improving their own community Plan all aspects of the inquiry, including information sources, strategies for working together, and how the results would be presented Create a presentation summarizing their inquiry and presenting their solution or response to the inquiry question

97
21st Century Skills Project 2009/10(cont’d)
Final Inquiries and Presentations Groups designed their own questions – teachers did not assign questions or issues Teachers supported their work as needed, but students were responsible for all aspects of the inquiry Groups were encouraged to restrict their final presentations to 2 minutes; many used iMovie or PowerPoint

98
21st Century Skills Project 2009/10 (cont’d)
Assessing the presentations Teams of three teachers assessed each project presentation, using a rubric that assessed both content and presentation, specifically: Understanding the issue; use of evidence; logical reasoning; use of technology tools; vocabulary and conventions; clarity and impact Projects were presented in a wide variety of formats including i-Movies and PowerPoint

99
21st Century Skills Project 2009/10 (cont’d)
Overall Ratings Not yet meeting: Presentation is unclear and/or incomplete; features ineffective use of technology. Shows limited understanding and reasoning Minimal-Moderate: Presentation is generally clear (somewhat incomplete or flawed); features basic use of technology. Shows some understanding and logical reasoning.
; features basic use of technology. Shows some understanding and logical reasoning.")
100
21st Century Skills Project 2009/10 (cont’d)
Overall Ratings (2) Fully meeting: Presentation is clear, complete; features competent use of technology. Shows understanding and logical reasoning Exceeding: Presentation has impact; features effective use of technology. Shows thorough understanding, insight and powerful reasoning
 Fully meeting: Presentation is clear, complete; features competent use of technology. Shows understanding and logical reasoning. Exceeding: Presentation has impact; features effective use of technology. Shows thorough understanding, insight and powerful reasoning.")
101
21st Century Skills Project 2009/10 (cont’d)
Student Achievement: Completed Inquires As indicated on the following graph, most inquiry projects met at least minimal to moderate expectations (78%) Approximately one-quarter (24%) showed strong achievement, fully meeting or exceeding expectations The average score was 2.0 (on a 4-pt scale) with a standard deviation of .7 Note: Results are based on presentations from 160 groups including approximately 450 students
 Approximately one-quarter (24%) showed strong achievement, fully meeting or exceeding expectations. The average score was 2.0 (on a 4-pt scale) with a standard deviation of .7. Note: Results are based on presentations from 160 groups including approximately 450 students.")
103
21st Century Skills Project 2009/10 (cont’d)
Percent of Final Presentations that Met or Exceeded Expectations on Various Aspects Students demonstrated varying levels of skill in specific aspects of their inquiries As shown in the following graph, overall, their achievement was somewhat greater for presentation (e.g., use of technology tools) than for content (e.g., understanding the issue; logical reasoning) At least 70% of projects met or exceeded expectations on all aspects, except “logical reasoning,” where ‘fully meeting” was defined as: Uses evidence and logical reasoning to solve the problem in a useful/plausible way
 than for content (e.g., understanding the issue; logical reasoning) At least 70% of projects met or exceeded expectations on all aspects, except logical reasoning, where ‘fully meeting was defined as: Uses evidence and logical reasoning to solve the problem in a useful/plausible way.")
105
21st Century Skills Project 2009/10 (cont’d)
What are we happy about and proud to show with this data? Shifting discussion and assessment of student work to a new level that reflects both rigorous standards and the real demands students will meet Successful attempt to systematically collect evidence about key skills that are often not included in assessment Student commitment to making a difference in their communities

106
21st Century Skills Project 2009/10
What are we happy about and proud to show with this data? (cont’d) Level of improvement from fall to spring in student understanding of inquiry and their ability to design a project Development of strong basic inquiry skills as shown in student presentations Skills of teachers to systematically and reliably assess complex skills and understanding
 Level of improvement from fall to spring in student understanding of inquiry and their ability to design a project. Development of strong basic inquiry skills as shown in student presentations. Skills of teachers to systematically and reliably assess complex skills and understanding.")
107
21st Century Skills Project 2009/10 (cont’d)
What have we discovered we would like to change, alter or refocus on as a result of what we have found? Increased support for teachers around some aspects of planning and executing the project Increased clarity of expectations for both teachers and students Increased opportunities for teachers to share strategies, issues, and samples of student work Refined scoring and assessment processes Fine tune timelines for pre-plans, post plans and project due dates.

108
21st Century Skills Project 2009/10 (cont’d)
Where to next? Build on successes of by: Expand the project to more classrooms Re-design inservice and support to (a) engage teachers more and more in supporting and mentoring each other, and sharing strategies (b) providing increased technology support to teachers who need it Focus a year-plan on developing student learning skills and strategies for inquiry, including smaller projects and presentations and inquiries that are associated with various subject areas
 engage teachers more and more in supporting and mentoring each other, and sharing strategies (b) providing increased technology support to teachers who need it. Focus a year-plan on developing student learning skills and strategies for inquiry, including smaller projects and presentations and inquiries that are associated with various subject areas.")
109
21st Century Skills Project 2009/10
Where to next? (cont’d) Develop a ‘bank’ of exemplars that illustrate the range of student work that can be expected Create additional opportunities for students to share their inquiry projects and presentations Support teachers in transitioning their use of inquiry based learning to all subject areas
 Develop a ‘bank’ of exemplars that illustrate the range of student work that can be expected. Create additional opportunities for students to share their inquiry projects and presentations. Support teachers in transitioning their use of inquiry based learning to all subject areas.")
110
Elementary Literacy A Focus on Disaggregating the Data to Identify Cohorts Needing Intervention

111
Elementary Literacy What have we done so far?
Reading Levels (PM Benchmarks) Data collected for the 2009–10 Achievement Contract, indicated very little change in our student’s performance with regards to early literacy. We now have 4 years of trend data that allows us to better target intervention strategies like our Reading Racers summer program. The district is currently embarking on a review of our data collection process and consequently has reduced the scope of reported information.
 Data collected for the 2009–10 Achievement Contract, indicated very little change in our student’s performance with regards to early literacy. We now have 4 years of trend data that allows us to better target intervention strategies like our Reading Racers summer program. The district is currently embarking on a review of our data collection process and consequently has reduced the scope of reported information.")
112
Elementary Literacy What have we done so far? (cont’d)
Attainable objectives included in some School Growth Plans which address at risk students. Collegial and Curriculum Teachers supported teachers within their schools in literacy initiatives in may schools. Professional Development focus for all teachers on meeting the needs for all students Collegial and Curriculum Teachers continued to work with learner profile boards. Books for Boys series had 200 participants where the boys combined sports and fun activities with talking about books.

113
Elementary Literacy What have we done so far? (cont’d)
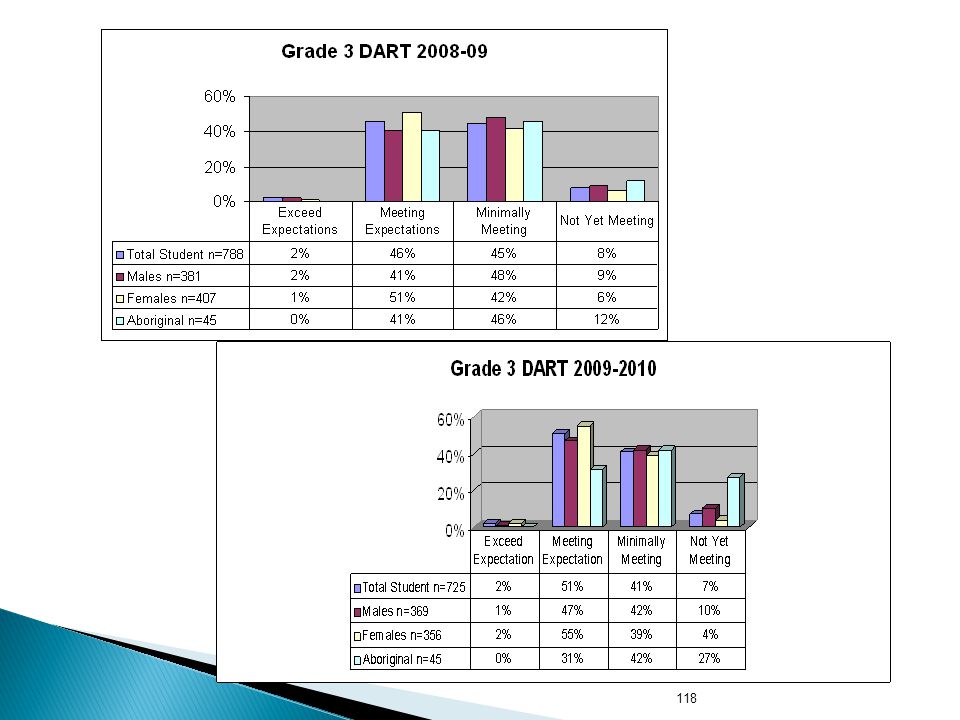
Books for Girls series had 160 participants where the girls combined sports and fun activities with talking about books. Bookfest expanded to include over 600 students. Continued Reading Racer summer school program for at risk Grade 1 students in literacy. District mark of the grade 3 and 6 DART to examine the validity of our data (see supporting documents). Continued collaboration with the public library to provide comprehensive programming for children in the community.
. Continued collaboration with the public library to provide comprehensive programming for children in the community.")
114
Students considered at risk in reading levels below district grade level expectation:
Gr. 1 (below level 7), Gr. 2 (below level 17) [ PM Benchmarks ] What did we learn? In our schools we are using literacy data boards to track our students’ progress and to ensure that people resources are assigned appropriately. As a means of meeting some of our most at risk grade one students, we offer selected students the opportunity to attend 16 days of summer school with a focus on literacy. 06-07 07-08 08-09 09-10 Gr. 1 7.0% n=778 53 male 45 female 6 aboriginal 10.0% n=771 58 male 19 female 17 aboriginal 11% n=838 70 male 24 female 10 aboriginal 10 % N=825 54 male 32 female Gr. 2 7.7% n=775 38 male 22 female 9 aboriginal 9.0% n=832 49 male 25 female 3 aboriginal n=813 34 female 21 aboriginal 11 % N = 884 60 male 40 female 11 aboriginal
, Gr. 2 (below level 17) [ PM Benchmarks ] What did we learn In our schools we are using literacy data boards to track our students’ progress and to ensure that people resources are assigned appropriately. As a means of meeting some of our most at risk grade one students, we offer selected students the opportunity to attend 16 days of summer school with a focus on literacy Gr % n= male. 45 female. 6 aboriginal. 10.0% n= male. 19 female. 17 aboriginal. 11% n= male. 24 female. 10 aboriginal. 10 % N= male. 32 female. Gr % n= male. 22 female. 9 aboriginal. 9.0% n= male. 25 female. 3 aboriginal. n= female. 21 aboriginal. 11 % N = male. 40 female. 11 aboriginal.")
115
Elementary Literacy What did we learn? (cont’d)
Reading Racer Summer Program 2009 summer data: 112 students participated in the program: (16 K’s, 48 grade 1 students, 16 grade 2 students, 16 grade 3 students, and 16 French program students) 68% of the students were boys and 32% were girls Improvement in Student Reading Levels (summer 2009): Grade K: average gain of over 7 “Words their way” levels per student (12x over the previous 10 months in school). Grade 1: average gain of over 4 levels per student (9x their rate of progress over the previous 10 months in Grade 1). Grade 2: average gain of over 2 levels per student (3x their rate of progress over the previous 20 months in Grades 1 & 2). Grade 3: average gain of 4 levels per student (2.5x their rate of progress over the previous 30 months in Grades 1, 2 & 3).
 68% of the students were boys and 32% were girls. Improvement in Student Reading Levels (summer 2009): Grade K: average gain of over 7 Words their way levels per student (12x over the previous 10 months in school). Grade 1: average gain of over 4 levels per student (9x their rate of progress over the previous 10 months in Grade 1). Grade 2: average gain of over 2 levels per student (3x their rate of progress over the previous 20 months in Grades 1 & 2). Grade 3: average gain of 4 levels per student (2.5x their rate of progress over the previous 30 months in Grades 1, 2 & 3).")
116
Elementary Literacy Reading Racer January Data 2009 Summer Data
Current Grade Growth in reading levels over the Summer Growth in reading levels from July to January 2 (9x’s school growth) (0.42/ month) 3 (5x’s school growth) (0.59/ month) 4 (not possible to calculate:negative) (-0.13/month)
 1.69 (0.42/ month) (5x’s school growth) 2.37 (0.59/ month) (not possible to calculate:negative) 0.5 (-0.13/month)")
117
Elementary Literacy Follow up: Cohort Data Tracking
Student progress was checked in January. Student progress was monitored on school learner profile boards. Cohort Data Tracking DART data for grade two Rocket Readers Classes (now in grade 3). All 15 students were not yet meeting district expectations in June 2009. cohort Did Not Write the DART Not Yet Meeting Minimally Meeting Fully Meeting Exceeding 15 students 2 (1 boys,1 girl) 13 % 6 (6 boys) 40% 1 (1 girl) 7% 5 (3 boys, 2 girls) 34% 1 (1 boy)
![]()
120
Elementary Literacy What did we learn? (cont’d)
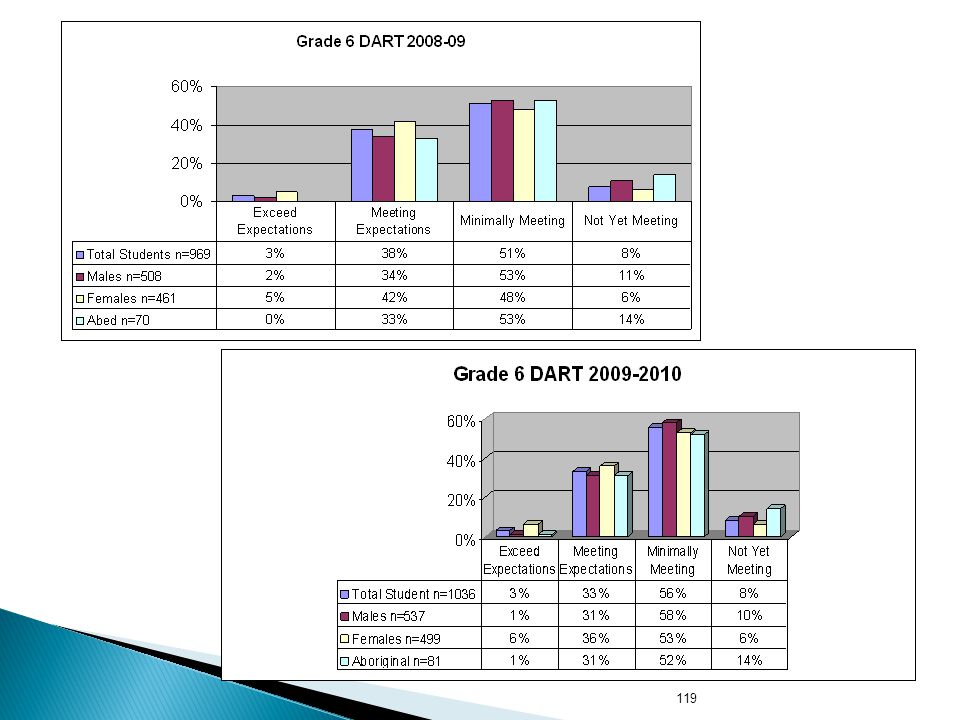
DART (See Supporting Documents). As a district we have been collecting DART data as an Assessment OF Learning tool since June 2006. Although slightly improved in grade 3, our results have been consistent but of concern is the significant % of students who fall within the Minimally Meeting (MM) category.
. As a district we have been collecting DART data as an Assessment OF Learning tool since June Although slightly improved in grade 3, our results have been consistent but of concern is the significant % of students who fall within the Minimally Meeting (MM) category.")
121
Elementary Literacy What did we learn? (cont’d)
This spring (2009), we moved to a district mark of the DART to see if this would a) impact the data, b) give us a district perspective of the students who are in the Minimally Meeting category. Our DART results this year are similar to those of previous years. Teachers who marked the DART felt that the four point rating scale was challenging.
, we moved to a district mark of the DART to see if this would a) impact the data, b) give us a district perspective of the students who are in the Minimally Meeting category. Our DART results this year are similar to those of previous years. Teachers who marked the DART felt that the four point rating scale was challenging.")
122
2009 / 2010 FSA Results FSA Results There was a significant increase in participation rates from 2008/09 and peaked at 85 % in 2009 /10 Grade 4 Grade 7

123
Elementary Literacy What do we know?
When we compare the 2008/09 grade 6 DART Reading results to the 2009/10 grade 7 FSA results we see a significant increase in students not meeting expectations by their grade 7 year. Current Grade 7 Cohort Not Yet Min Meeting Meeting Exceeding Grade 6 DART 08/09 8% 51 % 38 % 3 % Grade 7 FSA 09/10 26 % 47 % 7 %

124
Elementary Literacy What did we learn?
When we compare the 2008/09 grade 3 DART Reading results to the 2009/10 grade 4 FSA results we see a significant increase in students not meeting expectations by their grade 4 year. Current Grade 4 Cohort Not Yet Min Meeting Meeting Exceeding Grade 3 DART 08/09 8% 45 % 46 % 2 % Grade 4 FSA 09/10 20 % 55 % 10 %

125
Elementary Literacy Where to next?
Follow up with the following schools who have very strong grade 4 FSA scores to try to discover the common thread. Follow up with the following schools who have strong grade 7 FSA scores to try to discover the common thread. Share best practices with teachers and continue to support teacher’s professional development. Involve teachers in a district wide data review that looks at all aspects of educational data and reporting.

126
ABORIGINAL EDUCATION A Focus on success for all Aboriginal Students and aligning our Achievement Contract with the Aboriginal Enhancement Agreement

127
Aboriginal Enhancement Agreement
It is important that as we create our Aboriginal Focus in the Achievement Contract that it totally aligns with all we have committed to do in the Aboriginal Enhancement Agreement.

128
Aboriginal Enhancement Agreement
Our 3rd Aboriginal Education Enhancement Agreement was signed on March 3rd, 2010. It will officially cover the period of time from July 1st, 2010 to June 30th, 2015. We are the first district in British Columbia to sign a 3rd Aboriginal Education Enhancement Agreement (EA). The EA has two main goals with several objectives.
. The EA has two main goals with several objectives.")
129
Aboriginal Education Enhancement Agreement Goals
GOAL 1: TO IMPROVE ABORIGINAL STUDENTS’ SUCCESS IN SCHOOL DISTRICT NO. 42 Objective 1.1 Literacy: Improve reading and writing skills at all grade levels. Objective 1.2: Numeracy: Improve numeracy skills at all grade levels. Objective 1.3: Increase Grade to Grade Transition Rates. Objective 1.4: Increase Graduation and Successful School Completion Rates. GOAL 2: TO IMPROVE ABORIGINAL STUDENTS’ SENSE OF BELONGING IN SCHOOL DISTRICT NO. 42 Objective 2.1: Enhance Aboriginal students’ sense of belonging. Objective 2.2: Increase the knowledge of and respect for aboriginal culture and history for all students.

130
Aboriginal Education Enhancement Agreement
GOAL 1: TO IMPROVE ABORIGINAL STUDENTS’ SUCCESS IN SCHOOL DISTRICT 42 Objective 1.1 Literacy: Improve reading and writing skills at all grade levels. Objective 1.2: Numeracy: Improve numeracy skills at all grade levels. Objective 1.3: Increase Grade to Grade Transition Rates. Objective 1.4: Increase Graduation and Successful School Completion Rates. This goal has and will continue to be addressed and reported on through the Elementary and Secondary sections. We will work collaboratively on providing resources and interventions for our Aboriginal Learners.

131
Aboriginal Education Enhancement Agreement
GOAL 2: TO IMPROVE ABORIGINAL STUDENTS’ SENSE OF BELONGING Objective 2.1: Enhance Aboriginal students’ sense of belonging. Objective 2.2: Increase the knowledge of and respect for aboriginal culture and history for all students. Creating the Aboriginal Cultural Mentor position and building cultural knowledge and skill capacity within the department staff to focus more on students’ sense of belonging at school and an overall cultural awareness ‘for all’ has resulted in an increase in the number of aboriginal students and families self-identifying every year over the past 4 years.

132
Aboriginal Education What are we happy about and proud to show with this data? The continued increase in aboriginal student numbers through self-identification is significant, despite an overall decline in the district enrollment: 2006/ aboriginal students 2007/ aboriginal students 2008/ aboriginal students 2009/ aboriginal students Feb aboriginal students

133
Aboriginal Education What are we happy about and proud to show with this data? (cont’d) Increased participation in cultural activities and events across the district is also contributing to the aboriginal community feeling a sense of belonging with the schools and the district. Aboriginal Achievement Awards 2006/07 Sto:lo Awards participants 2007/08 Dist. 42 Awards 400 participants 2008/09 Dist. 42 Awards 540 participants 2009/10 Dist. 42 Awards 600 participants District Carving Project 2007/ aboriginal students 2008/ aboriginal students 2009/ aboriginal students

134
Aboriginal Education What are we happy about and proud to show with
this data? (cont’d) In 2010, our third annual IGNITE/IBM Academy for 52 grade 6 aboriginal students was the largest Ignite Academy held in Canada. The collaborative efforts of the district and the Aboriginal community have resulted in SD 42 being the first school district in British Columbia to sign a 3rd Aboriginal Enhancement Agreement on March 3rd, 2010.
 In 2010, our third annual IGNITE/IBM Academy for 52 grade 6 aboriginal students was the largest Ignite Academy held in Canada. The collaborative efforts of the district and the Aboriginal community have resulted in SD 42 being the first school district in British Columbia to sign a 3rd Aboriginal Enhancement Agreement on March 3rd,")
135
Aboriginal Education Maintain what we have been doing well.
What have we discovered you would like to change, alter or refocus on as a result of what you have found? Maintain what we have been doing well. Improve grade to grade transition rates Improve graduation rates. Continue to work collaboratively with all of our partners in learning to achieve the goals of the Enhancement Agreement concurrently with the goals of the Achievement Contract.

136
Aboriginal Education Summary
Successful aboriginal education programs are built upon a foundation of trust and positive relationships. The generation of students we are working with now are the sons and daughters of residential school survivors. Many of the parents are not familiar with our present day schools and the opportunities they present, and many do not trust schools based on their own negative experiences.

137
Aboriginal Education Summary (cont’d)
Many school employees as well are not aware of the long lasting negative impact that 150 years of residential schools has had on the aboriginal community. Many are not aware that the last residential school closed in 1996, and that the impact of these schools spans several generations in families. There is a need to build a bridge between the aboriginal community and the school district through a shared understanding, awareness and respect. I believe we are laying the foundation for that bridge for this and future generations.

138
ACHIEVEMENT CONTRACT SCHOOL DISTRICT #42 MAPLE RIDGE / PITT MEADOWS
Summary

139
Achievement Contract Summary
Although there are many more innovative and powerful practices going on for students in our district, the Achievement Contract allows us to focus on specific areas that data has shown, needs our attention. The Achievement Contract also allows the District to honor and celebrate areas where achievement improvements have taken place.

140
Achievement Contract Summary (cont’d)
The Achievement Contract will continue to allow us to Review our practice, analyze data to support our practice and make adjustments and changes to improve what we do in the following years. Using a format of Continuous Improvement which is Plan, Do, Check, Act (the Achievement Contract Process), it allows us to get to Excellence for the students in our care.
, it allows us to get to Excellence for the students in our care.")
141
Board of Education Approval
The District Achievement Contract was approved by the Board of Education at its public meeting on June 30, Board Meeting.

Similar presentations


>")


>")


