Download presentation
Presentation is loading. Please wait.

1
El Nino - Southern Oscillation

3
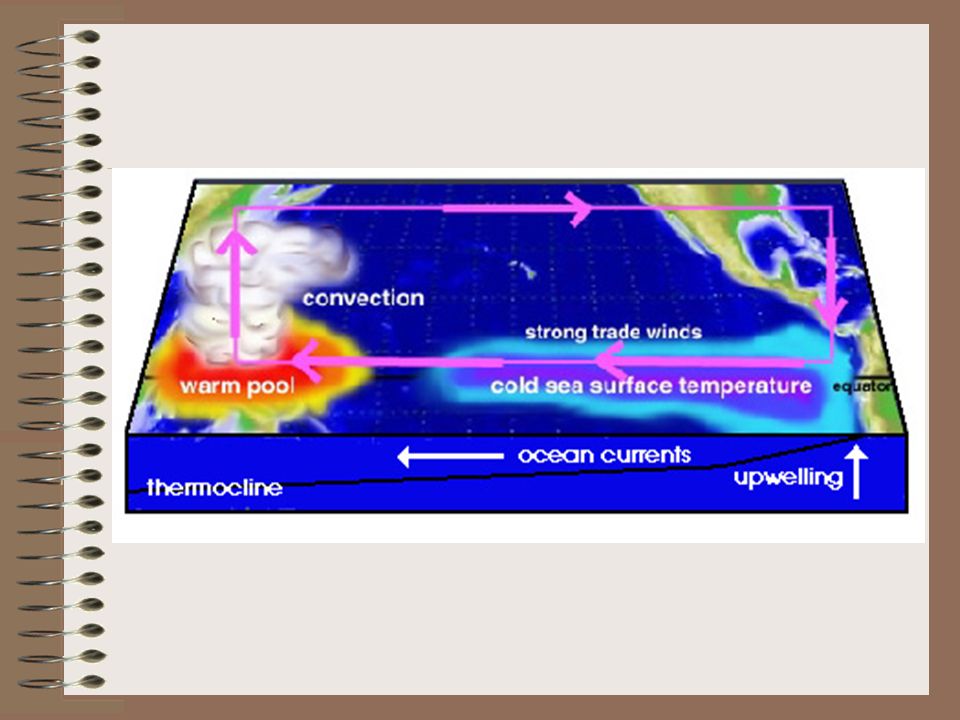
“normal” or “neutral” Equatorial trade winds blow westward
Water “piles up” in western Pacific Ocean Water is warmer in western Pacific Ocean Upwelling of colder water in eastern Pacific Ocean Normal precip patterns

6
What is the jet stream? Current of air flowing 150 to 300 mph
High in troposphere (about 10 km) Over the boundary between 2 air masses. Usually blows from west to east. Aircraft can use or avoid a jet stream.
 Over the boundary between 2 air masses. Usually blows from west to east. Aircraft can use or avoid a jet stream.")
7
RETURN OPTIONS: BASIC GRAPHICS MODE | LIMITED GRAPHICS MODE | FULL GRAPHICS MODE

9
What causes the jet stream?
The temperature difference between 2 air masses. The greater the temp. diff., the faster the jet stream. Seasons (temp. diff.) can cause jet stream to shift position. Also the ENSO.
 can cause jet stream to shift position. Also the ENSO.")
12
El Nino Tradewinds slow and/or stop Warm water covers more of equator
No upwelling in eastern Pacific Ocean (collapse of fishing industry in Peru) Global change in weather patterns
 Global change in weather patterns.")
13
NOAA / PMEL / TAO Project Office / El Niño Theme Page
What are La Niña, El Niño and Normal Conditions in the tropical Pacific Ocean? See What is La Nina? Go to the El Niño Theme Page Disclaimer | Privacy Policy La Niña is characterized by unusually cold ocean temperatures in the equatorial Pacific. El Niño is characterized by unusually warm ocean temperatues in the Equatorial Pacific Ocean. These are graphics of the Reynolds Sea Surface Temperature (SST) analysis from the National Center for Environmental Prediction (NCEP) for the entire Pacific Ocean (70N to 70S). Also see plots of the Sea Surface Temperature Anomalies (the amount that the temperature differs from the normal value for the month). Also available is a graph of sea surface temperature for the entire Pacific Ocean. Graphics are provided by the TAO project and created by Dai McClurg. You can also see animations of the Reynolds SST and TAO buoy SST from the TAO realtime data page.
 analysis from the National Center for Environmental Prediction (NCEP) for the entire Pacific Ocean (70N to 70S). Also see plots of the Sea Surface Temperature Anomalies (the amount that the temperature differs from the normal value for the month). Also available is a graph of sea surface temperature for the entire Pacific Ocean. Graphics are provided by the TAO project and created by Dai McClurg. You can also see animations of the Reynolds SST and TAO buoy SST from the TAO realtime data page.")
15
El Niño effect during December through February.
El Nino Dec - Feb

17
La Nina Increased velocity of westward tradewinds
Colder water along more of equator (eastern end) Global change in weather patterns
 Global change in weather patterns.")
20
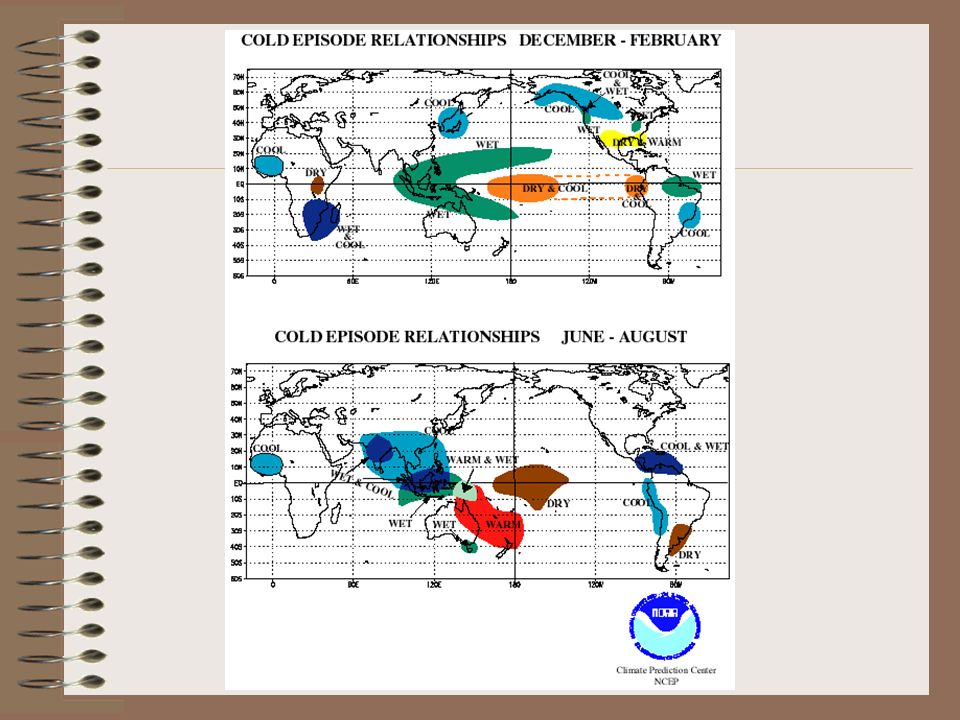
La Niña effect during December through February.

21
La Niña effect during June through August.

23
How to forecast the ENSO cycle?
Need info about SST, ocean temperatures at depth and winds.

24
Array of TAO/TRITON Approx 70 moorings w/ about 400 buoys
Completed Dec 1994 after 10 years 17 ships on 83 cruises from 6 countries (multi-national) In Oct 1999, Japan assumed responsibility for western Pacific moorings (TRITON)
 In Oct 1999, Japan assumed responsibility for western Pacific moorings (TRITON)")
25
TAO/TRITON Tropical Atmosphere & Ocean
Motivated by El Nino event

28
Home | Project overview | Data display | Data delivery | El Niño & La Niña | Site map TAO Project Office NOAA | Pacific Marine Environmental Laboratory 7600 Sand Point Way NE Seattle, WA Credits | Disclaimer |Privacy Policy

29
A warning to vandals

30
What is the Tropical Atmosphere-Ocean
Moored Buoys of the Tropical Atmosphere-Ocean Array What is the Tropical Atmosphere-Ocean

31
Data from TAO/TRITON Wind velocity SST (sea surface temperatures)
Air temp 10 sub-surface temp’s to depth of 500 meters

34
Put the TAO/TRITON data into a computer model
Now can forecast path of storm track

35
Note that the location of the jetstream is influenced by the location of the convection, e.g. the main mean jetstream for La Niña starts to the left of the normal scenario. These are the teleconnections to our mid-latitude weather.

36
Benefits of accurate ENSO forecasts
(hopefully, with predictions up to one year)
")
37
Drought forecasts Preparation for wildfires
Cultivation of drought-tolerant crops Plan food distribution in developing countries

38
Forecast of Excessive Precipitation
Preparation for extremes: hurricanes, tornadoes, etc Preparation for local flooding: mudslides Mosquito control in malarial zones Planting of wet-tolerant crops

39
Forecast of change in ocean temperatures
Predict profitable fishery sites Monitor health of coral reef ecosystems

40
Economic benefits from forecasts
Adjust the production of weather-related goods: vehicles, clothing, shelter Adapt use of recreational facilities: skiing, snowboarding, boating Prepare for fluctuations in consumption of home-heating fuels

41
Review What is ENSO?

42
ENSO The El Nino-Southern Oscillation Cycle
During normal years, equatorial trades blow west Ocean is 0.5 m higher & warmer in western Pacific Upwelling currents in eastern Pacific 20 – 30 cm annual precip in San Diego (8 to 12 inches)
")
43
b. Normal scenario

44
What happens during El Nino?

45
a. El Niño

47
What happens during La Nina?

51
Note that the location of the jetstream is influenced by the location of the convection, e.g. the main mean jetstream for La Niña starts to the left of the normal scenario. These are the teleconnections to our mid-latitude weather.

52
For more info about ENSO
search NOAA For more info about ENSO

53
The end

Similar presentations


>")
 Physical Oceanography>")


 –Tropical Pacific: El Nino/Southern Oscillation –Southern Ocean.>")


 Anomalies on the Climate of Southern South Carolina and Northern Coastal Georgia ” Whitney Albright Joseph.>")

