Download presentation
Presentation is loading. Please wait.

1
Fundamentals of Bayesian Inference

2
Brief Introduction of Your Lecturer
I am working at the Psychological Methods Group at the University of Amsterdam. For the past 10 years or so, one of my main research interests has been Bayesian statistics. I have been promoting Bayesian inference in psychology, mainly through a series of articles, workshops, and one book.

3
The Bayesian Book …is a course book used at UvA and UCI.
…will appear in print soon. ….is freely available at (well, the first part is freely available)
")
5
August 12 - August 16, 2013 University of Amsterdam
Bayesian Modeling for Cognitive Science A WinBUGS Workshop August 12 - August 16, 2013 University of Amsterdam

6
Why Do Bayesian Modeling
It is fun. It is cool. It is easy. It is principled. It is superior. It is useful. It is flexible.

7
Our Goals This Afternoon Are…
To discuss some of the fundamentals of Bayesian inference. To make you think critically about statistical analyses that you have always taken for granted. To present clear practical and theoretical advantages of the Bayesian paradigm.

8
Want to Know More About Bayes?

9
Want to Know More About Bayes?

10
Prelude Eric-Jan Wagenmakers

11
Three Schools of Statistical Inference
Neyman-Pearson: α-level, power calculations, two hypotheses, guide for action (i.e., what to do). Fisher: p-values, one hypothesis (i.e., H0), quantifies evidence against H0. Bayes: prior and posterior distributions, attaches probabilities to parameters and hypotheses.
. Fisher: p-values, one hypothesis (i.e., H0), quantifies evidence against H0. Bayes: prior and posterior distributions, attaches probabilities to parameters and hypotheses.")
12
A Freudian Analogy Neyman-Pearson: The Superego. Fisher: The Ego.
Bayes: The Id. Claim: What Id really wants is to attach probabilities to hypotheses and parameters. This wish is suppressed by the Superego and the Ego. The result is unconscious internal conflict.

13
Internal Conflict Causes Misinterpretations
p < .05 means that H0 is unlikely to be true, and can be rejected. p > .10 means that H0 is likely to be true. For a given parameter μ, a 95% confidence interval from, say, a to b means that there is a 95% chance that μ lies in between a and b.

14
Two Ways to Resolve the Internal Conflict
Strengthen Superego and Ego by teaching the standard statistical methodology more rigorously. Suppress Id even more! Give Id what it wants.

15
The Unfortunate Case of Sally Clark
Sentenced by p-value The Unfortunate Case of Sally Clark

16
The Case of Sally Clark Sally Clark had two children die of SIDS.
The chances of this happening are perhaps as small as 1 in 73 million: 1/8543 × 1/8543. Can we reject the null hypothesis that Sally Clark is innocent, and send her to jail? Yes, according to an expert for the prosecution, Prof. Meadow.

17
Prof. Roy Meadow, Britisch Paediatrician
“Meadow attributed many unexplained infant deaths to the disorder or condition in mothers called Münchausen Syndrome by Proxy.” “According to this diagnosis some parents, especially mothers, harm or even kill their children as a means of calling attention to themselves.” (Wikepedia)
")
18
Meadow’s Law “One cot death is a tragedy, two cot deaths is suspicious and, until the contrary is proved, three cot deaths is murder.”

19
The Outcome In November 1999, Sally Clark was convicted of murdering both babies by a majority of 10 to 2 and sent to jail.

20
The Outcome Note the similarity to p-value hypothesis testing. A very rare event occurred, prompting the law system to reject the null hypothesis (“Sally is innocent”) and send Sally to jail.
 and send Sally to jail.")
21
Critique The focus is entirely on the low probability of the deaths arising from SIDS. But what of the probability of the deaths arising from murder? Isn’t this probability just as relevant? How likely is it that a mother murders her two children?

22
2002 Royal Statistical Society Open Letter
“The jury needs to weigh up two competing explanations for the babies’ deaths: SIDS or murder. The fact that two deaths by SIDS is quite unlikely is, taken alone, of little value. Two deaths by murder may well be even more unlikely.What matters is the relative likelihood of the deaths under each explanation, not just how unlikely they are under one explanation.” President Peter Green to the Lord Chancellor

23
What is the p-value? “The probability of obtaining a test statistic at least as extreme as the one you observed, given that the null hypothesis is true.”

24
The Logic of p-Values The p-value only considers how rare the observed data are under H0. The fact that the observed data may also be rare under H1 does not enter consideration. Hence, the logic of p-values has the same flaw as the logic that lead to the sentencing of Sally Clark.

25
Adjusted Open Letter “Researchers need to weigh up two competing explanations for the data: H0 or H1. The fact that data are quite unlikely under H0 is, taken alone, of little value. The data may well be even more unlikely under H1.What matters is the relative likelihood of the data under each model, not just how unlikely they are under one model.”

26
What is Bayesian Inference? Why be Bayesian?

27
What is Bayesian Inference?

28
What is Bayesian Inference?
“Common sense expressed in numbers”

29
What is Bayesian Inference?
“The only statistical procedure that is coherent, meaning that it avoids statements that are internally inconsistent.”

30
What is Bayesian Statistics?
“The only good statistics” [For more background see Lindley, D. V. (2000). The philosophy of statistics. The Statistician, 49, ]
. The philosophy of statistics. The Statistician, 49, ]")
31
Outline Bayes in a Nutshell The Bayesian Revolution Hypothesis Testing

32
Bayesian Inference in a Nutshell
In Bayesian inference, uncertainty or degree of belief is quantified by probability. Prior beliefs are updated by means of the data to yield posterior beliefs.

33
Bayesian Parameter Estimation: Example
We prepare for you a series of 10 factual questions of equal difficulty. You answer 9 out of 10 questions correctly. What is your latent probability θ of answering any one question correctly?

34
Bayesian Parameter Estimation: Example
We start with a prior distribution for θ. This reflect all we know about θ prior to the experiment. Here we make a standard choice and assume that all values of θ are equally likely a priori.

35
Bayesian Parameter Estimation: Example
We then update the prior distribution by means of the data (technically, the likelihood) to arrive at a posterior distribution. The posterior distribution is a compromise between what we knew before the experiment and what we have learned from the experiment. The posterior distribution reflects all that we know about θ.
 to arrive at a posterior distribution. The posterior distribution is a compromise between what we knew before the experiment and what we have learned from the experiment. The posterior distribution reflects all that we know about θ.")
36
Mode = 0.9 95% confidence interval: (0.59, 0.98)
")
37
The Inevitability of Probability
Why would one measure “degree of belief” by means of probability? Couldn’t we choose something else that makes sense? Yes, perhaps we can, but the choice of probability is anything but ad-hoc.

38
The Inevitability of Probability
Assume “degree of belief” can be measured by a single number. Assume you are rational, that is, not self-contradictory or “obviously silly”. Then degree of belief can be shown to follow the same rules as the probability calculus.

39
The Inevitability of Probability
For instance, a rational agent would not hold intransitive beliefs, such as:

40
The Inevitability of Probability
When you use a single number to measure uncertainty or quantify evidence, and these numbers do not follow the rules of probability calculus, you can (almost certainly?) be shown to be silly or incoherent. One of the theoretical attractions of the Bayesian paradigm is that it ensures coherence right from the start.
 be shown to be silly or incoherent. One of the theoretical attractions of the Bayesian paradigm is that it ensures coherence right from the start.")
41
Coherence I Coherence is also key in de Finetti’s conceptualization of probability.

42
Coherence II One aspect of coherence is that “today’s posterior is tomorrow’s prior”. Suppose we have exchangeable (iid) data x = {x1, x2}. Now we can update our prior using x, using first x1 and then x2, or using first x2 and then x1. All the procedures will result in exactly the same posterior distribution.
 data x = {x1, x2}. Now we can update our prior using x, using first x1 and then x2, or using first x2 and then x1. All the procedures will result in exactly the same posterior distribution.")
43
Coherence III Assume we have three models: M1, M2, M3.
After seeing the data, suppose that M1 is 3 times more plausible than M2, and M2 is 4 times more plausible than M3. By transitivity, M1 is 3x4=12 times more plausible than M3.

44
Outline Bayes in a Nutshell The Bayesian Revolution Hypothesis Testing

45
The Bayesian Revolution
Until about 1990, Bayesian statistics could only be applied to a select subset of very simple models. Only recently, Bayesian statistics has undergone a transformation; With current numerical techniques, Bayesian models are “limited only by the user’s imagination.”

46
The Bayesian Revolution in Statistics

47
The Bayesian Revolution in Statistics

48
Why Bayes is Now Popular
Markov chain Monte Carlo!

49
Markov Chain Monte Carlo
Instead of calculating the posterior analytically, numerical techniques such as MCMC approximate the posterior by drawing samples from it. Consider again our earlier example…

51
Mode = 0.89 95% confidence interval: (0.59, 0.98) With 9000 samples, almost identical to analytical result.

53
Want to Know More About MCMC?

54
MCMC With MCMC, the models you can build and estimate are said to be “limited only by the user’s imagination”. But how do you get MCMC to work? Option 1: write the code yourself. Option 2: use WinBUGS/JAGS/STAN!

55
Want to Know More About WinBUGS?

56
Outline Bayes in a Nutshell The Bayesian Revolution Hypothesis Testing

57
Intermezzo Confidence Intervals

58
Frequentist Inference
Procedures are used because they do well in the long run, that is, in many situations. Parameters are assumed to be fixed, and do not have a probability distribution. Inference is pre-experimental or unconditional.

59
Confidence Intervals Width = 1 Mean = μ

60
Confidence Intervals x y μ Width = 1 Draw a random number x.
Draw another random number y. What is the probability that it will lie to the other side of μ? x y μ Width = 1

61
Confidence Intervals x y μ Width = 1
When we repeated this procedure many times , the mean μ will lie in the interval in 50% of the cases. Hence, the interval (x, y) with y > x is a 50% confidence interval for μ. x y μ Width = 1
 with. y > x is a 50% confidence interval for μ. x. y. μ. Width = 1.")
62
Confidence Intervals x y μ Width = 1
But now you observe the following data: x y μ Width = 1

63
Confidence Intervals x y μ Width = 1
Because the width of the distribution is 1, I am 100% confident that the mean lies in the 50% confidence interval! x y μ Width = 1

64
Why? Frequentist procedures have good pre-experimental properties and are designed to work well for most data. For particular data, however, these procedures may be horrible. For more examples see the 1988 book by Berger & Wolpert, “the likelihood principle”.

65
Bayesian Hypothesis Testing In Nested Models
Harold Jeffreys Jeff Rouder

66
Bayesian Hypothesis Testing: Example
We prepare for you a series of 10 factual true/false questions of equal difficulty. You answer 9 out of 10 questions correctly. Have you been guessing?

67
Bayesian Hypothesis Testing: Example
The Bayesian hypothesis test starts by calculating, for each model, the (marginal) probability of the observed data. The ratio of these quantities is called the Bayes factor:
 probability of the observed data. The ratio of these quantities is called the Bayes factor:")
68
Bayesian Model Selection
Prior odds Posterior odds Bayes factor

69
Bayesian Hypothesis Test
Prob. of Data Under the Null Hypothesis Prob. of Data Under the Alternative Hypothesis The result is known as the Bayes factor. Solves the problem of disregarding H1!

70
Guidelines for Interpretation of the Bayes Factor
BF Evidence 1 – Anecdotal 3 – Substantial 10 – Strong 30 – Very strong > Decisive

71
Bayesian Hypothesis Testing: Example
BF01 = p(D|H0) / p(D|H1) When BF01 = 2, the data are twice as likely under H0 as under H1. When, a priori, H0 and H1 are equally likely, this means that the posterior probability in favor of H0 is 2/3.
 / p(D|H1) When BF01 = 2, the data are twice as likely under H0 as under H1. When, a priori, H0 and H1 are equally likely, this means that the posterior probability in favor of H0 is 2/3.")
72
Bayesian Hypothesis Testing: Example
The complication is that these so-called marginal probabilities are often difficult to compute. For this simple model, everything can be done analytically…

73
Bayesian Hypothesis Testing: Example
BF01 = p(D|H0) / p(D|H1) = 0.107 This means that the data are 1/ = 9.3 times more likely under H1, the “no-guessing” model. The associated posterior probability for H0 is about 0.10. For more interesting models, things are never this straightforward!
 / p(D|H1) = This means that the data are 1/ = 9.3 times more likely under H1, the no-guessing model. The associated posterior probability for H0 is about For more interesting models, things are never this straightforward!")
74
Savage-Dickey When the competing models are nested (i.e., one is a more complex version of the other), Savage and Dickey have shown that, in our example,
, Savage and Dickey have shown that, in our example,")
75
Savage-Dickey Height of posterior distribution at point of interest
Height of prior distribution at point of interest

76
Height of prior = 1 Height of posterior = 0.107; Therefore, BF01 = 0.107/1 =

77
Advantages of Savage-Dickey
In order to obtain the Bayes factor you do not need to integrate out the model parameters, as you would do normally. Instead, you only needs to work with the more complex model, and study the prior and posterior distributions only for the parameter that is subject to test.

78
Intermezzo In-Class Exercise...

79
Practical Problem Dr. John proposes a Seasonal Memory Model (SMM), which quickly becomes popular. Dr. Smith is skeptical, and wants to test the model. The model predicts that the increase in recall performance due to the intake of glucose is more pronounced in summer than in winter. Dr. Smith conducts the experiment…

80
Practical Problem And finds the following results:
For these data, t = 0.79, p = .44. Note that, if anything, the result goes in the direction opposite to that predicted by the model.

81
Practical Problem Dr. Smith reports his results in a paper entitled “False Predictions from the SMM: The impact on glucose and the seasons on memory”, which he submits to the Journal of Experimental Psychology: Learning, Memory, and Seasons. After some time, Dr. Smith receives three reviews, one signed by Dr. John, who invented the SMM. Part of this review reads:

82
Practical Problem “From a null result, we cannot conclude that no difference exists, merely that we cannot reject the null hypothesis. Although some have argued that with enough data we can argue for the null hypothesis, most agree that this is only a reasonable thing to do in the face of a sizeable amount of data [which] has been collected over many experiments that control for all concerns. These conditions are not met here. Thus, the empirical contribution here does not enable readers to conclude very much, and so is quite weak (...).”
.")
83
Practical Problem How can Dr. Smith analyze his results and quantify exactly the amount of support in favor of H0 versus the SMM?

84
Helping Dr. Smith Recall, however, that in the case of Dr. Smith the alternative hypothesis was directional; SMM predicted that the increase should be larger in summer than in winter – the opposite pattern was obtained. We’ll develop a test that can handle directional hypotheses, and some other stuff also.

85
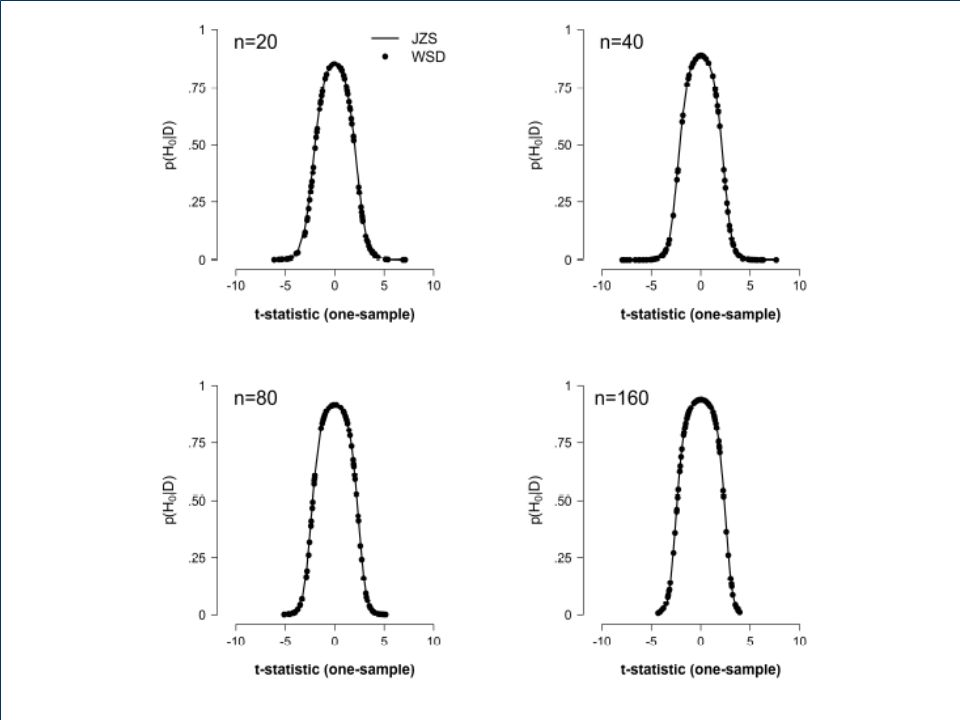
WSD t-test WSD stands for WinBUGS Savage Dickey t-test.
We’ll use WinBUGS to get samples from the posterior distribution for parameter δ, which represents effect size. We’ll then use the Savage-Dickey method to obtain the Bayes factor. Our null hypothesis is always δ = 0.

86
Graphical Model for the One-Sample t-test

88
WSD t-test The t-test can be implemented in WinBUGS.
We get close correspondence to Rouder et al.’s analytical t-test. The WSD t-test can also be implemented for two-sample tests (in which the two groups can also have different variances). Here we’ll focus on the problem that still plagues Dr. Smith…
. Here we’ll focus on the problem that still plagues Dr. Smith…")
89
Helping Dr. Smith (This Time for Real)
The Smith data (t = 0.79 , p = .44) This is a within-subject experiment, so we can subtract the recall scores (winter minus summer) and see whether the difference is zero or not.
 This is a within-subject experiment, so we can subtract the recall scores (winter minus summer) and see whether the difference is zero or not.")
90
Dr. Smith Data: Non-directional Test
NB: Rouder’s test also gives BF01 = 6.08

91
Dr. Smith Data: SMM Directional Test
This means that p(H0|D) is about 0.93 (in case H0 and H1 are equally likely a priori)
 is about 0.93 (in case H0 and H1 are equally likely a priori)")
92
Dr. Smith Data: Directional Test Inconsistent with SMM’s prediction

93
Helping Dr. Smith (This Time for Real)
According to our t-test, the data are about 14 times more likely under the null hypothesis than under the SMM hypothesis. This is generally considered strong evidence in favor of the null. Note that we have quantified evidence in favor of the null, something that is impossible in p-value hypothesis testing.

94
Practical Consequences: A Psych Science Example
Experiment 1: “participants who were unobtrusively induced to move in the portly way that is associated with the overweight stereotype ascribed more stereotypic characteristics to the target than did control participants, t(18) = 2.1, p < .05.” NB. The Bayes factor is 1.59 in favor of H1 (i.e., “only worth a bare mention”)
 = 2.1, p < .05. NB. The Bayes factor is 1.59 in favor of H1 (i.e., only worth a bare mention )")
95
Practical Consequences: A Psych Science Example
Experiment 2: “participants who were induced to engage in slow movements that are stereotypic of the elderly judged Angelika [a hypothetical person described in ambiguous terms - EJ] to be more forgetful than did control participants, t(35) = 2.1, p < .05.” NB. The Bayes factor is 1.52 in favor of H1 (i.e., “only worth a bare mention”).
 = 2.1, p < .05. NB. The Bayes factor is 1.52 in favor of H1 (i.e., only worth a bare mention ).")
96
Practical Consequences: A Psych Science Example
The author has somehow obtained a p-value smaller than .05 in both experiments. Unfortunately (for the field), this constitutes little evidence in favor of the alternative hypothesis. Note also that the prior plausibility of the alternative hypothesis is low. Extraordinary claims require extraordinary evidence!
, this constitutes little evidence in favor of the alternative hypothesis. Note also that the prior plausibility of the alternative hypothesis is low. Extraordinary claims require extraordinary evidence!")
97
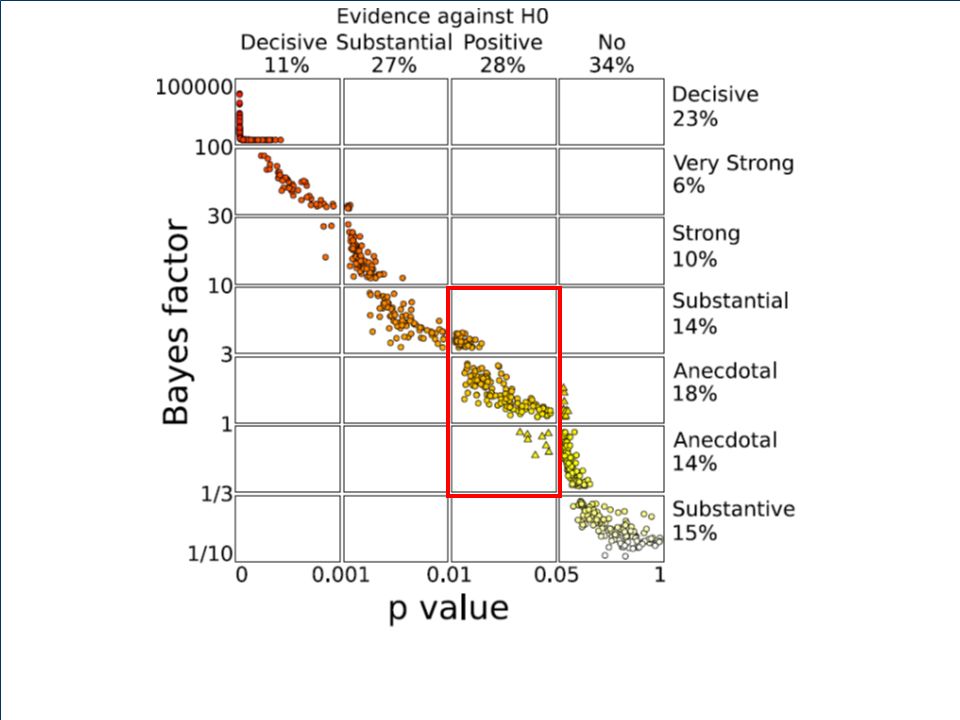
Empirical Comparison In 252 articles, spanning 2394 pages, “we” found 855 t-tests. This translates to an average of one t-test for every 2.8 pages, or about 3.4 t-tests per article. Details in Wetzels et al., 2011, Perspectives on Psychological Science.

99
Main Problem

100
Can People Look into the Future?
Intentions are posted online: design, intended analyses, the works.

101
Optional Stopping is Allowed
“It is entirely appropriate to collect data until a point has been proven or disproven, or until the data collector runs out of time, money, or patience.” Edwards, Lindman, & Savage, 1963, Psych Rev.

103
Inside every Non-Bayesian, there is a Bayesian struggling to get out
Dennis Lindley

Similar presentations


 2004 Brooks/Cole, a division of Thomson Learning, Inc. Chapter 8 Tests of Hypotheses Based on a Single Sample.>")

