Download presentation
Presentation is loading. Please wait.

1
The Human Population and Its Impact
Chapter 6

2
Core Case Study: Are There Too Many of Us? (1)
Estimated 2.4 billion more people by 2050 Are there too many people already? Will technological advances overcome environmental resistance that populations face? Should populations be controlled?

3
Core Case Study: Are There Too Many of Us?
Will growing populations cause increased environmental stresses? Infectious diseases Biodiversity losses Water shortages Traffic congestion Pollution of the seas Climate change

4
6-1 How Many People Can the Earth Support?
Concept 6-1 We do not know how long we can continue increasing the earth’s carrying capacity for humans without seriously degrading the life-support system for humans and many other species.

6
Human Population Growth Continues but It Is Unevenly Distributed
Reasons for human population increase Movement into new habitats and climate zones Early and modern agriculture methods Control of infectious diseases through Sanitation systems Antibiotics Vaccines

7
Human Population Growth Continues but It Is Unevenly Distributed (2)
Population growth in developing countries is increasing 15 times faster than developed countries By 2050, 97% of growth will be in developing countries Should the optimum sustainable population be based on cultural carrying capacity?

8
MI L I O NS

9
Population Projections
Over 95% of this increase will take place in “Developing Countries”

11
Current World Population
Population Clock Vital Events (per time unit) Global population was 6,901,260,547 US population- 310,859,059 On Feb. 20th 2011at 9:30 pm The global population grows by: Nearly 2.4 persons per second Nearly 8,607 persons per hour Over 206,563 persons per day Over 75 million persons per year Us. Population 308 million exactly 308,782,965 as of march 1st 2010
 Global population was 6,901,260,547 US population- 310,859,059. On Feb. 20th 2011at 9:30 pm. The global population grows by: Nearly 2.4 persons per second. Nearly 8,607 persons per hour. Over 206,563 persons per day. Over 75 million persons per year. Us. Population 308 million exactly 308,782,965 as of march 1st")
12
How Much is a Billion? 1,000 seconds = 16.7 minutes
1 million-s = 16,677 min = 11.6 days 1 billion-s = 11,574 days = 31.7 years 1,000 pennies = ~ 88 ounces = 5.5 pounds 1 million pennies = 5,500 pounds (~1-Suburban) 1 billion pennies = 2,750 tons (~2 Space Shuttles)
 1 billion pennies = 2,750 tons (~2 Space Shuttles)")
13
Billion Grains of Rice 200 grains of rice in a teaspoon
9,600 grains of rice in a cup (48 tsp) How many Cups are in a Gallon? 16 cups How many grains of rice are in 16 cups? 9,600 x 16 = 153,600 grains of rice How many gallons would it take to take to equal 1 million grains of rice? 1,000,000 divided by 153,600 = 6.5 Gallons = 1 million grains of rice
 How many Cups are in a Gallon 16 cups. How many grains of rice are in 16 cups 9,600 x 16 = 153,600 grains of rice. How many gallons would it take to take to equal 1 million grains of rice 1,000,000 divided by 153,600 = 6.5 Gallons = 1 million grains of rice.")
14
If 6.5 gallons equal 1 million how many gallons would it take to equal 1 billion?
6.5 gallons x 1000 = 6,500 gallons = 1 billion How many gallons would it take to equal 6.6 billion? 42,900 gallons of rice = 6.6 billion grains of rice.

15
Science Focus: How Long Can the Human Population Keep Growing?
Thomas Malthus and population growth: 1798 Humans have altered 83% of the earth’s land surface Can the human population grow indefinitely? Thomas Malthus published his famous Essay on Population in 1798 predicting that humanity was doomed to poverty and famine because the human population was growing exponentially, while mankind’s ability to produce food could only increase at a linear rate. He wrote at a time when the famous curve of human population growth was way down here. The ensuing science-based increases in agricultural production supported a tripling of the human

16
6-2 What Factors Influence the Size of the Human Population?
Concept 6-2A Population size increases because of births and immigration and decreases through deaths and emigration. Concept 6-2B The average number of children born to women in a population (total fertility rate) is the key factor that determines population size.
 is the key factor that determines population size.")
17
The Human Population Can Grow, Decline, or Remain Fairly Stable
Population change Births: fertility Deaths: mortality Migration Population change = (births + immigration) – (deaths + emigration) Crude birth rate- # births / 1000 population Crude death rate- # deaths / 1000 population
 – (deaths + emigration) Crude birth rate- # births / 1000 population. Crude death rate- # deaths / 1000 population.")
20
Rates of Global Pop. Change use: International Data Base http://www
Rates of Global Pop. Change use: International Data Base then Online Demographic Aggregation CBR (crude birth rate) = # births / 1000 population 1990: 24 now: 20.6 CDR (crude death rate) = # deaths / 1000 population 1990: 9 now: 8.8
 = # births / 1000 population. 1990: 24 now: CDR (crude death rate) = # deaths / 1000 population. 1990: 9 now: 8.8.")
21
Growth Rate = (b + i) – (d + e)
1990: 1.5% now: 1.19% growth rates have come down Annual rate of Natural Population change % = (BR – DR/1000) x 100 (BR-DR)/10
 x 100. (BR-DR)/10.")
22
Rule of 70 How long does it take to double? Rule of 70 Resource use
Population size Money in a savings account Rule of 70 70 divided by the percentage growth rate = doubling time in years 70 / 7% means it takes ten years to double Homework: YouTube- rule of 70- Albert Bartlett “Most important video you will ever see” 9 min.

23
Women Having Fewer Babies but Not Few Enough to Stabilize the World’s Population
Replacement fertility rate (RFR) The number of children a couple must have to replace their parents A RFR of 2.1 for developed countries with low infant and child mortality rates Africa RFR = 2.5 Total fertility rate (TFR) The average number of children born to a woman Average in developed countries = 1.5 Average in developing countries = 3.8 Worldwide 1990: 3.1 now: 2.76
 The number of children a couple must have to replace their parents. A RFR of 2.1 for developed countries with low infant and child mortality rates. Africa RFR = 2.5. Total fertility rate (TFR) The average number of children born to a woman. Average in developed countries = 1.5. Average in developing countries = 3.8. Worldwide 1990: 3.1 now:")
25
Total Fertility Rates for US
4.0 3.5 3.0 2.5 Births per woman 2.1 2.0 1.5 Baby boom ( ) Replacement level 1.0 Baby boom started at the end of WWII 0.5 1920 1930 1940 1950 1960 1970 1980 1990 2000 2010 Year
 Replacement. level Baby boom started at the end of WWII Year.")
26
Case Study: The U.S. Population Is Growing Rapidly
Drop in TFR in U.S. Rate of population growth has slowed Population still growing and not leveling off Fourfold increase since 1900 Changes in lifestyle in the U.S. during the 20th century

27
Several Factors Affect Birth Rates and Fertility Rates
Children as part of the labor force Cost of raising and educating children Availability of private and public pension Urbanization Educational and employment opportunities for women

28
Several Factors Affect Birth Rates and Fertility Rates
Infant mortality rate Average age of a woman at birth of first child Availability of legal abortions Availability of reliable birth control methods Religious beliefs, traditions, and cultural norms

29
Homes with flush toilets 98%
47 years Life expectancy 77 years Married women working outside the home 8% 81% 15% High school graduates 83% 10% Homes with flush toilets 98% 2% Homes with electricity 99% 10% Some major changes that took place between 1900 and Data from U.S. Bureau of the Census and department of Commerce. Living in suburbs 52% 1900 $3 Hourly manufacturing job wage (adjusted for inflation) 2000 $15 1.2 Homocides per 100,000 people 5.8
 $ Homocides per. 100,000 people")
30
Several Factors Affect Death Rates
Life expectancy Average # of years a newborn can expect to live Infant mortality rate (IMR) infant deaths per 1000 live births (infant < 1 yr) Why are people living longer and fewer infants dying? Increased food supply and distribution Better nutrition Medical advances Improved sanitation
 infant deaths per 1000 live. births (infant < 1 yr) Why are people living longer. and fewer infants dying Increased food supply and distribution. Better nutrition. Medical advances. Improved sanitation.")
31
Several Factors Affect Death Rates (2)
U.S. infant mortality rate high due to Inadequate health care for poor women during pregnancy and their infants Drug addiction among pregnant women High birth rate among teenagers

32
http://www. povertymap

33
Migration Affects an Area’s Population Size
Economic improvement Religious freedom Political freedom Wars Environmental refugees

34
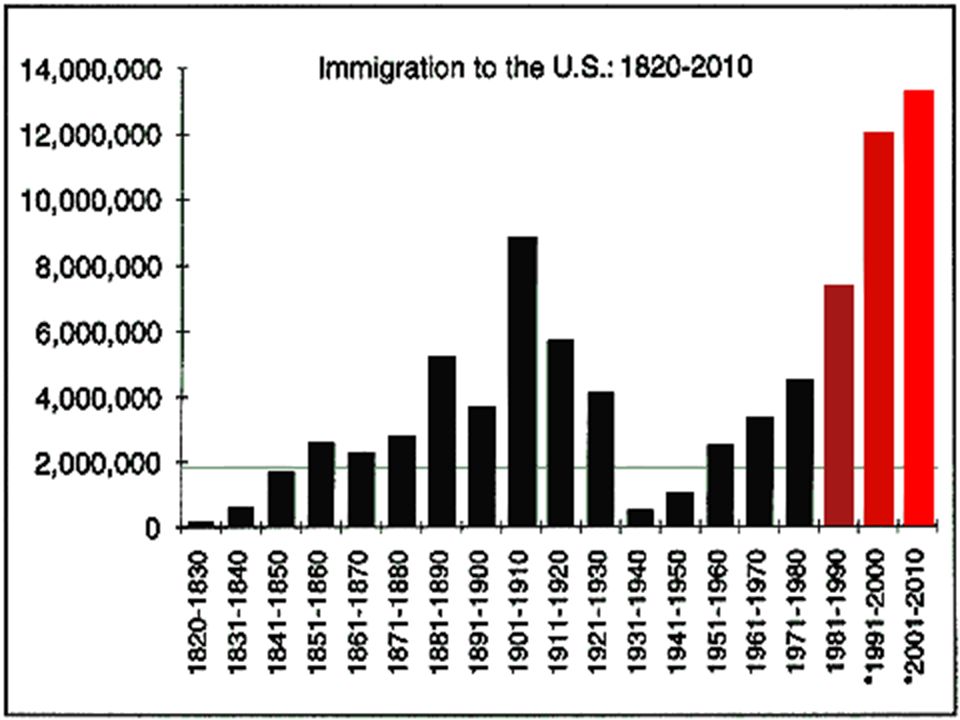
Case Study: The United States: A Nation of Immigrants
Historical role of immigration in the U.S. Opportunity for the world’s poor and oppressed Since 1820, the U.S. has admitted almost twice as many immigrants and refugees as all other countries combined Legal immigration Illegal immigration Legal and illegal immigration accounts for 40% of the country’s annual population growth

36
6-3 How Does a Population’s Age Structure Affect Its Growth or Decline?
Concept 6-3 The numbers of males and females in young, middle, and older age groups determine how fast a population grows or declines.

37
Population Pyramids Graphic device: bar graph
shows the age and gender composition of a region horizontal axis: gender male: left-hand female: right-hand absolute number of people or % vertical axis: age groups Pre-reproductive ages = birth –14 years of age Reproductive ages= 15 –44 years of age Post reproductive ages = 45 & up

38
Population Pyramid with young cohorts

39
Population Pyramids High Growth: Afghanistan
Population Pyramids on the Web High Growth: Afghanistan Moderate Growth: Mexico Zero Growth: U.S. Negative Growth: Austria or Italy

41
Population Pyramids Moderate Growth: Mexico
Population Pyramids on the Web High Growth: Afghanistan Moderate Growth: Mexico Zero Growth: U.S. Negative Growth: Austria or Italy

43
Population Pyramids Zero Growth: U.S. Population Pyramids on the Web
High Growth: Afghanistan Moderate Growth: Mexico Zero Growth: U.S. Negative Growth: Austria or Italy

45
Population Pyramids Negative Growth: Italy
Population Pyramids on the Web High Growth: Afghanistan Moderate Growth: Mexico Zero Growth: U.S. Negative Growth: Italy

47
We Can Use Age-Structure Information to Make Population and Economic Projections
Baby boomers Job market when they retire

48
Influencing Population Size Age Structure & Population Projections
Baby boomers - half of U.S. population; use most of goods and services; make political and economic decision baby-bust generation - born since 1965; may have to pay more income, health care and social security to support retired baby boomers; but face less job competition Better health may --> later retirement of baby boomers --> keep high-salary jobs

49
Tracking the baby-boom generation in the United States
![]()
50
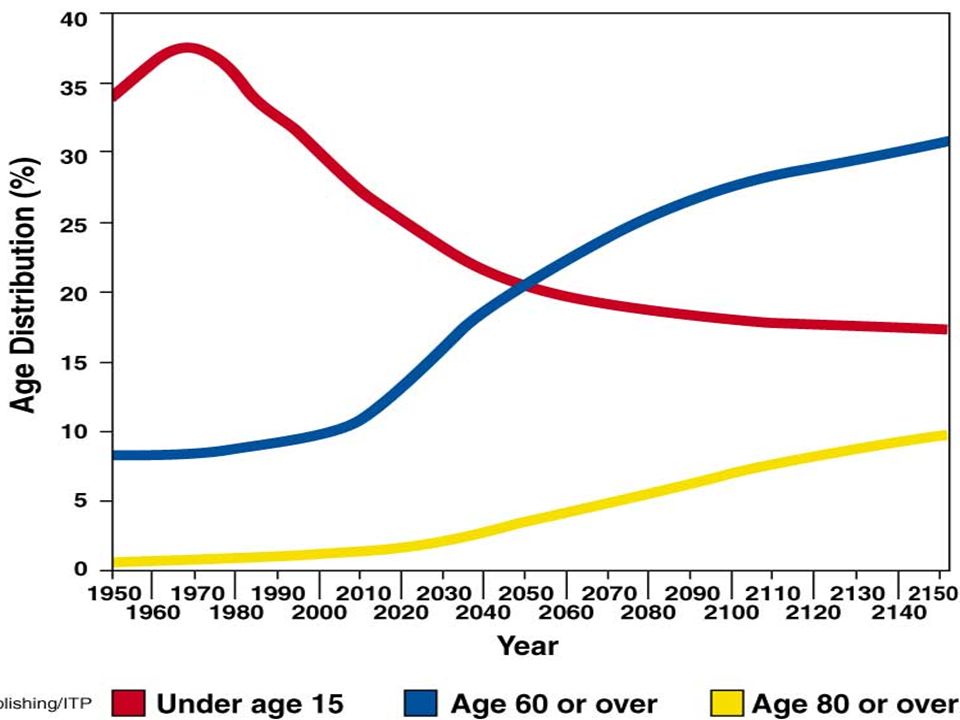
Populations Made Up of Mostly Older People Can Decline Rapidly
Slow decline Manageable Rapid decline Severe economic problems Severe social problems

51
Effects of Population Decline
As percentage of 60+ aged people increases, population begins decline 60+population increase --> severe economic and social problems because 60+ consume more medical care Social Security costly public services Labor shortages require automation & immigration

53
The Graying of Japan Family-planning access, cramped housing, expensive land, late marriage, education cost --> voluntary decrease in birth rate Low immigration rate Health insurance and pension - 45% of national income; could -->low economy Illegal immigration bolsters work force

54
Populations Can Decline from a Rising Death Rate: The AIDS Tragedy
25 million killed by 2008 Many young adults die: loss of most productive workers Sharp drop in life expectancy International community called upon to Reduce the spread of HIV through education and health care Financial assistance and volunteers

55
6-4 How Can We Slow Human Population Growth?
Concept 6-4 Experience indicates that the most effective ways to slow human population growth are to encourage family planning, to reduce poverty, and to elevate the status of women.

56
As Countries Develop, Their Populations Tend to Grow More Slowly
Demographic transition stages Preindustrial AKA Pre Transition Transitional AKA Early Transitional May lead to a demographic trap Industrial AKA Middle Transition Postindustrial AKA Late Transition

57
http://www. geographyalltheway
58
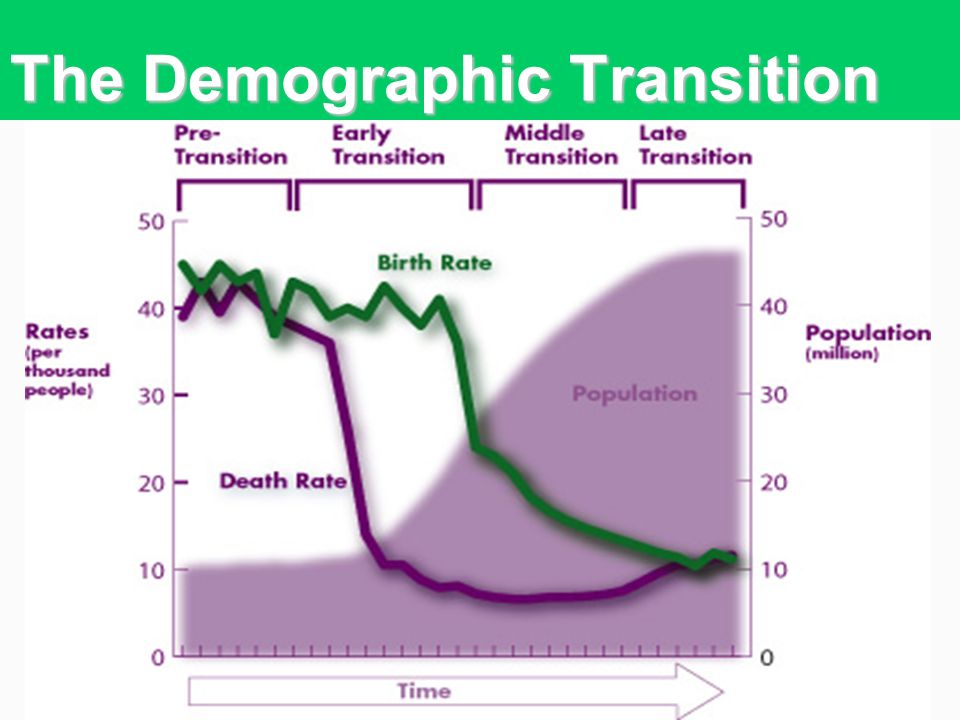
The Demographic Transition
59
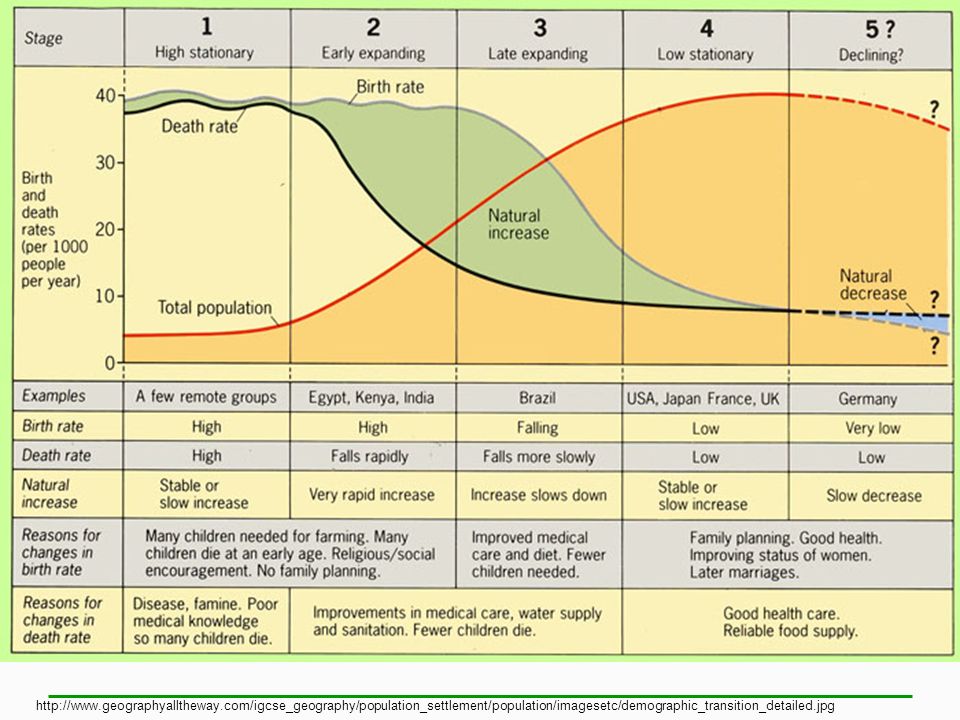
Five Stages of the Demographic Transition
Used to be 4, now 5 stages birth rates, death rates and growth rates systematically change through time as societies change: modernize, urbanize gain access to technology

60
Stage 1- Pre-transition or Pre-industrial stage
high birth rates, high (at time erratic) death rates, low growth rates stage for much of human history, traditional societies practically no country today
 death rates, low growth rates. stage for much of human history, traditional societies. practically no country today.")
61
Stage 2- Early Transition or Transitional
high birth rates, declining death rates, rising growth rates improvements in sanitation (water) and medicine in Europe during Industrial Revolution in developing countries since the 50s/60s much of Africa today, some countries of Asia (Afghanistan, Nepal, etc.)
 and medicine. in Europe during Industrial Revolution. in developing countries since the 50s/60s. much of Africa today, some countries of Asia (Afghanistan, Nepal, etc.)")
62
Stage 3- Middle Transition or Industrial stage
continued decline of death rates, declining birth rates, growth rates decline from high to lower levels change in behavior: adaptation to lower death rate, in particular infant mortality rate economic change: urbanization (incentive to have fewer children) Mexico today
 Mexico today.")
63
Stage 4- Late Transition or Postindustrial stage
Stage 4: low birth rates, low death rates, low growth rates United States today Stage 5: low birth rates, rising death rates, declining growth rates (if birth rates drop below death rates: negative growth rates) several countries of Europe today (Austria) Stage 5-
 several countries of Europe today (Austria) Stage 5-")
64
Link to Population Pyramids?

65
Planning for Babies Works
Family Planning Responsible for a 55% drop in TFRs In developing countries Expansion of program Include teenagers, sexually active unmarried women, and men Slow and stabilize population growth Invest in family planning Reduce poverty Elevate the social and economic status of women

66
What Is Family Planning?
Definition Measures enabling parents to control number of children (if they so desire) Goals of Family Planning Not to limit births For couples to have healthy children For couples to be able to care for their children For couples to have the number of children that they want
 Goals of Family Planning. Not to limit births. For couples to have healthy children. For couples to be able to care for their children. For couples to have the number of children that they want.")
68
What Methods are Used to Control Births?
Preconception Birth Control Methods Barrier Methods Condom Vaginal sponge Diaphragm Spermicides Hormonal Contraceptives Pill Injections and implants Sterilization Postconception Birth Control Measures Intrauterine Device RU-486 Pill Abortion

69
Typical effectiveness rates of birth control methods in the U.S.
Extremely Effective Total abstinence 100% Sterilization 99.6% Vaginal ring 98-99% Highly Effective IUD with slow-release hormones 98% IUD plus spermicide 98% Vaginal pouch (“female condom”) 97% IUD 95% Condom (good brand) plus spermicide 95% Oral contraceptive 93%
 97% IUD. 95% Condom (good brand) plus spermicide. 95% Oral contraceptive. 93%")
70
Typical effectiveness rates of birth control methods in the U.S.
Cervical cap 89% Condom (good brand) 86% Diaphragm plus spermicide 84% Rhythm method (Billings, Sympto-Thermal) 84% Vaginal sponge impreg- nated with spermicide 83% Spermicide (foam) 82%
 86% Diaphragm plus. spermicide. 84% Rhythm method (Billings, Sympto-Thermal) 84% Vaginal sponge impreg- nated with spermicide. 83% Spermicide (foam) 82%")
71
Typical effectiveness rates of birth control methods in the U.S.
Moderately Effective Spermicide (creams, jellies, suppositories) Rhythm method (daily temperature readings) 75% 74% Withdrawal 74% Condom (cheap brand) 70% Unreliable Douche 40% Chance (no method) 10%
 Rhythm method (daily. temperature readings) 75% 74% Withdrawal. 74% Condom (cheap brand) 70% Unreliable. Douche. 40% Chance (no method) 10%")
72
Contraceptive Use Worldwide
People in industrialized countries enjoy easy access to contraceptives while those in LDCs do not. In the U.S., teens and poor women are least likely to use contraceptives. Severe problems are associated with teen pregnancy. Teens don’t receive the care they need. More adolescent girls die from pregnancy-related causes than any other cause. Maternal mortality is twice as high for women younger than 20, and 4 times as high for women younger than 17. Each year about 15 million young women ages have babies. Survival rate for babies born to teens is low. Young age of mother can cause problems with the child. Teen pregnancy causes greater public expenditures.

73
Empowering Women Can Slow Population Growth
Education Paying jobs Human rights without suppression “For poor women the only holiday is when you are asleep”

74
Empowering women to reduce births
Women tend to have fewer, and healthier children when: they have access to education and paying jobs outside home their society doesn’t suppress women’s rights But women do most of the work not shown in GDP because of lower pay Women excluded from economic and political decision making

75
Typical workday for a women in Rural Africa
4:45 A.M. Wake, wash, and eat 5:00 A.M.- 5:30 A.M. Walk to fields 5:30 A.M.- 3:00 P.M. Work in fields 3:00 P.M.- 4:00 P.M. Collect firewood 4:00 P.M.- 5:30 P.M. Pound and grind corn 5:30 P.M.- 6:30 P.M. Collect water 6:30 P.M.- 8:30 P.M. Cook for family and eat 8:30 P.M.- 9:30 P.M. Wash dishes and children 9:30 P.M. Go to bed

76
Case Study: Slowing Population Growth in China: the One-Child Policy
Encourages fewer children Gender imbalance Fast-growing economy Face serious resource and environmental problems

77
Case Studies - China Family planning efforts began in 1970; TFR fell from 5.7 to 1.8; infant mortality and illiteracy rates 1/3 to 1/2 of India’s rates Population control program is extensive, intrusive and strict: postpone childbearing only one child/family -->benefits effect b/c China is dictatorship; limited resources would have meant disaster

78
China’s Program Nation With Best Known Population Control Program Reasons Chinese Government Initiated Population Control Measures Freshwater and food at a premium for nation’s population Country experiencing population momentum Government Perks / Coercive Measures for Citizen Compliance Free education and health care Increased personal and family incomes Increased legal marrying age for women Contraceptives, abortions, and sterilizations free of charge Preferential housing and retirement income

79
Case Study: Slowing Population Growth in India
Population control: gender bias Poverty Malnutrition Environmental problems

80
Case Studies - India Family planning efforts began in 1952; fertility rate declined from 5.3 to 3.4 but population grow is still exponential -1.9% Disappointing results due to: poor planning bureaucratic inefficiency low status of women extreme poverty lack of administrative & financial support

Similar presentations


 Estimated 2.4 billion more people by 2050 Are there.>")
 G. Tyler Miller’s.>")


 Population size (N) -ideal habitat -maximum reproduction -unlimited resources Increase often.>")


