Download presentation
Presentation is loading. Please wait.

1
Subsurface Mapping Introduction

2
Introduction Objectives of subsurface mapping Methods Before you start

3
Objectives Most of the Earth’s structure and stratigraphy are hidden
Structure/stratigraphy may host features of economic or academic importance Need to be able to map/interpret the subsurface

4
Objectives Petroleum industry Mining Groundwater
Explore for and develop oil and natural gas reserves Mining Explore for and develop minerals and other economic deposits Groundwater Explore for and develop groundwater

5
Objectives Waste disposal Geotechnical engineering Academic studies
Find suitable repositories for waste Environmental remediation Geotechnical engineering Locate and map the distribution of layers with specific properties Academic studies Structure, stratigraphy Etc.

6
Objectives This course: focus on petroleum Why?
Methods applicable to other fields Best datasets

7
Objectives Develop the most reasonable subsurface interpretation(s) for the area being studied, even in areas where the data are sparse or absent Integration of different types of data Interpretations used to direct future exploration & development

8
Methods Wireline logs Core, cuttings (“samples”)
Seismic data (2-D, 3-D) Potential field data (gravity, aeromag) Ground-penetrating radar Engineering data (fluids, pressures, etc.) Previous reports Etc.
 Potential field data (gravity, aeromag) Ground-penetrating radar. Engineering data (fluids, pressures, etc.) Previous reports. Etc.")
13
Geophysical logs used in groundwater studies

14
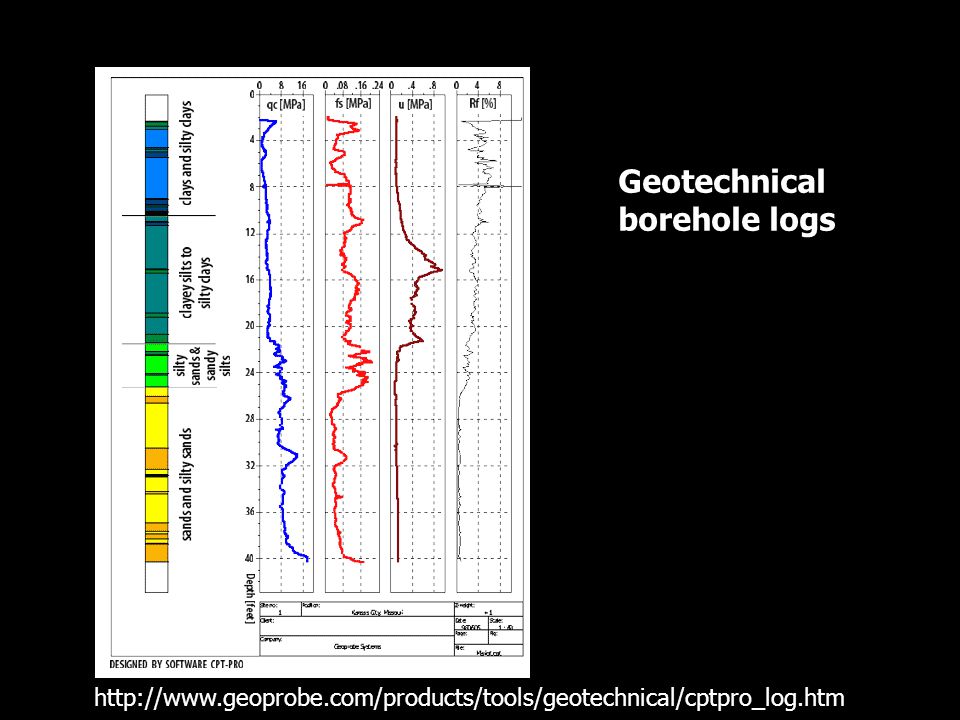
Geotechnical borehole logs
17
Tail buoy Streamer Air Guns Marine seismic vessels typically tow arrays of air guns and streamers containing hydrophones a few meters below the surface of the water.

18
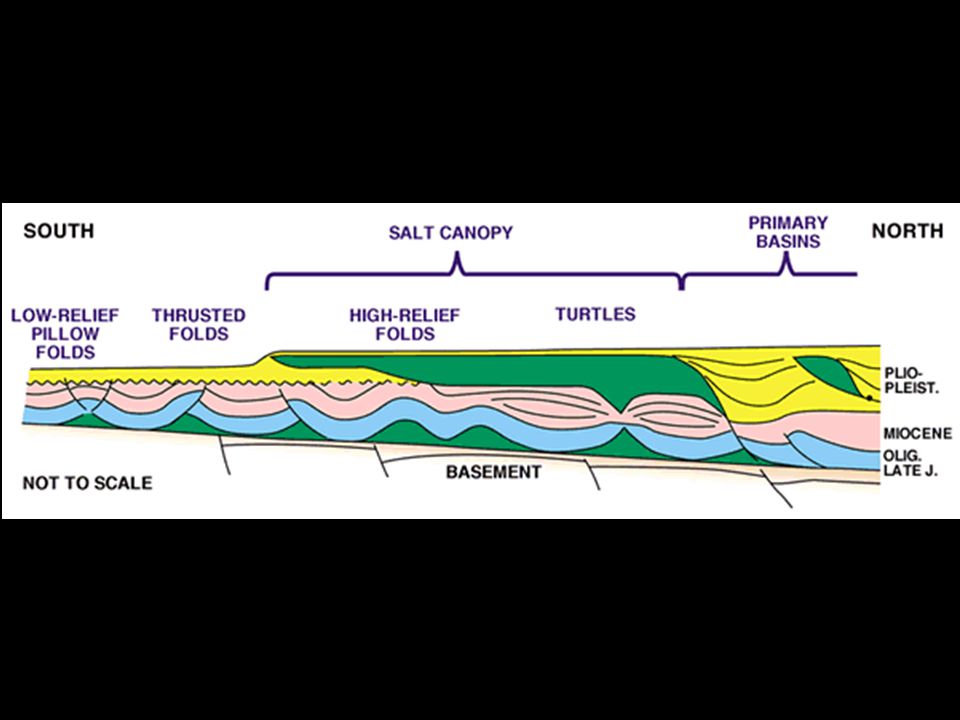
Messinian Salt – Mediterranean Sea
Courtesy TGS-Nopec

19
Vibroseis Operations - Algeria
Courtesy François Gauthier

20
Mapping Faults Using Dip Panels in Thrust Regimes
Waiting on 84wy314 * Dip panels are areas of continuous, (near) parallel dip * 'Smooth' changes in dip usually indicate axial planes * Discordant dip panels show fault locations * No data areas are usaully POORLY IMAGED steep dips, not faults Courtesy Anadarko
 parallel dip. * Smooth changes in dip usually indicate axial planes. * Discordant dip panels show fault locations. * No data areas are usaully POORLY IMAGED steep dips, not faults. Courtesy Anadarko.")
21
Slicing and Dicing to Extract Geologic Information
Seismic Cube Timeslices

22
Methods Previous reports Paper copies of data (analog)
Digital data: computer-based interpretations

25
Methods Caveat: Without understanding what you’re doing, you’ll get a wrong answer. Working with computers, you’ll get a wrong answer at light speed (but it may be good-looking!).
.")
26
Methods Interpretations (maps, etc.) are working hypotheses, never “final” May need to update, revise as new data become available Easier with digital data Applies to ANY branch of (Earth) Science!!!
 Science!!!")
27
Collect Data Collect Data Interpret Data Interpret Data Drill Drill

29
Before you start… Need clear definition of objectives
Structure? Stratigraphy? Exploration? Development? Etc. Without knowing where you’re going, you’re unlikely to get there…

30
Before you start… Need good understanding of structural geology, stratigraphy and other related fields The more geology one knows, the more reasonable the resulting interpretation Need good understanding of physical basis for any geophysical methods being used

32
Prestack Depth Migration Example
Subsalt – Offshore GOM

34
Before you start… Use correct mapping techniques and methods
Prepare reasonable subsurface maps and cross-sections “Maps and cross-sections are the primary vehicles used to organize, interpret and present available subsurface information” Digital products (e.g., volumes) becoming more common
 becoming more common.")
37
Geocellular model: Each cube is assigned initial properties (porosity, permeability, fluid saturation etc.)
")
38
3D display of georeferenced scanned images of collar locations, geological cross-sections, integrated with drillholes displaying assay concentrations, and magnetic and gravity modeled bodies.

39
Before you start… Need to define fault behaviour in 3-D
Faults may have important affects on location, movement of fluids Show location of faults on maps, but also map fault surfaces May need to do structural reconstruction to validate accuracy of fault interpretations

40
A 2-D expression of a fault

41
Faults are 3-D features Twiss and Moores, 1992

42
Fault visualization (Hart et al., 2001)
")
43
Fault visualization (Sagan and Hart, in press)
")
44
Courtesy Midland Valley

45
Before you start… All subsurface data need to be used to develop a reasonable and accurate subsurface interpretation Geologic (including paleontologic), geophysical, engineering Attention to resolution, accuracy of each type Integration of different types of data results in more robust interpretation
, geophysical, engineering. Attention to resolution, accuracy of each type. Integration of different types of data results in more robust interpretation.")
46
Before you start… Need to document the work done.
Lots of data likely to be collected and/or generated – document in a format that may be referenced, used, revised People working on project may change, may want to “revisit” work many years after it is done Electronic media (PowerPoint files, hypertext documents, etc.) good vehicles – especially when working with digital data
 good vehicles – especially when working with digital data.")
47
Really great stuff Fred, but how did you generate it?
Ummm…. Really great stuff Fred, but how did you generate it?

48
Summary Subsurface mapping of important economic & fundamental importance Push towards digital, computer-based interpretation Need to understand fundamentals – geology, geophysics Integration of different types of data results in more robust interpretation

Similar presentations


>")


