Download presentation
Presentation is loading. Please wait.

1
Susan Gendron Senior Fellow June 14, 2012
Transitioning to the Common Core State Standards and Next Generation Assessments Yakima, WA Susan Gendron Senior Fellow June 14, 2012

2
Common Core State Standards
Define the knowledge and skills students need for college and career Developed voluntarily and cooperatively by states; 46 states and DC have adopted Provide clear, consistent standards in English language arts/Literacy and mathematics Source:

3
WHY?

4
PISA 2009 Overall Reading Scale 1 Shanghai-China 556 2 Korea 539 3
Finland 536 4 Hong Kong-China 533 5 Singapore 526 6 Canada 524 7 New Zealand 521 8 Japan 520 9 Australia 515 10 Netherlands 508 17 United States 500 20 Germany 497 21 Ireland 496 22 France 25 United Kingdom 494 33 Spain 481 43 Russian Federation 459 48 Mexico 425 53 Brazil 412 57 Indonesia 402 PISA 2009 Overall Reading Scale Significantly Above OECD Average Not Significantly Different (OECD Average 493) Significantly below OECD Average
 Significantly below OECD Average.")
5
PISA 2009 Overall Math Scale 25th last time 1 Shanghai-China 600 2
Singapore 562 3 Hong Kong-China 555 4 Korea 546 6 Finland 541 9 Japan 529 10 Canada 527 11 Netherlands 526 13 New Zealand 519 15 Australia 514 16 Germany 513 22 France 497 28 United Kingdom 492 31 United States 487 32 Ireland 34 Spain 483 38 Russian Federation 468 51 Mexico 419 57 Brazil 386 61 Indonesia 371 PISA 2009 Overall Math Scale Significantly Above OECD Average Not Significantly Different (OECD Average 496) Significantly below OECD Average 25th last time
 Significantly below OECD Average. 25th last time.")
6
PISA 2009 Overall Science Scale Last time 21 1 Shanghai-China 575 2
Finland 554 3 Hong Kong-China 549 4 Singapore 542 5 Japan 539 6 Korea 538 7 New Zealand 532 8 Canada 529 10 Australia 527 11 Netherlands 522 13 Germany 520 16 United Kingdom 514 20 Ireland 508 23 United States 502 27 France 498 36 Spain 488 39 Russian Federation 478 50 Mexico 416 53 Brazil 405 60 Indonesia 383 PISA 2009 Overall Science Scale Significantly Above OECD Average Not Significantly Different (OECD Average 501) Significantly below OECD Average Last time 21
 Significantly below OECD Average. Last time 21.")
7
Mapping State Proficiency Standards onto NAEP Scales, IES August 2011
Reading Risk WA Mapping State Proficiency Standards onto NAEP Scales, IES August 2011

8
Proficiency Grade 4 Reading 2009
Proficient Required NAEP Score California 60 % 202 Massachusetts 54 % 234 Missouri 47 % 229 New Hampshire 74% 211 Oregon 84 % 177 Washington 73 % 205 Vermont 70% 214 2nd in the eGrade 4 from Proficient

9
Mapping State Proficiency Standards onto NAEP Scales, IES August 2011
Reading Risk WA Mapping State Proficiency Standards onto NAEP Scales, IES August 2011

10
Proficiency Grade 8 Reading 2009
Proficient Required NAEP Score California 48% 259 Minnesota 67% Missouri 50% 267 Vermont 69% Oregon 250 Washington 68% 253 Missouri number one

11
Mapping State Proficiency Standards onto NAEP Scales, IES August 2011
Math Risk WA Mapping State Proficiency Standards onto NAEP Scales, IES August 2011

12
Proficiency Grade 4 Mathematics 2009
Proficient Required NAEP Score California 65 % 220 Massachusetts 48 % 255 Hawaii 50 % 239 New Hampshire 73 % 237 New Mexico 77 % 224 Washington 52 % 243 Missouri 45 % 246 Second in the country

13
Math Risk WA Mapping State Proficiency Standards onto NAEP Scales, IES August 2011

14
Proficiency Grade 8 Mathematics 2009
Proficient Required NAEP Score California 41 % 270 Massachusetts 49 % 300 Missouri 47 % 287 Hawaii 39% 286 Minnesota 58 % Oregon 71 % 266 Washington 53 % Third in the country

15
Partner Discussion What are your risks?
How will you prepare your school for a potential dip in scores?

17
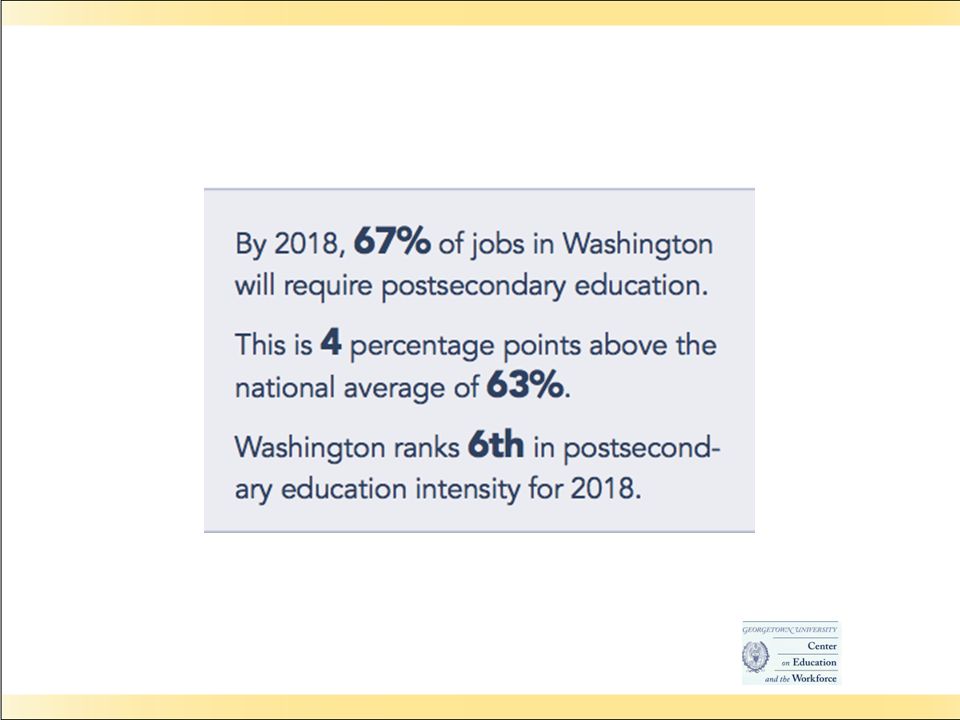
Post-Secondary Jobs

20
FOUR KEYS TO COLLEGE AND CAREER READINESS
Key Cognitive Strategies Problem formulation Hypothesize Strategize Research Identify Collect Interpretation Analyze Evaluate Communication Organize Construct Precision & accuracy Monitor Confirm Key Content Knowledge Structure of knowledge Key terms and terminology Factual information Linking ideas Organizing concepts Challenge level Value Attribution Effort Key Learning Skills & Techniques Ownership of learning Goal setting Persistence Self-awareness Motivation Help seeking Progress monitoring Self-efficacy Learning techniques Time management Test taking skills Note taking skills Memorization/recall Strategic reading Collaborative learning Technology proficiency Key Transition Knowledge & Skills Postsecondary awareness Aspirations Norms/culture Postsecondary costs Tuition Financial aid Matriculation Eligibility Admissions Program Career awareness Requirements Readiness Role and identity Role models Self-advocacy Resource acquisition Institutional advocacy © 2011 David T Conley

21
Common Core Research 1900 entry level courses Instructor ratings
25 areas, 14 general education, Reviewed syllabi, assignments and exams

22
Key Findings CCSS applicable to success in a wide range of courses
Challenge level is sufficient Coherent representation of knowledge necessary Core of knowledge is common across general education and career courses Career areas tend to have knowledge profiles that differ from general education

23
Lexile Framework® for Reading Study Summary of Text Lexile Measures
Interquartile Ranges Shown (25% - 75%) 1600 1400 1200 Text Lexile Measure (L) 1000 800 600 Personal Use Entry-Level Occupa-tions High School Lit. College Lit. High School Texts College Texts Military SAT 1, ACT, AP* * Source of National Test Data: MetaMetrics
 Text Lexile Measure (L) Personal. Use. Entry-Level. Occupa-tions. High. School. Lit. College. Lit. High. School. Texts. College. Texts. Military. SAT 1, ACT, AP* * Source of National Test Data: MetaMetrics.")
24
Content Reading and Writing Strategies that Work for All Students
MetaMetrics Survey 2000 Arkansas Democrat Gazette 1230 L Associated Press 1310 L LA Times 1330 L Miami Herald 1200 L New York Post 1280 L Oakland Tribune 1210 L Raleigh News & Observer 1220 L Wall Street Journal 1320 L USA Today Kuzmich, 2006

25
On-the Job Lexile Requirements
National Adult Literacy Study 1992 1,500 1,400 1,300 1,200 1,100 1,000 900 800 International Center for Leadership in Education 2009 Construction Craftsman Nurse Sales Secretary

26
Key to Effective Instruction Is Alignment
Organizational Leadership Instructional Leadership Teaching

27
Instructional Leadership Organizational Leadership
Teaching Student Achievement Instructional Leadership Organizational Leadership

29
Organizational Leadership
Student Achievement Organizational Leadership

30
Organizational Leadership
Culture Culture

31
Levin and Elmore Everyone needs to collaborate to ensure that daily teaching and learning practices are the focus of the school All responsible for success Principals and teachers are fundamentally evaluators Leaders responsible for cultural changes – by displacing specific norms, structures, and processes by others

32
Does your culture do this?
Collaboratively build teams Team works to solve dilemmas in learning Collectively share and critique the nature and quality of evidence that shows our impact on student learning Cooperate in planning and critiquing lessons, learning intentions, and success criteria Hattie, John Visible Learning for Teachers

33
Organizational Leadership
Vision Vision Culture

34
Common Core State Standards
All students graduate college and career ready All students are prepared for all entry-level, credit-bearing, academic college courses in English, mathematics, the sciences, the social sciences, and the humanities. All students enter these classes ready for success (defined for these purposes as a C or better). All American students are prepared for the global economic workplace.
. All American students are prepared for the global economic workplace.")
35
Discussion How will you create a culture in your schools of ALL students “college and career ready”?

36
Teaching Rigor and Relevance Rigor and Relevance

38
Rigor/Relevance Framework®
Bloom’s Evaluation Synthesis Analysis Application Comprehension Knowledge (NOUNS) Revised Bloom’s Applying Creating Evaluating Analyzing Understanding Remembering (VERBS)
 Revised Bloom’s. Applying. Creating. Evaluating. Analyzing. Understanding. Remembering. (VERBS)")
39
LITERACY IN HISTORY/SOCIAL STUDIES, SCIENCE, AND TECHNICAL SUBJECTS
STANDARDS FOR ENGLISH LANGUAGE ARTS & LITERACY IN HISTORY/SOCIAL STUDIES, SCIENCE, AND TECHNICAL SUBJECTS JUNE 2010 39

41
Design and Organization
Three appendices: A: Research and evidence; glossary of key terms B: Reading text exemplars; sample performance tasks C: Annotated student writing samples

42
Shared Responsibility for Students’ Literacy Development
“The Standards insist that instruction in reading, speaking, listening, and language be a shared responsibility within the school” (p. 4). “This division reflects the unique time-honored place of ELA teachers in developing students’ literacy skills while at the same time recognizing that teachers in other areas must have a role in this development as well” (p. 4). Adapted from “Key Design Considerations” (page 4 of the Standards)
. This division reflects the unique time-honored place of ELA teachers in developing students’ literacy skills while at the same time recognizing that teachers in other areas must have a role in this development as well (p. 4). Adapted from Key Design Considerations (page 4 of the Standards)")
43
English Language Arts and Literacy Standards “Roadmap”
READING WRITING SPEAKING & LISTENING LANGUAGE 10 Anchor Standards for College and Career Readiness 10 Anchor Standards for College and Career Readiness 6 Anchor Standards for CCR 6 Anchor Standards for CCR ELA Standards K-12 Literacy Standards 6-12 Found-ational Skills ELA Standards K-12 Literacy Standards 6-12 ELA Standards K-12 ELA Standards K-12 1 2 3 4 5 Literary Text Inform Text Hist. / S.S. Sci. / Tech Subj. K 1 K 2 3 4 5 6 7 8 9-10 11-12 1 K 2 3 4 5 6 7 8 9-10 → → → → → → K K K → → → → → → → → → → → 1 2 3 4 5 1 → → → → → → → → → → → → → → → → → 1 → → → → → → → → → → → → → → → → → 2 2 → → → → → → → → → → → → → → → → → 3 3 → → → → → → 4 4 → → → → → → → → → → → → → → → → → 5 5 → → → → → → → → → → → 6 6 9-10 11-12 6 7 9-10 11-12 6-8 6-8 7 9-10 11-12 6-8 7 8 8 8 9-10 9-10 9-10 11-12 11-12 11-12 11-12

44
Increasing Sophistication
Reading Anchor Standard #9 Integration of Knowledge and Ideas Analyze how two or more texts address similar themes or topics in order to build knowledge or to compare the approaches the authors take. Kindergarten Grades 11-CCR Integration of Knowledge and Ideas 9. Compare and contrast the most important points and key details presented in two texts on the same topic. Integration of Knowledge and Ideas 9. Integrate information from diverse sources, both primary and secondary, into a coherent understanding of an idea or event, noting discrepancies among sources.

45
English Language Arts and Literary Shifts
Engageny.org

46
Balancing Literature and Informational Text
Shift 1 Balancing Literature and Informational Text

47
Literary/Informational Text
Literature Informational Text Stories Drama Poetry Literary Nonfiction and Historical, Scientific, and Technical Texts Includes children’s adventure stories, folktales, legends, fables, fantasy, realistic fiction, and myth Includes staged dialogue and brief familiar scenes Includes nursery rhymes and the subgenres of the narrative poem, limerick, and free verse poem Includes biographies and autobiographies; books about history, social studies, science, and the arts; technical texts, including directions, forms, and information displayed in graphs, charts, or maps; and digital sources on a range of topics

48
Reading Framework for NAEP 2009
Grade Literary Informational 4 50% 8 45% 55% 12 30% 70% Standards demand a greater focus on informational text literary non fiction Major focus in 6-12

49
Reading College and Career Readiness Anchor Standards
Key Ideas and Details 1. Read closely to determine what the text says explicitly and to make logical inferences from it; cite specific textual evidence when writing or speaking to support conclusions drawn from the text. 2. Determine central ideas or themes of a text and analyze their development; summarize the key supporting details and ideas. 3. Analyze how and why individuals, events, and ideas develop and interact over the course of a text.

50
Reading College and Career Readiness Anchor Standards
Craft and Structure 4. Interpret words and phrases as they are used in a text, including determining technical, connotative, and figurative meanings, and analyze how specific word choices shape meaning or tone. 5. Analyze the structure of texts, including how specific sentences, paragraphs, and larger portions of the text (e.g., a section, chapter, scene, or stanza) relate to each other and the whole. 6. Assess how point of view or purpose shapes the content and style of a text.
 relate to each other and the whole. 6. Assess how point of view or purpose shapes the content and style of a text.")
51
Reading College and Career Readiness Anchor Standards
Integration of Knowledge and Ideas 7. Integrate and evaluate content presented in diverse media and formats, including visually and quantitatively, as well as in words. *8. Delineate and evaluate the argument and specific claims in a text, including the validity of the reasoning as well as the relevance and sufficiency of the evidence. 9. Analyze how two or more texts address similar themes or topics in order to build knowledge or to compare the approaches the authors take.

52
Building Knowledge in the Disciplines
Shift #2 Building Knowledge in the Disciplines

53
Shared Responsibility for Students’ Literacy Development
“The Standards insist that instruction in reading, speaking, listening, and language be a shared responsibility within the school” (p. 4). “This division reflects the unique time-honored place of ELA teachers in developing students’ literacy skills while at the same time recognizing that teachers in other areas must have a role in this development as well” (p. 4). Adapted from “Key Design Considerations” (page 4 of the Standards)
. This division reflects the unique time-honored place of ELA teachers in developing students’ literacy skills while at the same time recognizing that teachers in other areas must have a role in this development as well (p. 4). Adapted from Key Design Considerations (page 4 of the Standards)")
54
Why Literacy in History/Social Studies, Science and Technical?
Students are consistently unable to meet the demands of reading text within a particular discipline. Reading within a discipline is different than reading literature. The ability to read within the discipline is important to citizenship. Being literate across a broad range of disciplines is required to be considered College and Career Ready.

55
History is interpretive.
How is reading history/social studies different from other types of reading? History is interpretive. History is an argument in favor of a particular narrative. Who the author is matters. (sourcing) The author’s purpose matters. (bias and perspective) A single text is problematic. (corroboration)
 The author’s purpose matters. (bias and perspective) A single text is problematic. (corroboration)")
56
Focus is on claims and counter claims
How is reading science and technical reading different from other types of reading? Focus is on claims and counter claims Precise details, complex details and processes Analyze results by comparing Determining what question is being raised Navigate text, graphs, tables, charts Evaluate basis for claims

57
Reading College and Career Readiness Anchor Standards
Range of Reading and Level of Text Complexity 10. Read and comprehend complex literary and informational texts independently and proficiently.

58
Staircase of Text Complexity
Shift #3 Staircase of Text Complexity

59
Text complexity is defined by:
Overview of Text Complexity Reading Standards include over exemplar texts (stories and literature, poetry, and informational texts) that illustrate appropriate level of complexity by grade Text complexity is defined by: Qualitative Qualitative measures – levels of meaning, structure, language conventionality and clarity, and knowledge demands Quantitative Quantitative measures – readability and other scores of text complexity Best measured by an attentive reader Ability to make an informed decision about the difficulty of a text Knowledge of four factors in developing effective tools: Levels of Meaning or Purpose Reader and Task: Determining whether a given text is appropriate for the student: Cognitive abilities Motivation Topic knowledge Linguistic and discourse knowledge Comprehension strategies Experiences “Reading for Understanding, 2002, The RAND Reading Study group” Quantitative: Word length or frequency (Flesch-Kincaid Grade Level text, Dale-Chall Readability Formula, Lexile) Sentence length Text cohesion (University of Memphis, Coh-Metrix) Measurement tools ( Lexile example Structure Language Conventionality & Clarity Knowledge Demands Reader and Task Reader and Task – background knowledge of reader, motivation, interests, and complexity generated by tasks assigned
 that illustrate appropriate level of complexity by grade. Text complexity is defined by: Qualitative. Qualitative measures – levels of meaning, structure, language conventionality and clarity, and knowledge demands. Quantitative. Quantitative measures – readability and other scores of text complexity. Best measured by an attentive reader. Ability to make an informed decision about the difficulty of a text. Knowledge of four factors in developing effective tools: Levels of Meaning or Purpose. Reader and Task: Determining whether a given text is appropriate for the student: Cognitive abilities. Motivation. Topic knowledge. Linguistic and discourse knowledge. Comprehension strategies. Experiences. Reading for Understanding, 2002, The RAND Reading Study group Quantitative: Word length or frequency (Flesch-Kincaid Grade Level text, Dale-Chall Readability Formula, Lexile) Sentence length. Text cohesion (University of Memphis, Coh-Metrix) Measurement tools ( Lexile example. Structure. Language Conventionality & Clarity. Knowledge Demands. Reader and Task. Reader and Task – background knowledge of reader, motivation, interests, and complexity generated by tasks assigned.")
60
Step 1: Qualitative Measures
Measures such as: Levels of meaning Levels of purpose Structure Organization Language conventionality Language clarity Prior knowledge demands

61
Step 2: Quantitative Measures
Measures such as: Word length Word frequency Word difficulty Sentence length Text length Text cohesion

62
Text Complexity Grade Bands and Associated Lexile Ranges
Text Complexity Grade Band in the Standards Old Lexile Ranges Lexile Ranges Aligned to CCR expectations K-1 N/A 2-3 4-5 6-8 9-10 11-CCR Metametrics has realigned its Lexile ranges to match the Standards’ text complexity grade bands and has adjusted upward its trajectory of reading comprehension development through the grades

63
Step 3: Reader and Task Considerations such as: Motivation
Knowledge and experience Purpose for reading Complexity of task assigned regarding text Complexity of questions asked regarding text

64
Shift #5 Writing from Sources

65
College and Career Readiness Anchor Writing Standards
Text Types and Purposes Write arguments to support claims in an analysis of substantive topics or texts, using valid reasoning and relevant and sufficient evidence. Write informative/explanatory texts to examine and convey complex ideas and information clearly and accurately through the effective selection, organization, and analysis of content. Write narratives to develop real or imagined experiences or events using effective techniques, well-chosen details, and well-structured event sequences.

66
NAEP 2011 Writing Framework
Grade To Persuade To Explain To Convey Experience 4 30% 35% 8 12 40% 20%

67
College and Career Readiness Anchor Writing Standards
Production and Distribution of Writing Produce clear and coherent writing in which the development, organization, and style are appropriate to task, purpose, and audience. Develop and strengthen writing as needed by planning, revising, editing, rewriting, or trying a new approach. Use technology, including the Internet, to produce and publish writing and to interact and collaborate with others.

68
Grade 4 argumant

69
Grade 8 Informative/Explanatory
69

70
College and Career Readiness Anchor Writing Standards
Research to Build and Present Knowledge Conduct short, as well as more sustained research projects based on questions, demonstrating understanding of the subject under investigation. Gather relevant information from multiple print and digital sources, assess the credibility and accuracy of each source, and integrate the information while avoiding plagiarism. Draw evidence from literary or informational texts to support analysis, reflection, and research.

71
College and Career Readiness Writing Standards
Range of Writing Write routinely over extended time frames (time for research, reflection, and revision) and shorter time frames (a single sitting or a day or two) for a range of tasks, purposes, and audiences.
 and shorter time frames (a single sitting or a day or two) for a range of tasks, purposes, and audiences.")
72
Writing and Research the Analyzes and Deploys Evidence
Draw evidence from texts to support and develop: Analysis Reflection Research Increase opportunities to write in response to sources Extensive practice with short, focused research projects “typically taking a week and occurring—at a minimum—quarterly” Increase focus on argumentation and informative writing, less narrative writing

73
Shift #4 Text Based Answers

74
High-quality, Text-dependent Questions & Tasks
“Among the highest priorities of the Common Core Standards is that students can read closely and gain knowledge from texts.” “More questions that can be answered only with reference to the text.” “Sequences of questions should elicit a sustained discussion.” Tasks must “require the use of more textual evidence.”

75
College and Career Readiness Anchor Standards for Speaking and Listening
Comprehension and Collaboration 1. Range of conversations and collaborations, diverse partners, building on others’ ideas and expressing their own clearly and persuasively. 2. Integrate and evaluate information presented in diverse media and formats, including visually, quantitatively, and orally. 3. Evaluate a speaker’s point of view, reasoning, and use of evidence and rhetoric.

76
College and Career Readiness Anchor Standards for Speaking and Listening
Presentation of Knowledge and Ideas 4. Present information, findings, and supporting evidence such that listeners can follow the line of reasoning and the organization, development, and style are appropriate to task, purpose, and audience. 5. Make strategic use of digital media and visual displays of data to express information and enhance understanding of presentations. 6. Adapt speech to a variety of contexts and communicative tasks, demonstrating command of formal English when indicated or appropriate.

77
College and Career Readiness Anchor Standards for Language
Conventions of Standard English When writing or speaking. Use capitalization, punctuation, and spelling when writing. Knowledge of Language To comprehend more fully when reading or listening. Vocabulary Acquisition and Use 4. Determine or clarify the meaning of unknown and multiple-meaning words and phrases by using context clues, analyzing meaningful word parts, 5. Demonstrate understanding of figurative language, word relationships, and nuances in word meanings 6. Acquire and use accurately a range of general academic and domain-specific words

78
Shift #6 Academic Vocabulary

79
Language Progressive Skills
Tier I - words of everyday speech Tier II - general academic words, typically found in text, ways to communicate simple ideas Tier III - domain-specific words (informational text) Handout to be used with language section
 Handout to be used with language section.")
80
Reading critical to building knowledge
Reading Standards for Literacy in History/Social Studies, Science and Technical Subjects 6-12 Reading critical to building knowledge Appreciation for the norms and conventions Evidence Understanding of domain specific words Analyze, evaluate intricate argument, synthesize Complement the disciplines

81
Teaching Channel http://www. teachingchannel

82
Resources http://www.achievethecore.org http://commoncore.org/maps

83
STANDARDS FOR MATHEMATICS JUNE 2010
83 83
84
Top Achieving Countries
Topic Placement in Top Achieving Countries Topics (32) that at least 2/3 of the top achieving countries include in their ‘core’ curriculum. Grades 1-8.
 that at least 2/3 of the top achieving countries include in their ‘core’ curriculum. Grades 1-8.")
85
Topic Placement in the U.S.
Composite math standards from 21 states with topics covered by 2/3 of the states Structure of increasing complexity not seen. Topics are taught repeatedly throughout the grades. Many more topics at each grade level means topics receive less depth. Early introduction of many demanding topics (transformational geometry, measurement error, functions) . Empty rows reflect non-consensus of when to teach a topic, such as properties of common and decimal fractions. Seems to be more of a laundry list approach. Not reflecting the structure of mathematics complexity which requires pre-requisite knowledge
 . Empty rows reflect non-consensus of when to teach a topic, such as properties of common and decimal fractions. Seems to be more of a laundry list approach. Not reflecting the structure of mathematics complexity which requires pre-requisite knowledge.")
86
K-8 Domain Progressions in CCSS
Domains K 1 2 3 4 5 6 7 8 Counting and Cardinality Operations and Algebraic Thinking Number and Operations in Base Ten Number and Operations - Fractions Ratios and Proportional Relationships The Number System Expressions and Equations Functions Measurement and Data Geometry Statistics and Probability Following the National Math Panel recommendations, the new standards provide a strong foundation for Algebra by focusing on a strong foundation of number, operations, and fractions in the early grades and bringing in proportionality, probability and statistics in middle school. Many districts in the past, have provided the option for students who are ready to take Algebra I in the 8th grade. This may have been a reaction to the repetition that was seen in the grades 6-8 standards in the past. That repetition was not unique to Massachusetts, and was addressed by the Common Core Standards writers. As a result, the new grade 6-8 standards include more in-depth study of ratio, proportion, and statistics and probability. Many of the topics that commonly were thought of as part of an Algebra I course, such as introducing functions, are now a critical area for grade 8.

87
Engageny.org

88
Focus – Shift # 1 Key ideas, understandings, and skills are identified
Deep learning of concepts is stressed That is, time is spent on a topic and on learning it well. This counters the “mile wide, inch deep” criticism leveled at most current U.S. standards.

89
Critical Areas – similar to NCTM’s Curriculum Focal Points
Grade Level Overview Critical Areas – similar to NCTM’s Curriculum Focal Points All K-8 have critical areas – areas that should be emphasized and require more time at the given grade level. This aligns exactly with CFP

90
Coherence – Shift #2 Articulated progressions of topics and performances that are developmental and connected to other progressions Conceptual understanding and procedural skills emphasized equally NCTM states coherence also means that instruction, assessment, and curriculum are aligned

91
Format of Pre-K-8 Standards
Domain Grade Level 2.NBT (code) C l u s t e r H a d i n g Cluster Standard 2.NBT.1 (code) Click to show the headings used to categorize the standards. The broadest header is “Domain” which is the larger groups of related standards. There is a code for each grade level with an abbreviation for the domain (2.NBT) Clusters are groups of related standards under the domain. Standards define specifically what students should know and be able to do and are numbers starting with #1. The coherence of the standards at each grade level is demonstrated through the domains and clusters. The standards are grouped first by domain then by cluster. Each grade has up to 6 domains, and each domain is divided into one or more clusters. (The next slide will show the progression of domains through grade 8.) Focus Coherence Clarity Rigor
 C. l. u. s. t. e. r. H. a. d. i. n. g. Cluster. Standard. 2.NBT.1 (code) Click to show the headings used to categorize the standards. The broadest header is Domain which is the larger groups of related standards. There is a code for each grade level with an abbreviation for the domain (2.NBT) Clusters are groups of related standards under the domain. Standards define specifically what students should know and be able to do and are numbers starting with #1. The coherence of the standards at each grade level is demonstrated through the domains and clusters. The standards are grouped first by domain then by cluster. Each grade has up to 6 domains, and each domain is divided into one or more clusters. (The next slide will show the progression of domains through grade 8.) Focus. Coherence. Clarity. Rigor.")
92
Fractions, Grades 3–6 3. Develop an understanding of fractions as numbers. 4. Extend understanding of fraction equivalence and ordering. 4. Build fractions from unit fractions by applying and extending previous understandings of operations on whole numbers. 4. Understand decimal notation for fractions, and compare decimal fractions. 5. Use equivalent fractions as a strategy to add and subtract fractions. 5. Apply and extend previous understandings of multiplication and division to multiply and divide fractions. 6. Apply and extend previous understandings of multiplication and division to divide fractions by fractions.

93
Mathematics/Standards for Mathematical Practice
Make sense of problems and persevere in solving them Reason abstractly and quantitatively Construct viable arguments and critique the reasoning of others Model with mathematics Use appropriate tools strategically Attend to precision Look for and make use of structure Look for and express regularity in repeated reasoning 1.Analyze givens, constraints, relationships and goals

94
The Common Core State Standards offer the possibility of re-orienting school mathematics around a more robust conception of mathematical competence. Deborah Ball University of Michigan, Nov 2011

95
Implications for Instruction
Mathematical Practices—requires that the Content be taught through the Practices. That way, the connections are real—integrated rather than interspersed. Do activity on slide . . .

96
Viewing Mathematical Practices
Choose one lesson and watch approximately 5-7 minutes of instruction using your rubric. Have a discussion on evidence of the mathematical practice. Practice 1 Practice 2 Practice 3 Practice 4 Practice 5 Practice 6 Practice 7 Practice 8 Say, “This video is from the website, Inside Mathematics, an initiative funded by the Noyce Foundation. The website includes demonstration lessons, tools and resources to support mathematics educators, and a professional learning community to encourage reflective practice.” “The video we are going to watch is not intended to be an exemplar. Instead, it is meant to provide us with a common context so that we can discuss evidence of student proficiency of the practice standards that we are exploring. As you’re watching the video, consider the questions on the slide.”

97
Institute for Advanced Study/Park City Mathematics Institute Secondary School Teachers Program/Visualizing Functions

98
Mathematical practice rubrics
RESOURCES TO SUPPLEMENT RUBRICS IMPLEMENTING MATHEMATICAL PRACTICES

99
Shift #3 Fluency

100
Rigor -Require fluency, application, and deep understanding
Conceptual understanding – solving short conceptual problems, applying math in new situations, and speaking about their understanding Procedural skill and fluency - speed and accuracy in calculation. Application - “real world” situations

101
Reasoning Invite Exploration of important mathematical concepts
Allow students to solidify and make connections Make connections and develop coherent framework for mathematical ideas Problem formulation, problem solving and mathematical reasoning

102
Reasoning More than one solution
Development of all students’ disposition to do math

103
Mathematically proficient students
Make conjectures Build logical progressions to explore the truth of their conjectures Justify and communicate their conclusions Respond to arguments

104
Which number does not belong? Why?
Instead of asking which numbers are odd? From: Math for All: Differentiating Instruction, Grades 3-5, Dacey and Lynch

105
Procedural Fluency Knowledgeable about procedures
Know when and how to use them Skill in performing procedures flexibly, accurately, efficiently and with understanding

106
Major flow leading to Algebra
Operations and Algebraic Thinking leads to explicit work with Expressions and Equations beginning in Grade 6. Grade 6 is also when Base Ten and Fractions are merging to become The Number System. By the end of middle school, Expressions and Equations and The Number System have merged to become high school Algebra.

107
Shift #4 Deep Understanding

108
Cognitively-Guided Instruction Process
Start the study of a new concept with a rich problem or hypothesis Invite your students to engage in the problem Communicate multiple representations of solutions Questions, justify, and critique thinking Use your understanding of student thinking to guide further instruction

116
Grade 2

117
Grade 6

118
Focus in Math

119
Shift #5 Application

122
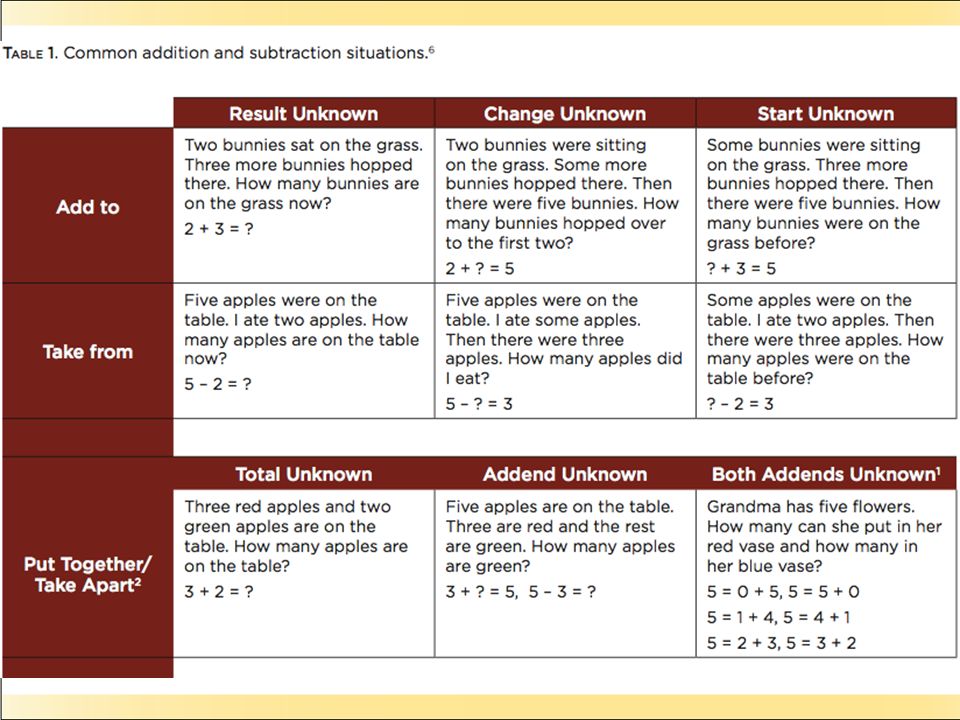
4The language in the array examples shows the easiest form of array problems. A harder form is to use the terms rows and columns: The apples in the grocery window are in 3 rows and 6 columns. How many apples are in there? Both forms are valuable. 5Area involves arrays of squares that have been pushed together so that there are no gaps or overlaps, so array problems include these especially important measurement situations.

123
Mrs. Olson’s sidewalk (SMARTER)
Ms Olsen’s Sidewalk addresses: Content Standards 7.G.6, 7.NS.3, 8.G.7 Practices P1, P5. Claims 1 and 2. In this task students are given a real-world problem whose solution involves determining the areas of two-dimensional shapes as part of calculating the cost of a sidewalk. This particular compound shape could be divided in more than one way and a choice needs to be made as to whether the shape should be considered as a rectangle and trapezoid or a longer rectangle with two smaller right-angles triangles appended near Ash Road (these can be thought of as two halves of a rectangle of width 2ft and diagonal 7.2ft). The dashed line leads towards the former. A common problem with the calculation of the areas of trapezoids is the misuse of the length marked 7.2 ft. Students will need to make use of this dimension but must avoid falling into the error of multiplying 8.5 x 7.2 in an attempt to find the area of the trapezoid. Once the decision has been made regarding how to best deconstruct the figure students will need to apply the Pythagorean Theorem in order to calculate the length of the path contained with the trapezoid. When this has been calculated the remaining length and area calculations can be undertaken. The final stage of this multi-step problem is to calculate the cost of the paving based on the basic fee of $200 plus $12 per square foot.
. The dashed line leads towards the former. A common problem with the calculation of the areas of trapezoids is the misuse of the length marked 7.2 ft. Students will need to make use of this dimension but must avoid falling into the error of multiplying 8.5 x 7.2 in an attempt to find the area of the trapezoid. Once the decision has been made regarding how to best deconstruct the figure students will need to apply the Pythagorean Theorem in order to calculate the length of the path contained with the trapezoid. When this has been calculated the remaining length and area calculations can be undertaken. The final stage of this multi-step problem is to calculate the cost of the paving based on the basic fee of $200 plus $12 per square foot.")
124
Mrs. Olson’s sidewalk Content Standards 7.G.6, 7.NS.3, 8.G.7
Make sense of problems and persevere in solving them (P1). They will need to analyze the information given and choose a solution pathway. Attend to precision (P6) in their careful use of units in the cost calculations.
. They will need to analyze the information given and choose a solution pathway. Attend to precision (P6) in their careful use of units in the cost calculations.")
125
Note: For scoring purposes, the points for each element can be weighted to reflect the importance of that element relative to the entire task. Further, “Total Points” may be treated in several ways. One approach is to use “value points”, where the total number of points is broken into segments, each accounting for a single score point. For example: if there are a total of 10 points in the rubric, but the task is determined to be valued at 3 points on the test, the rubric may allocate the 10 total points as: 0 value points = Score 0; 1-3 value points = Score 1; 4-7 value points = Score 2; 8-10 value points = Score 3. An alternate scoring scheme simply awards test points on the basis of features of the task. In the “Ms. Olsen’s Sidewalk” task above, if the task is worth 3 points on the test, all 3 points could be awarded if both the final answer for cost and the final square footage are accurate; 2 points could be for only having the square footage is accurate; 1 point for using the Pythagorean Theorem but with an error in calculations; and 0 points for not having any these.

126
Shift #6 Dual Intensity

128
A Schematic representation of CCSSM content

129
Dual Intensity Practice Understanding Application

130
HS Pathways 1) Traditional (US) – 2 Algebra, Geometry and Data, probability and statistics included in each course 2) International (integrated) three courses including number , algebra, geometry, probability and statistics each year 3) Compacted version of traditional – grade 7/8 and algebra completed by end of 8th grade 4) Compacted integrated model, allowing students to reach Calculus or other college level courses
 Traditional (US) – 2 Algebra, Geometry and Data, probability and statistics included in each course 2) International (integrated) three courses including number , algebra, geometry, probability and statistics each year 3) Compacted version of traditional – grade 7/8 and algebra completed by end of 8th grade 4) Compacted integrated model, allowing students to reach Calculus or other college level courses")
132
The second part of the pathways shows the clusters and standards as they appear in the courses. Each course contains the following components:• • •An introduction to the course and a list of the units in the course Unit titles and unit overviews (see below) Units that show the cluster titles, associated standards, and instructional notes (below)
 Units that show the cluster titles, associated standards, and instructional notes (below).")
133
As Felicia gets on the freeway to drive to her cousin's house, she notice that she is a little low on gas. There is a gas station at the exit she normally takes, and she wonders if she will have to get gas before then. She normally sets her cruise control at the speed limit of 70mph and the freeway portion of the drive takes about an hour and 15 minutes. Her car gets about 30 miles per gallon on the freeway, and gas costs $3.50 per gallon. Describe an estimate that Felicia might do in her head while driving to decide how many gallons of gas she needs to make it to the gas station at the other end. Assuming she makes it, how much does Felicia spend per mile on the freeway? Alignment 1: N-Q.1, N-Q.3

134
Teaching Channel

135
Resources PARCC Resources: http://parcconline.org
Progressions & Common Core Tools Illustrative Mathematicshttp://illustrativemathematics.org

136
Resources National Council of Supervisors of Math: Mathematics Assessment Project (MAP):

137
Item Exemplars: Performance Task
Performance Task drawn from the Ohio Performance Assessment Project.

138
Item Exemplars: Performance Task (cont’d)
Performance Task drawn from the Ohio Performance Assessment Project.

139
Item Exemplars: Performance Task (cont’d)
Performance Task drawn from the Ohio Performance Assessment Project.

140
JUNE ORLANDO Cutting-edge approaches from schools that are ahead of the curve in preparing for the Common Core State Standards, Next Generation Assessments, and Teacher Evaluation based on student performance: Leveraging rigor, relevance, and relationships to prepare students for success in the increasingly technology-driven global economy Empowering educators to embrace innovation and leverage technology to change the way they teach

141
1587 Route 146 Rexford, NY Phone (518) Fax (518) -

Similar presentations


 Summer 2012 Using Common Core to Enhance your Instruction 1.>")


 Nevada Joint Union High School District Nevada Union High School September 23, 2013 Louise Johnson, Ed.D. Superintendent.>")