Download presentation
Presentation is loading. Please wait.

1
Calculating and Interpreting Slope: Implications for School Psychologists
Caitlin S. Flinn, Ed.S. & Andrew E. McCrea, M.S., NCSP ASPP/PSU Conference October 8, 2009

2
Translations… ROI = Rate of Improvement, Slope
RTI = Response to Intervention SLD = Specific Learning Disability DD = Dually Discrepant

3
Overview Conceptualization Importance Definitions Functions
Graphing in Excel Individual Graphs Calculating ROI Decision Making Grounding the Data Interpreting Growth Individual Student Student Groups Considerations

4
What is Rate of Improvement?

5
Graphs in Education Core instruction efficacy Data-driven instruction
Batsche, et al., 2005 Data-driven instruction NCLB, 2001; IDEA, 2004 Incremental skill growth Colvin, Sugai, Good, & Young-Yon, 1997 Intervention effectiveness Batsche, Castillo, Dixon, & Forde, 2008 Setting goals Shapiro, 2008 Progress monitoring Wright, 2008; Fuchs & Fuchs, 1997

6
Graphs in Education Assessing level and rate Self monitoring IEP goals
Batsche, Castillo, Dixon, & Forde, 2008 Self monitoring Fuchs et al., 2006 IEP goals Shinn, 2008 Professional accountability Sulzer-Asaroff & Mayer, 1991 Treatment integrity Mortenson & Witt, 1998 Teacher performance feedback Noell et al., 2005

7
Why do we like graphs so much?
Seeing is believing! A picture is worth a thousand words! People remember Speeches that included visuals, especially in color, improved immediate recall by 8.5% and delayed recall (3 days) by 10.1% (Vogel, Dickson, & Lehman, 1990) Visual aids are more effective for communicating large amounts of information quickly Transcend language barriers (Karwowski, 2006)
 by 10.1% (Vogel, Dickson, & Lehman, 1990) Visual aids are more effective for communicating large amounts of information quickly. Transcend language barriers (Karwowski, 2006)")
8
Is seeing enough? If there are only two data points, basic slope calculation is accurate.

9
Why do I need to know ROI? This is also how to calculate an aimline.

10
Why Bother with all the Data?
If there are multiple data points, should you calculate the slope between the first and last data points only?

11
ROI in Educational Decisions
Data (slope) Interpretation (progress?) Decision Instructional Need
 Interpretation. (progress ) Decision. Instructional Need.")
12
Quick Stretch of the Mind
Data Benchmark: 77 Diego: 41 Interpretation NOT GOOD! Decision ??? Will Diego catch up? Do you have enough info?

13
Quick Stretch of the Mind
Data Benchmark: 77, 92 Diego: 41, 62, 63 Interpretation Slightly better Decision ??? Will Diego catch up? Do you have enough info?

14
Quick Stretch of the Mind
Data Benchmark: 77, 92 Diego: 41 … 104 Interpretation Good work Decision Cured!!! Will Diego maintain that progress?

15
Quick Stretch of the Mind
Data Benchmark: 77, 92 Diego: 41 … 74 Interpretation Ummm Decision Uh oh… What EXACTLY IS Diego’s Progress??

16
Quick Stretch of the Mind
Now can you make a decision?

17
Rationale for Importance of ROI
Shift from discrepancy to RtI for SLD eligibility determination Use of ROI to determine lack of RtI Questions to be Empirically Answered What parameters of ROI indicate lack of RtI? How does ROI present between SLD and non-SLD? What are reasonable goals using ROI?

18
Rationale for Importance of ROI
School psychological practices including more CBM as a result of IDEA 2004 and NCLB 2001 CBM is great because: Comparisons Dual discrepancy Efficient Federal regulations Graph GOM Goal setting Instructional planning Multi-tiered assessment Match instructional level Norms available Parents Progress monitoring Survey level assessments Sensitive to change Screening Systems-level Technically adequate

19
Rate of Improvement Algebraic terms: Aimline: expected performance
slope is the change in the output because of the input, over time a way of looking at growth Aimline: expected performance Trendline: actual performance Definitions: Fuchs and Fuchs (1998) Batsche, Castillo, Dixon, and Forde (2008)
 Batsche, Castillo, Dixon, and Forde (2008)")
20
Rate of Improvement Shapiro (2008)
Criteria for setting reasonable, achievable, and ambitious goals Fuchs, Fuchs, Hamlett, Walz, and Germann (1993) weekly rates of growth in curriculum-based measurements slopes between 1.5 and 2.0 times that of their peers were most likely to remediate skill deficits with current instruction
 weekly rates of growth in curriculum-based measurements. slopes between 1.5 and 2.0 times that of their peers were most likely to remediate skill deficits with current instruction.")
21
Functions of ROI Comparisons peers/class local norms/district
national norms

22
Functions of ROI A decision tool
Shinn’s estimate for decision-making in RTI trainings in Pennsylvania (Kovaleski, 2008) Slope of 2.0x or greater (than expected slope, to close the gap)
 Slope of 2.0x or greater (than expected slope, to close the gap)")
23
Rate of Improvement and RTI
Fuchs and Fuchs (1998) hallmark components of RTI ongoing formative assessment identifying non-responsive students treatment fidelity of core / supplemental instruction “dual discrepancy” a student performing at or greater than one standard deviation from typically performing peers in (a) level (i.e., grade) and (b) rate (slope)
 hallmark components of RTI. ongoing formative assessment. identifying non-responsive students. treatment fidelity of core / supplemental instruction. dual discrepancy a student performing at or greater than one standard deviation from typically performing peers in. (a) level (i.e., grade) and. (b) rate (slope)")
24
Eligibility and ROI School psychologists
Adopt use of additional information (CBM!) “Snapshot” data Good day, bad day data Versus Data continuously collected over time Data that accounts for good days and bad days! Eyeball the graph vs. decision guidelines
 Snapshot data. Good day, bad day data. Versus. Data continuously collected over time. Data that accounts for good days and bad days! Eyeball the graph vs. decision guidelines.")
25
Determining SLD in an RTI Model
Gresham, 2001 RTI is viable alternative for identifying learning disabilities Stuebing, Fletcher, LeDoux, Lyon, Shaywitz, & Shaywitz, 2002 Poor reliability and validity of discrepancy model

26
Determining SLD in an RTI Model
Gresham, 2001 3 models of RTI predictor-criterion dual discrepancy applied behavior analytic

27
Determining SLD in an RTI Model
Gresham, 2001 All three models involved: multiple tiers of intervention progress monitoring effective instructional strategies support for applying the RTI model to identifying students for learning disabilities

28
Eligibility and ROI Deno, Fuchs, Marston, and Shin, 2001
slopes of children identified as frequently non-responsive to robust interventions approximated the slopes of children already identified as having a specific learning disability supportive evidence for dual-discrepancy model

29
Summary of ROI Research
Through an RTI model, students receive instruction based on data. Rate of improvement, or slope, has surfaced in the literature as an indicator for making instructional decisions. Although research is expanding in terms of reliability and validity for both RTI and ROI, extant studies allude to strong utility for educational planning.

30
Skills Typically Graphed
Reading Oral Reading Fluency (ORF) Word Use Fluency (WUF) Reading Comprehension MAZE Retell Fluency Early Literacy Skills Initial Sound Fluency (ISF) Letter Naming Fluency (LNF) Letter Sound Fluency (LSF) Phoneme Segmentation Fluency (PSF) Nonsense Word Fluency (NWF) Spelling Written Expression Behavior Math Math Computation Math Facts Early Numeracy Oral Counting Missing Number Number Identification Quantity Discrimination
 Word Use Fluency (WUF) Reading Comprehension. MAZE. Retell Fluency. Early Literacy Skills. Initial Sound Fluency (ISF) Letter Naming Fluency (LNF) Letter Sound Fluency (LSF) Phoneme Segmentation Fluency (PSF) Nonsense Word Fluency (NWF) Spelling. Written Expression. Behavior. Math. Math Computation. Math Facts. Early Numeracy. Oral Counting. Missing Number. Number Identification. Quantity Discrimination.")
31
Get out your laptops! Open Microsoft Excel I love ROI

32
Setting Up Your Spreadsheet
Open Microsoft Excel In cell B2, type School Week to represent the weeks of school In cell C2, type Benchmark to represent the benchmarks or goals of the skill you are graphing In cell D2, type WPM to represent Words Per Minute (or an abbreviation the basic skill you are graphing)
")
33
Labeling School Weeks In cell B3, type 1 to represent the first week of school Continue numbering to 36 in column 2 Why 36? There’s typically 36 school weeks per school year. Finish at cell B38

34
Entering Benchmarks/Goals
In cell C3, type the number that represents the fall benchmark (months 1-3) of the skill you are graphing (e.g., 77). This score should be next to school week 1. In cell C20, type the number that represents the winter benchmark (months 4-6) of the skill you are graphing (e.g., 92). This score should be next to school week 18. In cell C38, type the number that represents the spring benchmark (months 7-10) of the skill you are graphing (e.g., 110). This score should be next to school week 36.
 of the skill you are graphing (e.g., 77). This score should be next to school week 1. In cell C20, type the number that represents the winter benchmark (months 4-6) of the skill you are graphing (e.g., 92). This score should be next to school week 18. In cell C38, type the number that represents the spring benchmark (months 7-10) of the skill you are graphing (e.g., 110). This score should be next to school week 36.")
35
Entering Student Scores
In cells D3 through D38 type the number that represents the score the student achieved during that week of the school year. If a student was not assessed during a certain week of the school year, leave that cell blank*.

36
Entering Student Scores
*Do NOT enter zero (0) or a score of zero will be calculated into the trend line and interpreted as the student having read zero words correct per minute that week.
 or a score of zero will be calculated into the trend line and interpreted as the student having read zero words correct per minute that week.")
37
Creating a Graph Highlight the data in columns C and D.
Left click with mouse in cell C2. While holding down mouse, highlight columns C and D from row 2 through row 38. These will be your data points contributing to your graph. The selection should include the blank cells in column C.

38
Creating a Graph Left click “Insert” in the tool bar (typically in the top row) while columns C and D are still highlighted. Left click “Chart” in the drop-down menu. A “Chart Wizard” window will appear.

39
Creating a Graph In the Chart Wizard are two tabs. Make sure you are in the left tab, “Standard Types.” Next, you want to left click on the “Line” graph on the left side of your Chart Wizard.

40
Creating a Graph On the right side is “Chart sub-type.” Choose the graph with the description “Line with markers displayed at each data value.” This option is typically the first graph icon in the second row. Left click “Next” at the bottom of your Chart Wizard.

41
Creating a Graph The upper left tab says “Data Range.” The bottom half of that tab has your data range and series type. You want to select “Columns.”

42
Creating a Graph The top right tab is labeled “Series.” Left click on “Series” The top half of the “Series” tab has an icon of your graph. The bottom half shows you the label your data for the legend. Left click “Next” at the bottom of your Chart Wizard.

43
Creating a Graph The next options include tabs for Titles, Axes, Gridlines, etc. If you would like to title your chart, left click on the “Titles” tab. Enter a title (i.e., Diego’s Rate of Improvement) in the first box. Enter a description in the Category (X) Axis, which is your number of school weeks. Suggestion: School Week Enter a description in your Value (Y) Axis, which is the number of the skill you are graphing. Suggestion: Words Per Minute. Left click “Next” at the bottom of your Chart Wizard.
 in the first box. Enter a description in the Category (X) Axis, which is your number of school weeks. Suggestion: School Week. Enter a description in your Value (Y) Axis, which is the number of the skill you are graphing. Suggestion: Words Per Minute. Left click Next at the bottom of your Chart Wizard.")
44
Numerical Label to Data Points
Click on “Data Labels” Click to put a check mark next to “Value” Click on the “Next” Button Note: This can clutter your graph but provide useful info.

45
Creating a Graph Left click the bottom circle to choose “As object in: …” This will put the graph in the worksheet you have open. Left click “Finish” in your Chart Wizard. This will place your graph in your Excel Document.

46
- OR -

47
Creating a Graph You can choose to have the graph created in a new worksheet within your Excel document. Click next to “As new sheet…” Label the worksheet by clicking on the tab at the bottom of the sheet and typing a name (i.e., Diego’s Graph) Left click “Finish” in your Chart Wizard. This will place your graph in a new sheet in your Excel Document.
 Left click Finish in your Chart Wizard. This will place your graph in a new sheet in your Excel Document.")
48
Creating a Graph

49
Resizing the Graph You may resize the graph by clicking in any white space within your graph which will bring up squares at the corners of your graph. You can put your mouse over these squares and drag the graph to a size you prefer. Keep in mind that a large graph may not print easily.

50
Coloring the Graph Right click in the gray area and a drop down menu appears Click on “Format Plot Area”

51
Coloring the Graph The Format Plot Area menu appears.
To eliminate a color border, click next to “None” To eliminate a color plot area, click next to “None” or choose a color. Click “OK”

52
Coloring Data Points Right click on the data points for which you would like to change the color Click on “Format Data Series” Choose the foreground, background, and line color

53
Adding Trendlines RIGHT click on any of the student’s scores/data points within your graph. Left click “Add Trendline” from the menu that appears.

54
Adding Trendlines Under the “Type” tab, click on “Linear.”
Under the “Options” tab, click next to “Custom” and type “Diego’s ROI” Click by “Display Equation…” Click “OK”

55
Adding Trendlines Left clicking on the equation will highlight a “box” around it, and clicking on that box will allow you to move the equation above the chart legend to see it better.

56
Adding Trendlines Repeat this process for the other set of data – your benchmarks. Begin by right clicking on any of your three goal data points. For your benchmark data, label the trendline title “Expected Slope” Click next to “Display equation on chart” Click “OK”

57
Adding Trendlines Move your equation under the first one

58
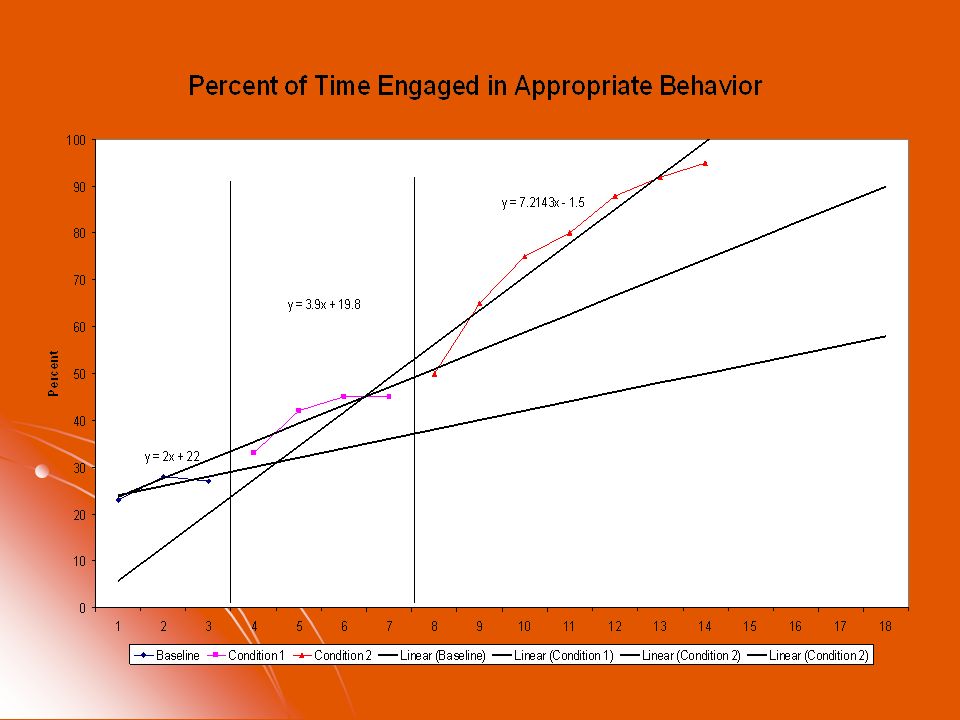
Lines, Lines, Lines

59
Cautions in Interpreting Slope (my disclaimer!)
The graph depicts the actual scores as data points on the graph. You can change the size of the font for the numeric values by right clicking on any of them and choosing a smaller font size. This may reduce some of the clutter on your graph. The rate of improvement, or trendline, is calculated using a linear regression, a simple equation of least squares. This line takes into account each score entered to portray an average rate of improvement across school weeks. The equation indicates the slope, or rate of improvement. The number, or coefficient, before "x" is the average improvement, which in this case is the average number of words per minute per week gained by the student.

60
Cautions in Interpreting Slope (my disclaimer continued!)
The slope can change depending on which week (where) you put the benchmark scores on your chart. Enter benchmark scores based on when your school administers their benchmark assessments for the most accurate depiction of expected student progress. To add additional progress monitoring/benchmark scores once you’ve already created a graph, enter additional scores in Column D in the corresponding school week. Remember to leave cells blank for the weeks that no score was obtained. The graph will incorporate that score into the set of data points and into the trendline.
 you put the benchmark scores on your chart. Enter benchmark scores based on when your school administers their benchmark assessments for the most accurate depiction of expected student progress. To add additional progress monitoring/benchmark scores once you’ve already created a graph, enter additional scores in Column D in the corresponding school week. Remember to leave cells blank for the weeks that no score was obtained. The graph will incorporate that score into the set of data points and into the trendline.")
61
Program Excel to Calculate ROI
Type “ROI” in cell B39 (below your last week of school)
")
62
Program Excel to Calculate ROI
To calculate the expected slope as per the benchmarks: Click on cell C39 Put your cursor at the top next to the fx Type: =SLOPE(C3:C38,B3:B38) Hit Enter/Return
 Hit Enter/Return.")
63
Program Excel to Calculate ROI
To calculate the student’s slope: Click on cell D39 Put your cursor at the top next to the fx Type: =SLOPE(D3:D38,B3:B38) Hit Enter/Return
 Hit Enter/Return.")
64
within a Problem-Solving Model
ROI as a Decision Tool within a Problem-Solving Model

65
Steps Gather the data Ground the data Interpret the data
Figure out how to fit Best Practice into Public Education

66
Universal Screening Progress Monitoring
Step 1: Gather Data Universal Screening Progress Monitoring

67
Common Screenings in PA
DIBELS AIMSweb MBSP 4Sight PSSA

68
Validated Progress Monitoring Tools
DIBELS AIMSweb MBSP

69
To what will we compare our student growth data?
Step 2: Ground the Data To what will we compare our student growth data?

70
Multiple Ways to Look at Growth
Needed Growth Expected Growth & Percent of Expected Growth Fuchs et. al. (1993) Table of Realistic and Ambitious Growth Growth Toward Individual Goal* *Best Practices in Setting Progress Monitoring Goals for Academic Skill Improvement (Shapiro, 2008)
 Table of Realistic and Ambitious Growth. Growth Toward Individual Goal* *Best Practices in Setting Progress Monitoring Goals for Academic Skill Improvement (Shapiro, 2008)")
71
Looking at Percent of Expected Growth
Tier I Tier II Tier III Greater than 150% Between 110% & 150% Possible LD Between 95% & 110% Likely LD Between 80% & 95% May Need More Below 80% Needs More Tigard-Tualatin School District (

72
Oral Reading Fluency Adequate Response Table
Realistic Growth Ambitious Growth 1st 2.0 3.0 2nd 1.5 3rd 1.0 4th 0.9 1.1 5th 0.5 0.8 Fuchs, Fuchs, Hamlett, Walz, & Germann (1993)
")
73
Digit Fluency Adequate Response Table
Realistic Growth Ambitious Growth 1st 0.3 0.5 2nd 3rd 4th 0.75 1.2 5th Fuchs, Fuchs, Hamlett, Walz, & Germann (1993)
")
75
Step 3: Interpreting Growth

76
What do we do when we do not get the growth we want?
When to make a change in instruction and intervention? When to considered SLD?

77
When to make a change in instruction and intervention?
Enough data points (6 to 10)? Less than 100% of expected growth. Not on track to make benchmark (needed growth). Not on track to reach individual goal.
 Less than 100% of expected growth. Not on track to make benchmark (needed growth). Not on track to reach individual goal.")
78
When to consider SLD? Continued inadequate response despite:
Fidelity with Tier I instruction and Tier II intervention. Multiple attempts at intervention. Individualized Problem-Solving approach.

79
Whole Class Example

80
3rd Grade Math Whole Class
Who’s responding? Effective math instruction? Who needs more? N=19 4 > 100% growth 15 < 100% growth 9 w/ negative growth

81
Small Group Example

82
Intervention Group Intervention working for how many?
Can we assume fidelity of intervention based on results? Who needs more?

83
Individual Kid Example

84
Individual Kid Making growth? How much (65% of expected growth).
Atypical growth across the year (last 3 data points). Continue? Make a change? Need more data?
. Continue Make a change Need more data")
85
Step 4: Figure out how to fit Best Practice into Public Education

86
Things to Consider Who cares about Rate of Improvement?
Who is At-Risk and needs progress monitoring? Who will collect, score, enter the data? Who will monitor student growth, when, and how often? What changes should be made to instruction & intervention?

87
Who cares about Rate of Improvement?
Explaining the concept of RoI. Creating buy-in with ORF, M-CBM, etc. Defending frequent data collection (the “we spend too much time testing and not enough time teaching” argument).
.")
88
Who is At-Risk and needs progress monitoring?
Below level on universal screening Entering 4th Grade Example DORF (110) ISIP TRWM (55) 4Sight (1235) PSSA (1235) Student A 115 58 1255 1232 Student B 85 48 1216 1126 Student C 72 35 1056 1048
 ISIP TRWM (55) 4Sight (1235) PSSA (1235) Student A Student B Student C")
89
Who will collect, score, and enter the data?
Using MBSP for math, teachers can administer probes to whole class. DORF probes must be administered one-on-one, and creativity pays off (train and use art, music, library, etc. specialists). Schedule for progress monitoring math and reading every-other week.
. Schedule for progress monitoring math and reading every-other week.")
90
Week 1 Week 2 Reading Math 1st X 2nd 3rd 4th 5th

91
Who will monitor student growth, when, and how often?
Best Practices in Data-Analysis Teaming (Kovaleski & Pedersen, 2008) Chambersburg Area School District Elementary Response to Intervention Manual (McCrea et. al., 2008) Derry Township School District Response to Intervention Model (
 Chambersburg Area School District Elementary Response to Intervention Manual (McCrea et. al., 2008) Derry Township School District Response to Intervention Model (")
92
What changes should be made to instruction & intervention?
Ensure treatment fidelity!!!!!!!! Increase instructional time (active and engaged) Decrease group size Gather additional, diagnostic, information Change the intervention
 Decrease group size. Gather additional, diagnostic, information. Change the intervention.")
93
RoI and Behavior?

95
Check These Out www.interventioncentral.com www.aimsweb.com

96
Check These Out www.fcrr.org Florida Center for Reading Research
What Works Clearinghouse Rate of Improvement National Center on RtI

97
References Batsche, G. M., Castillo, J. M., Dixon, D. N., & Forde, S. (2008). Best practices in linking assessment to intervention. In A. Thomas and J. Grimes (Eds.), Best practices in school psychology V. (pp ). Bethesda, MD: National Association of School Psychologists. Batsche, G. M., Elliot, J., Graden, J. L., Kovaleski, J. F., Prasse, D., et al. (2005). Response to intervention: Policy considerations and implementation. Alexandria, VA: National Association of School Psychologists. Colvin, G., Sugai, G., Good, R. H., III, & Young-Yon, L. (1997). Using active supervision and precorrection to improve transition behaviors in an elementary school. School Psychology Quarterly, 12, Deno, S. L. (1985). Curriculum-based measurement: The emerging alternative. Exceptional Children, 52, Deno, S. L., & Fuchs, L. S. (1987). Developing curriculum-based measurement systems for databased special education problem solving. Focus on Exceptional Children, 19(8), 1-15. Deno, S. L., Fuchs, L.S., Marston, D., & Shin, J. (2001). Using curriculum-based measurement to establish growth standards for students with learning disabilities. School Psychology Review, 30,
. Best practices in linking assessment to intervention. In A. Thomas and J. Grimes (Eds.), Best practices in school psychology V. (pp ). Bethesda, MD: National Association of School Psychologists. Batsche, G. M., Elliot, J., Graden, J. L., Kovaleski, J. F., Prasse, D., et al. (2005). Response to intervention: Policy considerations and implementation. Alexandria, VA: National Association of School Psychologists. Colvin, G., Sugai, G., Good, R. H., III, & Young-Yon, L. (1997). Using active supervision and precorrection to improve transition behaviors in an elementary school. School Psychology Quarterly, 12, Deno, S. L. (1985). Curriculum-based measurement: The emerging alternative. Exceptional Children, 52, Deno, S. L., & Fuchs, L. S. (1987). Developing curriculum-based measurement systems for databased special education problem solving. Focus on Exceptional Children, 19(8), Deno, S. L., Fuchs, L.S., Marston, D., & Shin, J. (2001). Using curriculum-based measurement to establish growth standards for students with learning disabilities. School Psychology Review, 30,")
98
References Flinn, C. S. (2008). Graphing rate of improvement for individual students. InSight, 28(3), Fuchs, L. S., Fuchs, D., Hamlett, C. L., Walz, L., & Germann, G. (1993). Formative evaluation of academic progress: How much growth can we expect? School Psychology Review, 22, Fuchs, L. S., & Fuchs, D. (1998). Treatment validity: A unifying concept for reconceptualizing the identification of learning disabilities. Learning Disabilities Research and Practice, 13, Fuchs, L. S., & Fuchs, D. (1997) Use of curriculum-based measurement in identifying students with learning disabilities. Focus on Exceptional Children, 30, 1–16. Fuchs, L. S., Fuchs, D., Hamlett, C. L., Hope, S. K., Hollenback, K. N. Capizzi, A. M., Craddock, C. F., & Brothers, R. L. (2006). Extending responsiveness-to-intervention to math problem-solving at third grade. Teaching Exceptional Children, 38, Gresham, F. (2001, August). Responsiveness to intervention: An alternative approach to the identification of learning disabilities. In R. Bradley, L. Danielson, & D. P. Hallahan (Eds.). Identification of learning disabilities: Research in practice (pp. 467–519). Mahwah, NJ: Erlbaum. Individuals with Disabilities Education Improvement Act (IDEIA) of 2004, Pub. L. No. 108,446.
. Formative evaluation of academic progress: How much growth can we expect School Psychology Review, 22, Fuchs, L. S., & Fuchs, D. (1998). Treatment validity: A unifying concept for reconceptualizing the identification of learning disabilities. Learning Disabilities Research and Practice, 13, Fuchs, L. S., & Fuchs, D. (1997) Use of curriculum-based measurement in identifying students with learning disabilities. Focus on Exceptional Children, 30, 1–16. Fuchs, L. S., Fuchs, D., Hamlett, C. L., Hope, S. K., Hollenback, K. N. Capizzi, A. M., Craddock, C. F., & Brothers, R. L. (2006). Extending responsiveness-to-intervention to math problem-solving at third grade. Teaching Exceptional Children, 38, Gresham, F. (2001, August). Responsiveness to intervention: An alternative approach to the identification of learning disabilities. In R. Bradley, L. Danielson, & D. P. Hallahan (Eds.). Identification of learning disabilities: Research in practice (pp. 467–519). Mahwah, NJ: Erlbaum. Individuals with Disabilities Education Improvement Act (IDEIA) of 2004, Pub. L. No. 108,446.")
99
References Kovaleski, J. F. (2008, September 19). Pennsylvania promotes best practices in school psychology. Paper presented at the Pennsylvania Training and Technical Assistance Network, King of Prussia, PA. Mortenson, B. P., & Witt, J. C. (1998). The use of weekly performance feedback to increase teacher implementations of a prereferral academic intervention. School Psychology Review, 27, No Child Left Behind Act of Pub. L. No , 115 Stat (2002). Noell, G. H., Witt, J. C., Slider, N. J., Connell, J. E., Giatti, S. L., Williams, K. L., et al. (2005). Treatment implementation following behavior consultation in schools: A comparison of three follow-up strategies. School Psychology Review, 34(1), Shapiro, E. S. (2008). Best practices in setting progress monitoring goals for academic skill improvement. In A. Thomas and J. Grimes (Eds.), Best practices in school psychology V (Vol. 2, pp ). Bethesda, MD: National Association of School Psychologists. Shinn, M. R. (Ed.). (1998). Advanced applications of curriculum-based measurement. New York: Guilford Press.
. Pennsylvania promotes best practices in school psychology. Paper presented at the Pennsylvania Training and Technical Assistance Network, King of Prussia, PA. Mortenson, B. P., & Witt, J. C. (1998). The use of weekly performance feedback to increase teacher implementations of a prereferral academic intervention. School Psychology Review, 27, No Child Left Behind Act of Pub. L. No , 115 Stat (2002). Noell, G. H., Witt, J. C., Slider, N. J., Connell, J. E., Giatti, S. L., Williams, K. L., et al. (2005). Treatment implementation following behavior consultation in schools: A comparison of three follow-up strategies. School Psychology Review, 34(1), Shapiro, E. S. (2008). Best practices in setting progress monitoring goals for academic skill improvement. In A. Thomas and J. Grimes (Eds.), Best practices in school psychology V (Vol. 2, pp ). Bethesda, MD: National Association of School Psychologists. Shinn, M. R. (Ed.). (1998). Advanced applications of curriculum-based measurement. New York: Guilford Press.")
100
References Shinn, M. R. (2008). Best practices in using curriculum-based measurement in a problem-solving model. In A. Thomas and J. Grimes (Eds.), Best practices in school psychology V (Vol. 2, pp ). Bethesda, MD: National Association of School Psychologists. Sulzer-Azaroff, B., & Mayer, G. R. (1991). Behavior analysis for lasting change. Fort Worth: Holt, Rinehart, & Winston. Stuebing, K., Fletcher, J., LeDoux, J., Lyon, G. R., Shaywitz, S., & Shaywitz, B. (2002). Validity of IQ-discrepancy classifications of reading disabilities: A meta-analysis. American Educational Research Journal, 39, 469–518. Upah, K. R. F. (2008). Best practices in designing, implementing, and evaluating quality interventions. In A. Thomas and J. Grimes (Eds.), Best practices in school psychology V. (pp ). Bethesda, MD: National Association of School Psychologists. Wright, J. (2008). Internet resources for ‘response to intervention’. Retrieved June 24, 2008, from
. Best practices in using curriculum-based measurement in a problem-solving model. In A. Thomas and J. Grimes (Eds.), Best practices in school psychology V (Vol. 2, pp ). Bethesda, MD: National Association of School Psychologists. Sulzer-Azaroff, B., & Mayer, G. R. (1991). Behavior analysis for lasting change. Fort Worth: Holt, Rinehart, & Winston. Stuebing, K., Fletcher, J., LeDoux, J., Lyon, G. R., Shaywitz, S., & Shaywitz, B. (2002). Validity of IQ-discrepancy classifications of reading disabilities: A meta-analysis. American Educational Research Journal, 39, 469–518. Upah, K. R. F. (2008). Best practices in designing, implementing, and evaluating quality interventions. In A. Thomas and J. Grimes (Eds.), Best practices in school psychology V. (pp ). Bethesda, MD: National Association of School Psychologists. Wright, J. (2008). Internet resources for ‘response to intervention’. Retrieved June 24, 2008, from")
Similar presentations


: A Realistic Approach Presented By: Lisa Harrod Lisa Harrod.>")


