Download presentation
Presentation is loading. Please wait.

1
The Case Against Water Fluoridation
Paul Connett, PhD Professor Emeritus of Environmental Chemistry St. Lawrence University, Canton, NY Director, Fluoride Action Network Auckland, NZ, April 2, 2011

2
Outline of talk 1. Fluoridation is a poor medical practice 2. Fluoridation is unethical 3. The evidence of any benefit is very weak 4. There is no adequate margin of safety to protect the brain from harm and other KNOWN health effects 5. Why does the NZ MOH continue to push fluoridation? 6. The next steps.

3
Part 1. Fluoridation is a poor medical practice

4
Fluoridation is a poor medical practice
1. Fluoridation is the only time since 1945 we have used the public water supply to deliver medicine. 2. You can control CONCENTRATION (mg/liter) at the water works but you can’t control DOSE (mg/day) that people drink. 3. You can’t control who gets the medicine.
 at the water works but you can’t control DOSE (mg/day) that people drink. 3. You can’t control who gets the medicine.")
5
Fluoridation is a poor medical practice
4) There is no individual oversight by a doctor 5) No health agency is monitoring for side effects 6) Fluoride is NOT a nutrient. 7) Fluoride is a known toxic substance that interferes with many fundamental biochemical functions
 There is no individual oversight by a doctor. 5) No health agency is monitoring for side effects. 6) Fluoride is NOT a nutrient. 7) Fluoride is a known toxic substance that interferes with many fundamental biochemical functions.")
6
Fluoridation is a poor medical practice
8. The chemicals used are not pharmaceutical grade as used in dental products They come from the wet scrubbers of the phosphate fertilizer industry A spray of water captures two very toxic gases (HF and SiF4) that have caused a great deal of environmental damage. This hazardous waste cannot be dumped into the sea by international law, BUT if this waste is PURCHASED by someone it becomes a PRODUCT and is no longer covered by US hazardous waste regulations!
 that have caused a great deal of environmental damage. This hazardous waste cannot be dumped into the sea by international law, BUT if this waste is PURCHASED by someone it becomes a PRODUCT and is no longer covered by US hazardous waste regulations!")
7
Fluoridation is a poor medical practice
9. The main chemicals used are the silicon fluorides: H2SiF6 (hexa fluoro silicic acid) or its sodium salt Na2SiF6 (sodium hexa fluorosilicate). Neither of these chemicals, either in their pure form, or the contaminated solutions used, have been put through any rigorous toxicological testing.
 or its sodium salt Na2SiF6 (sodium hexa fluorosilicate). Neither of these chemicals, either in their pure form, or the contaminated solutions used, have been put through any rigorous toxicological testing.")
8
Proponents claim That they are merely adjusting the levels of a naturally occurring element. Just because a substance occurs naturally does not make it safe – arsenic occurs naturally! As far as nature is concerned it has made a determination of how much fluoride the baby needs – and it is VERY, VERY small. The proponent’s adjustment is to give a new born baby up to 250 times the level of fluoride in mothers’ milk (1 ppm = 250 x ppm)
")
9
Fluoridation is a poor medical practice
In NZ 0.7 – 1.0 ppm fluoride added to water (average 0.85 ppm) 0.85 ppm is over 200 times the level in mothers’ milk (0.004 ppm) A bottle fed baby gets 20,000% the dose a breast fed baby gets
 0.85 ppm is over 200 times the level in mothers’ milk (0.004 ppm) A bottle fed baby gets 20,000% the dose a breast fed baby gets")
10
Proponents claim That water fluoridation is not medication,
But the definition of a medicine is a substance given to people to help prevent or combat a disease. Fluoride is added to water to help combat or prevent tooth decay (a disease). Fluoride is being used as a medicine and water fluoridation is “mass medication.”
. Fluoride is being used as a medicine and water fluoridation is mass medication.")
11
Fluoridation is a poor medical practice
The official classification of the The US Food and Drug Administration: Fluoride is “an unapproved drug.” The FDA has never regulated fluoride for ingestion. As a result… Fluoridation has never been subjected to randomized clinical trials (RCT) for effectiveness or safety as required for other drugs.
 for effectiveness or safety as required for other drugs.")
12
The FDA does regulate fluoridated toothpaste in the US

14
A Pea Size amount of Tooth Paste contains 0.25 mg

15
A Pea Size amount of Tooth Paste contains 0
A Pea Size amount of Tooth Paste contains 0.25 mg equivalent to 250 ml of water at 1 ppm

16
A Pea Size amount of Tooth Paste contains 0
A Pea Size amount of Tooth Paste contains 0.25 mg equivalent to 250 ml of water at 1 ppm i.e. 1 large glass of water

17
Part 2. Fluoridation is not ethical

18
Fluoridation is not ethical
1. No government has the right to force medication on its people to fight a non-contagious, non-life-threatening disease. 2. It deprives individuals of their right to “informed consent to medication.” 3. With fluoridation a government is doing to EVERYONE what a doctor can do to NO ONE.

19
Part 3. The evidence of benefit is very weak

20
Only EIGHT Countries have more than 50% of the population drinking fluoridated water (Australia, Colombia, Ireland, Israel, Malaysia, New Zealand, Singapore and the United States)
")
21
98% of Western Europe now drinks Non-Fluoridated Water
Austria Belgium Denmark Finland France Germany Greece Iceland Italy Luxembourg Netherlands Northern Ireland Norway Scotland Sweden Switzerland

22
98% of Western Europe now drinks Non-Fluoridated Water
Austria* Belgium Denmark Finland France* Germany* Greece Iceland Italy Luxembourg Netherlands Northern Ireland Norway Scotland Sweden Switzerland* *Some fluoridate their salt

23
Most countries don’t fluoridate their water, but according to WHO data their kids’ teeth are as good as those that do

24
SOURCE: World Health Organization. (Data online)
")
25
Comparing US Communities

26
NIDR conducted the largest survey of tooth decay ever conducted in the US (1986-7)
The teeth of over 39,000 children in 84 communities were examined.

27
3.4 DMFS NF 2.8 F DMFS The largest US survey of tooth decay
Average difference (for year olds) in DMFS
 in DMFS.")
28
3.4 DMFS NF 2.8 F DMFS Brunelle and Carlos, 1990
Average difference (for year olds) in DMFS = 0.6 tooth surfaces (5 surfaces to a tooth)
 in DMFS. = 0.6 tooth surfaces (5 surfaces to a tooth)")
29
Studies in Australia have found even less saving than O.6 DMFS!
Spencer et al. (1996) found a saving in two states of ONLY 0.12 – 0.3 permanent tooth surfaces. Armfield and Spencer (2004) found no statistically significant difference in tooth decay in the permanent teeth between children in South Australia who had drunk fluoridated water all their lives and those who had drunk bottled or tank water.
 found a saving in two states of ONLY 0.12 – 0.3 permanent tooth surfaces. Armfield and Spencer (2004) found no statistically significant difference in tooth decay in the permanent teeth between children in South Australia who had drunk fluoridated water all their lives and those who had drunk bottled or tank water.")
30
“The magnitude of [fluoridation’s] effect is not large
in absolute terms, is often not statistically significant, and may not be of clinical significance.” SOURCE: David Locker for the Ontario Ministry of Health & Long Term Care, 1999
![The magnitude of [fluoridation’s] effect is not large](http://slideplayer.com/slide/224288/1/images/30/The+magnitude+of+%5Bfluoridation%E2%80%99s%5D+effect+is+not+large.jpg "in absolute terms, is often not statistically significant, and may not be of clinical significance. SOURCE: David Locker for the Ontario. Ministry of Health & Long Term Care,")
31
Studies in NZ Dr. John Colquhoun (1984, 1985, 1987) found no difference in tooth decay between fluoridated and non-fluoridated communities in NZ
 found no difference in tooth decay between fluoridated and non-fluoridated communities in NZ.")
32
Hastings-Napier trial: A Fraud?

33
Studies in NZ De Liefde, 1998 described the difference in tooth decay in the permanent teeth as “clinically meaningless”

34
Studies in NZ (MOH) Recent studies reported in MOH (2010), “Our Oral Health” “… found that 9-10 year olds continuously exposed to water fluoridation had half the dental caries experience…” The MOH cites four recent NZ studies

35
Lee and Dennison, 2004 Wellington versus Canterbury saving of 1 DMFS (2.4 – 1.4), MOH, 2010, p.28. 1/2.4 x 100 = 41% saving If Lee and Dennison had compared non-fluoridated Canterbury (1.28 DMFT) with fluoridated Waikato (1.68 DMFT) and fluoridated Otago (1.42 DMFT). NF Canterbury is 31% and 11% better than F Waikato and F Otago respectively (MOH, 2009 data).
 with fluoridated Waikato (1.68 DMFT) and fluoridated Otago (1.42 DMFT). NF Canterbury is 31% and 11% better than F Waikato and F Otago respectively (MOH, 2009 data).")
36
Kanagaratnam et al., 2009 “no significant relationship was found between residential fluoridation history and dental caries in the permanent dentition..”

37
Schluter et al 2008 Prevalence of caries:
Deciduous teeth, prevalence: F = 54.9%, NF = 62.0 % (p=0.05) Saving = 7.1% Permanent teeth prevalence F = 15.9%, NF = 11.7% (p=0.14) Permanent teeth worse in F-areas but not statistically significant
 Saving = 7.1% Permanent teeth prevalence F = 15.9%, NF = 11.7% (p=0.14) Permanent teeth worse in F-areas but not statistically significant.")
38
Mackay and Thomson, 2005 Residence in F area up to age 9
Permanent teeth: DMFS None Intermittent 1.18 Continuous 0.70 Saving = 1.22 – 0.70 = 0.52 DMFS % saving = 0.70/1.22 x 100 = 43%

39
Savings in the four studies cited by MOH
0, 0, 0.53 and 1 permanent tooth surfaces out of about 100 permanent tooth surfaces in a child’s mouth

40
Percentage savings versus absolute savings
Proponents frequently report their findings as percentage savings. This can be very deceptive. We saw in the Mackay and Thomson, 2005 study that a saving of one half of a permanent tooth surface (note there are 4 or 5 surfaces to a tooth) equates to a percentage saving of 43%. The latter sounds more impressive to the general public.
 equates to a percentage saving of 43%. The latter sounds more impressive to the general public.")
41
Delayed eruption in F areas
There is some evidence that fluoride delays the eruption of the permanent teeth (Komarek, 2005) A delay of one year would eliminate all the benefits seen in recent studies in NZ. According to the York Review (McDonagh et al. 2000) “No study used an analysis that would control for the frequency of sugar consumption or the number of erupted teeth per child” (York, p.24)
 A delay of one year would eliminate all the benefits seen in recent studies in NZ. According to the York Review (McDonagh et al. 2000) No study used an analysis that would control for the frequency of sugar consumption or the number of erupted teeth per child (York, p.24)")
42
Delayed eruption of teeth William Kiel, Alamo Heights.
Recent Trends in Dental Caries in U.S. Children and the Effect of Water Fluoridation by J.A. Brunelle and J.P. Carlos Journal of Dental Research February 1990 (Volume 69, Special Issue, Pages ) Original Data – Age Based Shifted Data – Post-Eruption Based* Adjusted for one year Delayed eruption of teeth William Kiel, Alamo Heights. Mean DMFS Mean DMFS *Fluoridated data was shifted back by one year; e.g. age 6 Fluoridated aligns with age 5 unfluoridated, etc.
 Original Data – Age Based. Shifted Data – Post-Eruption Based* Adjusted for one year. Delayed eruption of teeth. William Kiel, Alamo Heights. Mean DMFS. Mean DMFS. *Fluoridated data was shifted back by one year; e.g. age 6 Fluoridated aligns with age 5 unfluoridated, etc.")
43
Delayed eruption in F areas
“The DA (dental age) of the AUS and UK populations was found to be different (Fig. 5). The AUS population had a 0.82 year delay in their DA compared to the UK population. This difference was compared and was found to be very statistically significant (P < 0.001).” Peirisi et al. International Journal of Paediatric Dentistry 2009; 19: 367–376
 of the AUS and UK populations was found to be different (Fig. 5). The AUS population had a 0.82 year delay in their DA compared to the UK population. This difference was compared and was found to be very statistically significant (P < 0.001). Peirisi et al. International Journal of Paediatric Dentistry 2009; 19: 367–376.")
44
Important recent studies
Komarek et al., 2005 (controlled for delayed eruption of teeth in F-communities). Found no difference in tooth decay between F and non-F communities. Warren et al., 2009 (measured tooth decay as a function of individual exposure to fluoride). Found no relation between tooth decay and amount of fluoride ingested.
. Found no difference in tooth decay between F and non-F communities. Warren et al., 2009 (measured tooth decay as a function of individual exposure to fluoride). Found no relation between tooth decay and amount of fluoride ingested.")
45
An explanation for weak evidence of benefit in recent studies
The major benefits of fluoride are TOPICAL not SYSTEMIC. (CDC, 1999, 2001). In other words fluoride works on the outside surface of the tooth not from inside the body Fluoridation should have ended in 1999!
. In other words fluoride works on the outside surface of the tooth not from inside the body Fluoridation should have ended in 1999!")
46
It works on the outside of the tooth.
Fluoride’s main benefit is TOPICAL. It works on the outside of the tooth. “Its actions primarily are topical for both adults and children." Centers for Disease Control, 1999 "Fluoride's predominant effect is posteruptive and topical." Centers for Disease Control, 2001

47
NOBEL LAUREATE in MEDICINE 2000
“In pharmacology, if the effect is local (topical), it's awkward to use it in any other way than as a local treatment. I mean this is obvious. You have the teeth there, they're available for you, why drink the stuff?” Dr. ARVID CARLSSON, NOBEL LAUREATE in MEDICINE 2000
, it s awkward to use it in any other way than as a local treatment. I mean this is obvious. You have the teeth there, they re available for you, why drink the stuff Dr. ARVID CARLSSON, NOBEL LAUREATE in MEDICINE")
48
Part 4. There is no adequate margin of safety to protect everyone from known harmful effects of fluoride

49
US National Research Council
Harmful effects have been carefully documented in a 507-page (1100 references) report by the US National Research Council published in 2006.
 report by the. US National Research Council. published in")
50
National Research Council (2006)
")
51
Harmful effects of FLUORIDE include:
1. Dental fluorosis 2. Brain damage 3. Lowered thyroid function 4. Accumulation in the pineal gland 5. Bone damage 6. Osteosarcoma? 7. Some people very sensitive to very low levels

52
Dental Fluorosis Early promoters thought that at 1 ppm F they could limit dental fluorosis to 10% of children in its very mild form.

53
Very Mild Dental Fluorosis
Impacts up to 25% of tooth surface Very Mild Dental Fluorosis

54
Impacts up to 50% of tooth surface
Mild Dental Fluorosis

55
Moderate Dental Fluorosis
Impacts 100% of tooth surface Moderate Dental Fluorosis

56
Prevalence and Severity of Dental Fluorosis in the United States, 1999-2004
November 2010: CDC update on fluorosis by Beltrán-Aguilar et al.

57
CDC, 2010

58
CDC, 2010 41%

59
Sensitivity to fluoride’s toxicity may have an ethnic component
Afro Americans and Hispanic Americans appear to be more sensitive to fluoride’s toxicity. – They have HIGHER dental fluorosis rates than white Americans in same communities.

60
Dental Fluorosis in NZ NZ dental fluorosis rates = about 30%

61
A KEY QUESTION When fluoride is damaging the baby’s growing tooth cells (causing dental fluorosis) what is it doing to its other developing tissues?
 what is it doing to its other developing tissues")
62
The baby’s developing brain
The baby should NOT be exposed to fluoride of up to 250 times the level of fluoride that occurs in mothers milk

63
Arvid Carlsson Nobel Prize for Medicine, 2000
“One wonders what …an increase in the exposure to fluoride, such as occurs in bottle-fed infants …may mean for the development of the brain and the other organs…” 1978

64
“it is apparent that fluorides have the ability to
National Research Council (2006): Fluoride & the Brain “it is apparent that fluorides have the ability to interfere with the functions of the brain.”
: Fluoride & the Brain. it is apparent that fluorides have the ability to. interfere with the functions of the brain.")
65
Fluoride and the Brain Many more studies on the brain have been published since the NRC review The panel reviewed FIVE IQ studies

66
Human studies As of 2011, there are now 24 published studies (from China, Iran, India and Mexico) indicating that moderate to high fluoride exposure is associated with lowered IQ in children
 indicating that moderate to high fluoride exposure is associated with lowered IQ in children.")
67
Xiang et al. (2003 a,b) Compared children in two villages ( <0.7 ppm versus ppm F in water) Controlled for lead exposure and iodine intake, and other key variables (NOTE: both lead exposure and low iodine also lower IQ). Found a drop of 5-10 IQ points across the whole age range The whole IQ curve shifted for both males and females
. Found a drop of 5-10 IQ points across the whole age range. The whole IQ curve shifted for both males and females.")
68
Xiang et al. (2003 a,b) MALES
 MALES")
69
Xiang et al. (2003 a,b) FEMALES
 FEMALES")
70
Estimated that IQ in children lowered at
Xiang et al. (2003 a,b) Estimated that IQ in children lowered at 1.9 ppm fluoride in water (threshold)
 Estimated that IQ in children lowered at. 1.9 ppm fluoride in water (threshold)")
71
There is no adequate margin of safety
If fluoride is associated with lowering IQ of children at 1.9 ppm in a small population study we need to apply a safety factor to protect the whole population of children Normally we use a safety factor of 10 to do this If we assume that the Chinese children were drinking one liter of fluoride per day the dose that lowered IQ was 1.9 mg/day That would mean to protect the intelligence of ALL the children in a large population a safe dose would be 0.19 mg/day (1.9 divided by 10)
")
72
Xiang et al. (2010) Xiang et al. elaborated on their 2003 study.
Added in more details of methods etc. Added in data showing an association between plasma levels of fluoride and lowered IQ. Accepted for publication by Environmental Health Perspectives the journal of the National Institute of Environmental Health Sciences (NIEHS) NIEHS is an agency of the US Department of Health and Human Services (DHHS). Pre-publication copy of this article published online Article withdrawn because Xiang had published some of the data before (conflicts with EHP policy)
 NIEHS is an agency of the US Department of Health and Human Services (DHHS). Pre-publication copy of this article published online. Article withdrawn because Xiang had published some of the data before (conflicts with EHP policy)")
73
Xiang et al. (2010) Please note:
Xiang et al. (2010) paper was NOT withdrawn because the methodology was considered inadequate The methodology was PEER REVIEWED and the study considered acceptable for publication in the leading US environmental health journal.
 paper was NOT withdrawn because the methodology was considered inadequate. The methodology was PEER REVIEWED and the study considered acceptable for publication in the leading US environmental health journal.")
74
Ding et al. 2011 (J. Hazardous Materials)
“Mean value of fluoride in drinking water was 1.31 ±1.05mg/L (range 0.24–2.84).” “ Conclusions Overall, our study suggested that low levels of fluoride exposure in drinking water had negative effects on children’s intelligence... The results also confirmed the dose–response relationships between urine fluoride concentrations and IQ scores…”
. Conclusions. Overall, our study suggested that low levels of fluoride exposure in drinking water had negative effects on children’s intelligence... The results also confirmed the dose–response relationships between urine fluoride concentrations and IQ scores…")
75
Ding et al. 2011 Fig 2. The relationship between IQ differences and urine fluoride concentrations. Multiple linear regression model was carried out to confirm the association with urine fluoride exposure and IQ scores (F=9.85, p < )
")
76
Ding et al. 2011 “an increase in the urine fluoride concentration of 1 mg/L associated with a decrease of 0.59 IQ scores.”

77
Two preposterous notions
What parent in their right mind would put their children’s teeth above their brains? What government would support a program aimed at lowering tooth decay - by at most 0.6 of one tooth surface – if it lowered the IQ of the population by even a small amount?

78
Other health concerns (see chapters 13-19 in The Case Against Fluoride )
")
79
Fluoride may cause bone cancer (osteosarcoma)
")
80
Osteosarcoma: Science vs Politics
The science: In 2001, Dr. Elise Bassin (a dentist) successfully defended her PhD thesis at Harvard. She found (in a matched case-control study) that if young boys were exposed to fluoridated water in their 6th,7th or 8th years, they had a 5-7 fold increase in developing osteosarcoma by the age of 20, compared to non-exposed boys. Now the politics Between 2001 and 2005, Bassin’s thesis adviser - Prof. Chester Douglass three times concealed her findings (1. From his peers - a meeting of the BFS in 2002; 2. The NRC panel and 3. His funder - the National Institutes of Health (NIH).
 successfully defended her PhD thesis at Harvard. She found (in a matched case-control study) that if young boys were exposed to fluoridated water in their 6th,7th or 8th years, they had a 5-7 fold increase in developing osteosarcoma by the age of 20, compared to non-exposed boys. Now the politics. Between 2001 and 2005, Bassin’s thesis adviser - Prof. Chester Douglass three times concealed her findings (1. From his peers - a meeting of the BFS in 2002; 2. The NRC panel and 3. His funder - the National Institutes of Health (NIH).")
81
Osteosarcoma The Science: Bassin publishes research in the May 2006 issue of the journal Cancer Causes and Control. The politics again. In a letter published in the same issue, Douglass promises a study that he claims will discount Bassin’s findings. This promise of a study is being used by promoters of fluoridation to negate concern over Bassin’s findings. Douglass promised his study for the Summer of 2006 – we are still waiting!

82
National Research Council (2006): Fluoride & the Thyroid
“several lines of information indicate an effect of fluoride exposure on thyroid function.”

83
IF fluoride lowers thyroid function
It could explain: 1) delayed eruption of primary teeth 2) lowered IQ in children 3) Increase in hypothyroidism among US population, plus the accompanying symptoms – obesity, lethargy, tiredness not relieved by sleep etc
 delayed eruption of primary teeth. 2) lowered IQ in children. 3) Increase in hypothyroidism among US population, plus the accompanying symptoms – obesity, lethargy, tiredness not relieved by sleep etc.")
84
Fluoride & Pineal Gland
In 1997 Jennifer Luke confirmed that fluoride accumulates in the human pineal gland. She found an average of 9,000 ppm on the calcium hydroxy apatite crystals (highest 21,000 ppm) (Luke, 2001). In animals (Mongolian gerbils) fluoride lowers melatonin production and shortens time to puberty (Luke, Ph.D. thesis, 1997).
 (Luke, 2001). In animals (Mongolian gerbils) fluoride lowers melatonin production and shortens time to puberty (Luke, Ph.D. thesis, 1997).")
85
Schlesinger et al. (1956)
")
86
Fluoride and Children’s Bone
The Newburgh-Kingston, NY trial (Schlesinger et al, 1956) also reported about twice the incidence of cortical bone defects in the children in the fluoridated community (13.5%) compared with the non-fluoridated community (7.5%).
 also reported about twice the incidence of cortical bone defects in the children in the fluoridated community (13.5%) compared with the non-fluoridated community (7.5%).")
87
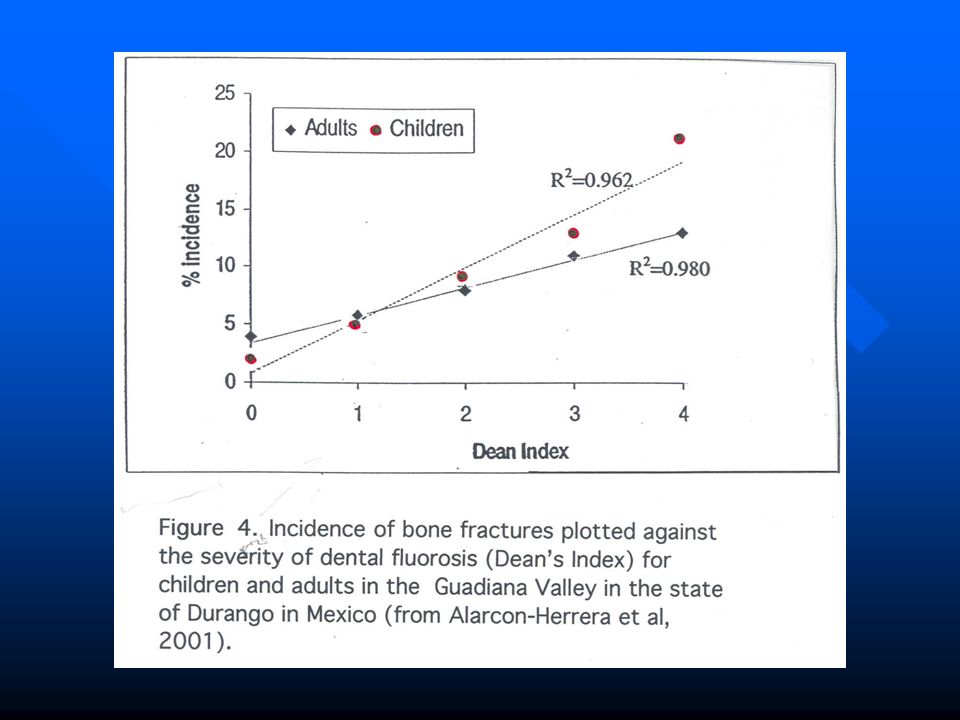
Alarcon-Herrera et al. (2001)
In a Mexican study researchers found that as the severity of dental fluorosis went up so did the incidence of bone fractures in both children and adults

89
Arthritis The first symptoms of fluoride’s poisoning of bone are identical to arthritis (stiffness, aching joints and pain in the bones) According to the CDC, arthritis affects 68 million people in the US - 1 in 3 American adults No fluoridated country is collecting fluoride bone levels in a systematic fashion to check a possible connection with arthritis or other bone problems!

90
Fluoride & Skeletal System
National Research Council (2006): Fluoride & Skeletal System "All members of the committee agreed that there is scientific evidence that under certain conditions fluoride can weaken bone and increase the risk of fractures.”
: Fluoride & Skeletal System. All members of the committee agreed that. there is scientific evidence that under certain conditions. fluoride can weaken bone and increase the risk of fractures.")
91
Li et al (2001)
")
92
Fluoride levels in tea High concentrations of fluoride have been reported in the tea drinks of India, Tibet, and China: Gulati et al. 1993:1.55 – 3.21 mg/l Cao et al. 1996: – 4.32 mg/l Fung et al., 1999: 1.60 – 7.34 mg/l.

93
Fluoride levels in tea Gulati et al. 1993:1.55 – 3.21 mg/l
Cao et al. 1996: – 4.32 mg/l Fung et al., 1999: 1.60 – 7.34 mg/l. I liter = 8 cups or 4 mugs 8 cups of tea/day = 0.76 – 7.34 mg/day 16 cups of tea/day = mg/day A heavy tea drinker could damage their bones

94
Fluoride levels in tea High concentrations of fluoride have been reported in the tea drinks of India, Tibet, and China: Gulati et al. 1993:1.55 – 3.21 mg/l Cao et al. 1996: – 4.32 mg/l Fung et al., 1999: 1.60 – 7.34 mg/l.

95
Fluoride levels in tea Gulati et al. 1993:1.55 – 3.21 mg/l
Cao et al. 1996: – 4.32 mg/l Fung et al., 1999: 1.60 – 7.34 mg/l. I liter = 8 cups or 4 mugs 8 cups of tea/day = 0.76 – 7.34 mg/day 16 cups of tea/day = mg/day A heavy tea drinker could damage their bones

96
Key Health Studies have NOT been done in most fluoridating countries
NO INVESTIGATION of a possible relationship between consumption of fluoridated water and lowered IQ in children (except one small study in NZ), behavioral changes in children (attention deficit etc) arthritic symptoms in adults, hypo-thyroidism (underactive thyroid), increased bone fractures in children, Melatonin levels in children Earlier onset of puberty, Alzheimer’s disease in adults, and
, behavioral changes in children (attention deficit etc) arthritic symptoms in adults, hypo-thyroidism (underactive thyroid), increased bone fractures in children, Melatonin levels in children. Earlier onset of puberty, Alzheimer’s disease in adults, and.")
97
There has been NO FORMAL INVESTIGATION of the many anecdotal reports and case studies (and one clinical trial) that some individuals are highly sensitive to fluoride (e.g. gastrointestinal, neurological and skin conditions) See Fluoride Fatigue (Spittle, 2008)
")
98
If you don’t look, you don’t find!
The absence of studies, does not mean the absence of harm Dr. Peter Cooney, the Chief Dental Officer of Canada, told an audience in Dryden, Ontario (April 1, 2008), “I walked down your High Street today, and I didn’t see anyone growing horns, and you have been fluoridated for 40 years!”
, I walked down your High Street today, and I didn’t see anyone growing horns, and you have been fluoridated for 40 years!")
99
WHY? The only rational explanation for so much irrational (or irresponsible) behavior on the part of health agencies that continue to promote water fluoridation even though the science indicates that it is neither effective nor safe, IN MY OPINION is because it has become more important to protect this practice than it is to protect the health of the people they represent… Why should that be?
 behavior on the part of health agencies that continue to promote water fluoridation even though the science indicates that it is neither effective nor safe, IN MY OPINION is because. it has become more important to protect this practice than it is to protect the health of the people they represent… Why should that be")
100
Why does the dental lobby continue to promote fluoridation?
They are very proud of this practice Fluoridation helped to establish dentistry on a par with medicine Fluoridation is the backbone of public health dentistry Fluoridation has made careers, reputations and provides money for endless research on teeth

101
Why do health bureaucracies continue to promote fluoridation?
We have to do look at this at three levels: At the bottom In the middle At the top of the bureaucracies (or chain of command)
")
102
At the bottom of the chain of command
We have thousands of doctors and dentists who truly BELIEVE that fluoridation works. This was all they were taught at dental and medical school. Now most are so busy treating patients that they don’t have time to read the literature. They take the word of professional bodies and health agencies at face value.

103
In the middle of the chain of command
Within the chain of command we have bureaucrats who are trained to PROMOTE NOT to QUESTION policy (i.e. their jobs depend upon promoting fluoridation)
")
104
At the top of the chain of command
At the top of the chain of command of the health agencies in fluoridating countries the major concern is: Losing credibility

105
Why do health agencies like the NZ MOH continue to promote fluoridation?
Lose fluoridation = lose credibility Lose credibility = lose (or threaten) the public’s trust in other important public health policies Public health policies require the public’s trust MY RESPONSE: I argue that by coming clean and stopping their support for fluoridation (switching to promoting TOPICAL treatments and investing in education for a better diet) health agencies (like NZ MOH) would improve their credibility and regain the public’s trust.
 the public’s trust in other important public health policies. Public health policies require the public’s trust. MY RESPONSE: I argue that by coming clean and stopping their support for fluoridation (switching to promoting TOPICAL treatments and investing in education for a better diet) health agencies (like NZ MOH) would improve their credibility and regain the public’s trust.")
106
Heavy tea drinkers are already getting too much fluoride

107
MY RESPONSE I argue that by coming clean and stopping their support for fluoridation (switching to promoting TOPICAL treatments and investing in education for a better diet) health agencies (like NZ MOH) would improve their credibility and begin to regain the public’s trust.
 health agencies (like NZ MOH) would improve their credibility and begin to regain the public’s trust.")
108
THE SCIENCE INDICATES THAT FLUORIDATION SHOULD BE ENDED
SEE FAN-NZ’s website FANNZ.org.nz SEE FAN’s website FluorideALERT.org SEE FAN’s health data base SEE the NRC (2006) report ONLINE SEE the 28-minute video “Professional Perspectives on Water Fluoridation” SEE our book, “The Case Against Fluoride”
 report ONLINE. SEE the 28-minute video Professional Perspectives on Water Fluoridation SEE our book, The Case Against Fluoride")
109
Book to be published by Chelsea Green October, 2010 Can be ordered now on Amazon.com Meanwhile, see FluorideAlert.org for more information

110
The Next Step We have done our job as scientists
We have outlined our case in detail We have documented every fact and argument we have presented Now we need health authorities to do their job Either respond scientifically to our case or admit that fluoridation was a HUGE MISTAKE and STOP IT NOW!

111
Is like driving a nail through a piece of wood
EFFECTING CHANGE Is like driving a nail through a piece of wood

112
EFFECTING CHANGE Experts may sharpen the point

113
EFFECTING CHANGE Experts may sharpen the point
But you need the hammer of public opinion to drive the nail home

114
More evidence

115
More evidence that promoters of fluoridation are more interested in protecting this practice than protecting our health

116
In Nov, 2006, the American Dental Association told its members
"If using a product that needs to be reconstituted, parents and caregivers should consider using water that has no or low levels of fluoride." SOURCE: American Dental Association, Nov 9, 2006

117
BUT parents are not Being warned!
"If using a product that needs to be reconstituted, parents and caregivers should consider using water that has no or low levels of fluoride." SOURCE: American Dental Association, Nov 9, 2006

118
We need to get this warning to parents
This warning should be inserted in water bills: “Parents should not use tap water to make up baby formula”

119
The difference between science and politics
In science you examine the data and draw a conclusion In politics you reach a conclusion and then select the data to support that conclusion

120
POLITICS versus SCIENCE
A good example of how promoters’ put politics above science is the way they treated the landmark NRC (2006) report.
 report.")
121
The NRC report NRC published their report on March 22, 2006
The panel concluded that the “safe” drinking water standard for fluoride (the MCL and MCLG of 4 ppm) was not protective of health They recommended that the EPA do a health risk assessment to determine a new MCLG
 was not protective of health. They recommended that the EPA do a health risk assessment to determine a new MCLG.")
122
POLITICS versus SCIENCE
On the same day as the NRC published its report the ADA declared the NRC review was irrelevant to water fluoridation! They stated that 4 ppm was much higher than the level used in fluoridation ( ppm) Six days later the CDC declared that NRC report was consistent with their promotion of fluoridation at 1 ppm In 2007, the Australian NHMRC said NRC report not relevant to Australia In Feb. 2009, the Strategic Health Authority in Southampton, UK, said NRC report not relevant to fluoridation in UK
 Six days later the CDC declared that NRC report was consistent with their promotion of fluoridation at 1 ppm. In 2007, the Australian NHMRC said NRC report not relevant to Australia. In Feb. 2009, the Strategic Health Authority in Southampton, UK, said NRC report not relevant to fluoridation in UK.")
123
POLITICS versus SCIENCE
There are FOUR problems with these dismissals of the relevance of the NRC (2006) review: 1) They didn’t wait for the EPA to determine a new MCLG, or attempt their own 2) They are confusing concentration and dose. Someone consuming a lot of water at 1 ppm could get a higher dose than someone consuming a little water at 4 ppm (or less than 4 ppm when a new MCLG is determined) 3) They didn’t attempt a margin of safety analysis on the levels causing harm reported in the NRC report. 4) They didn’t note that in chapter 2 the NRC panel showed that subsets of the population were exceeding the EPA IRIS reference dose drinking water at 1 ppm fluoride
 review: 1) They didn’t wait for the EPA to determine a new MCLG, or attempt their own. 2) They are confusing concentration and dose. Someone consuming a lot of water at 1 ppm could get a higher dose than someone consuming a little water at 4 ppm (or less than 4 ppm when a new MCLG is determined) 3) They didn’t attempt a margin of safety analysis on the levels causing harm reported in the NRC report. 4) They didn’t note that in chapter 2 the NRC panel showed that subsets of the population were exceeding the EPA IRIS reference dose drinking water at 1 ppm fluoride.")
124
THE US EPA On Jan 7, 2011 (after 5 years) the EPA has begun a process that will eventually a determine a new “safe” drinking water standard (MCL) or goal (MCLG) If EPA did this job honestly using routine assumptions and methods used in regulatory health risk assessments it would force a new MCLG LESS than 1 ppm And end water fluoridation overnight!
 the EPA has begun a process that will eventually a determine a new safe drinking water standard (MCL) or goal (MCLG) If EPA did this job honestly using routine assumptions and methods used in regulatory health risk assessments it would force a new MCLG LESS than 1 ppm. And end water fluoridation overnight!")
125
THE US EPA However on Jan 7, 2011 EPA spokesperson made it clear that they will be determining a new “safe” MCLG which would not interfere with the “benefits” of the water fluoridation program. In my view that would be impossible to do honestly (note my calculations on IQ lowering) It is also a violation of the Safe Drinking Water Act which it makes it clear that the MCLG should protect all the people from both known and reasonably anticipated health effects– any consideration of “supposed” benefits should not interfere with this determination
 It is also a violation of the Safe Drinking Water Act which it makes it clear that the MCLG should protect all the people from both known and reasonably anticipated health effects– any consideration of supposed benefits should not interfere with this determination.")
126
Extra slides

127
Sensitivity analysis for IQ risk assessment
If the Chinese children were drinking 0.5 liter, LOAEL for lowered IQ = 0.95 mg/day. Safe dose to protect whole population = mg/day. If the Chinese children were drinking 2 liters, lowered IQ at 3.8 mg/day. Safe dose to protect whole population = 0.38 mg/day (less than two glasses of water) If we reduced margin of safety to 5 (instead of 10) Safe dose = mg/day (equivalent to ml of water at 1 ppm a day)
 If we reduced margin of safety to 5 (instead of 10) Safe dose = mg/day (equivalent to ml of water at 1 ppm a day)")
128
Fluoride & the thyroid gland
European doctors (1930’s to 50’s) used sodium fluoride to reduce thyroid activity in patients with hyperthyroidism (over active thyroid gland). The doses used by Galletti and Joyet (1958) mg of fluoride per day - are currently exceeded by some people living in 1 ppm communities
 used sodium fluoride to reduce thyroid activity in patients with hyperthyroidism (over active thyroid gland). The doses used by Galletti and Joyet (1958) mg of fluoride per day - are currently exceeded by some people living in 1 ppm communities.")
129
Bachinskii 1985 2.3 ppm of fluoride in water
“was a risk factor of more rapid development of thyroid pathology.”

130
Lin et al., 1991 Lin et al. found that for mothers with borderline iodine exposure the IQ in their offspring was further lowered by drinking water at 0.9 ppm fluoride i.e. fluoride exposure makes low iodine intake worse

131
Fluoride levels in tea High concentrations of fluoride have been reported in the tea drinks of India, Tibet, and China: Gulati et al. 1993:1.55 – 3.21 mg/l Cao et al. 1996: – 4.32 mg/l Fung et al., 1999: 1.60 – 7.34 mg/l.

132
Fluoride levels in tea Gulati et al. 1993:1.55 – 3.21 mg/l
Cao et al. 1996: – 4.32 mg/l Fung et al., 1999: 1.60 – 7.34 mg/l. I liter = 8 cups or 4 mugs 8 cups of tea/day = 0.76 – 7.34 mg/day 16 cups of tea/day = mg/day A heavy tea drinker could damage their bones

133
Comparing US States

134
Percent 50 USA States and DC
National Survey of Children's Health. U.S. Department of Health and Human Services, Health Resources and Services Administration, Maternal and Child Health Bureau. The National Survey of Children's Health Rockville, Maryland: U.S. Department of Health and Human Services, 2005

135
Fluoride and the Pineal gland

136
Pineal Gland

137
Fluoride & Pineal Gland
TRYPTOPHAN Enzyme 1 Enzyme 2 SEROTONIN Enzyme 3 Enzyme 4 MELATONIN

Similar presentations