Download presentation
Presentation is loading. Please wait.

1
Graphing, Calculating, and Interpreting Rate of Improvement
Caitlin S. Flinn, Ed.S., N.C.S.P. Andrew E. McCrea, M.S., N.C.S.P. NASP Convention March 3, 2010

2
Objectives There needs to be a standardized procedure for calculating RoI We’re proposing a method using Simple Linear Regression

3
Overview Importance of RoI RoI Research A Need for Consistency
Calculating RoI Individual Student Graphs Programming Excel Decision Making Grounding the Data Interpreting Growth Individual Student Student Groups Considerations Resources

4
Importance of Graphs Vogel, Dickson, & Lehman, 1990
Speeches that included visuals, especially in color, improved: Immediate recall by 8.5% Delayed recall (3 days) by 10.1%
 by 10.1%")
5
Importance of Graphs “Seeing is believing.”
Useful for communicating large amounts of information quickly “A picture is worth a thousand words.” Transcends language barriers (Karwowski, 2006) Responsibility for accurate graphical representations of data
 Responsibility for accurate graphical representations of data.")
6
Skills Typically Graphed
Reading Oral Reading Fluency (ORF) Word Use Fluency (WUF) Reading Comprehension MAZE Retell Fluency Early Literacy Skills Initial Sound Fluency (ISF) Letter Naming Fluency (LNF) Letter Sound Fluency (LSF) Phoneme Segmentation Fluency (PSF) Nonsense Word Fluency (NWF) Spelling Written Expression Behavior Math Math Computation Math Facts Early Numeracy Oral Counting Missing Number Number Identification Quantity Discrimination
 Word Use Fluency (WUF) Reading Comprehension. MAZE. Retell Fluency. Early Literacy Skills. Initial Sound Fluency (ISF) Letter Naming Fluency (LNF) Letter Sound Fluency (LSF) Phoneme Segmentation Fluency (PSF) Nonsense Word Fluency (NWF) Spelling. Written Expression. Behavior. Math. Math Computation. Math Facts. Early Numeracy. Oral Counting. Missing Number. Number Identification. Quantity Discrimination.")
7
Importance of RoI Multi-tiered model Progress monitoring
Data for decision-making Goal setting (Shapiro, 2008)
")
8
Importance of RoI Visual inspection of slope Multiple interpretations
Instructional services Need for explicit guidelines

9
RoI Research Deno, 1985 Curriculum-based measurement
General outcome measures Short Standardized Repeatable Sensitive to change

10
RoI Research Fuchs & Fuchs, 1998
Hallmark components of Response to Intervention Ongoing formative assessment Identifying non-responding students Treatment fidelity of instruction Dual discrepancy model One standard deviation from typically performing peers in level and rate

11
RoI Research Ardoin & Christ, 2008 Slope for benchmarks (3x per year)
More growth from fall to winter than winter to spring Might be helpful to use RoI for fall to winter And a separate RoI for winter to spring

12
RoI Research Fuchs, Fuchs, Walz, & Germann, 1993 Example
Typical weekly growth rates Needed growth 1.5 to 2.0 times typical slope to close gap Example Bob is below benchmark on ORF Typical slope is 1 wcpm per week growth Bob would need slope of 1.5 to 2 to close gap in a reasonable amount of time

13
RoI Research Deno, Fuchs, Marston, & Shin, 2001
Slope of frequently non-responsive children approximated slope of children already identified as having a specific learning disability

14
RoI Research Algebraic term: Slope of a line
Vertical change over the horizontal change Rise over run m = (y2 - y1) / (x2 - x1) Describes the steepness of a line (Gall & Gall, 2007)
 / (x2 - x1) Describes the steepness of a line (Gall & Gall, 2007)")
15
RoI Research Finding a student’s RoI = finding the slope of a line
Using two data points on that line Finding the line itself Linear regression Ordinary Least Squares

16
RoI Research Gall & Gall, 2007
10 data points are a minimum requirement for a reliable trendline How does that affect the frequency of administering progress monitoring probes?

17
RoI Research Using RoI for instructional decisions is not a perfect process Research is currently looking to address sources of error: Christ, 2006 – standard error of measurement for slope Ardoin & Christ, 2009 – passage difficulty and variability Jenkin, Graff, & Miglioretti, 2009 – frequency of progress monitoring

18
RoI Research Questions yet to be empirically answered
What parameters of RoI indicate a lack of RtI? How does standard error of measurement play into using RoI for instructional decision making? How does RoI vary between standard protocol interventions? How does this apply to non-English speaking populations?

19
How is RoI Calculated? Which way is best?

20
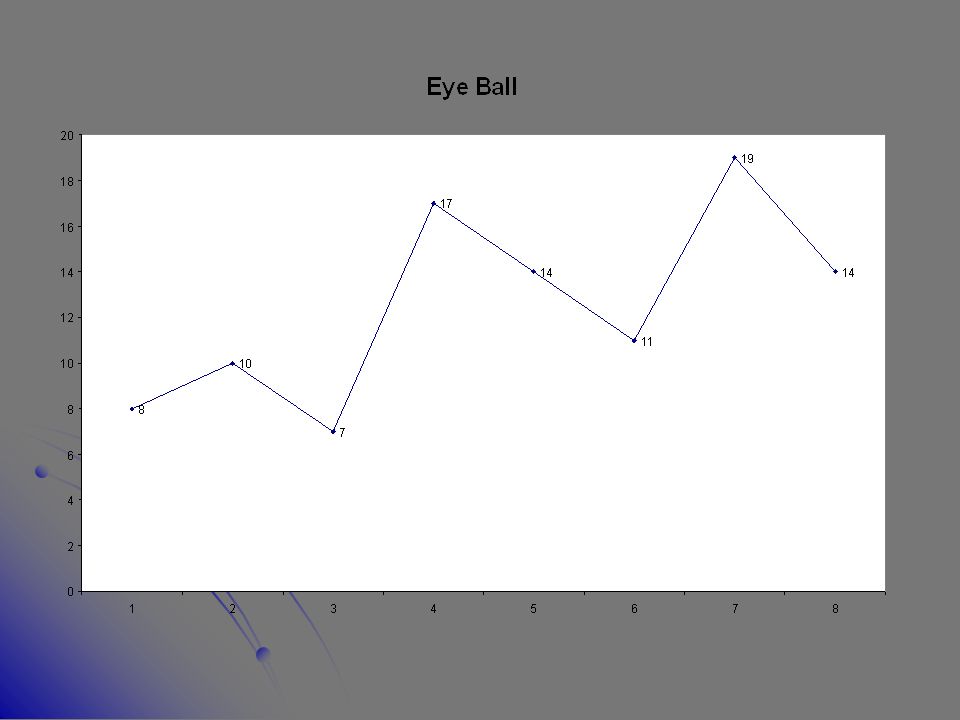
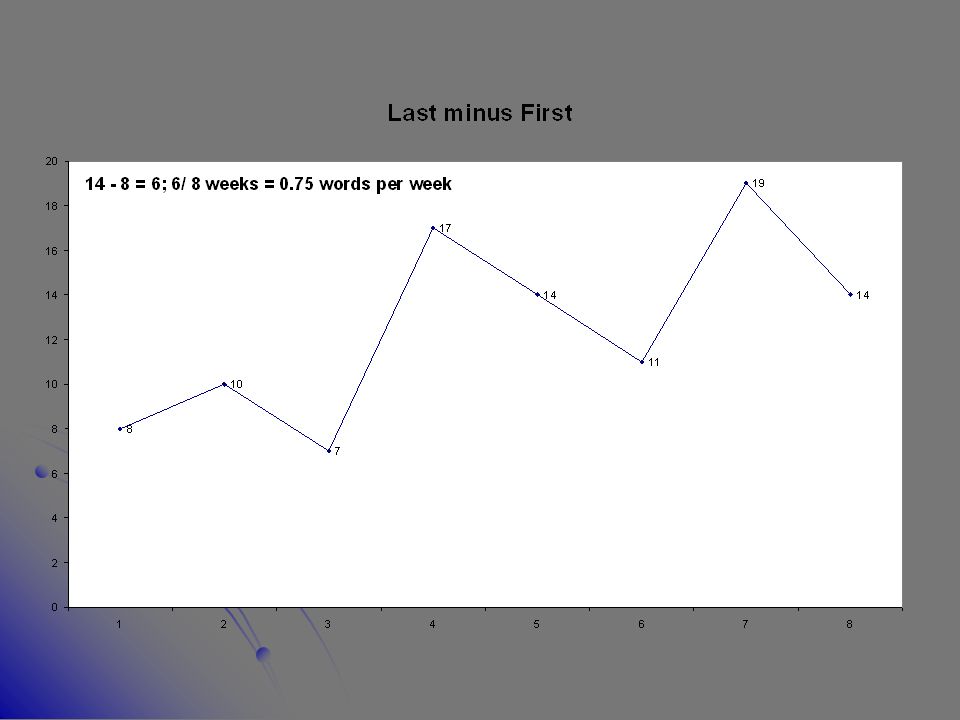
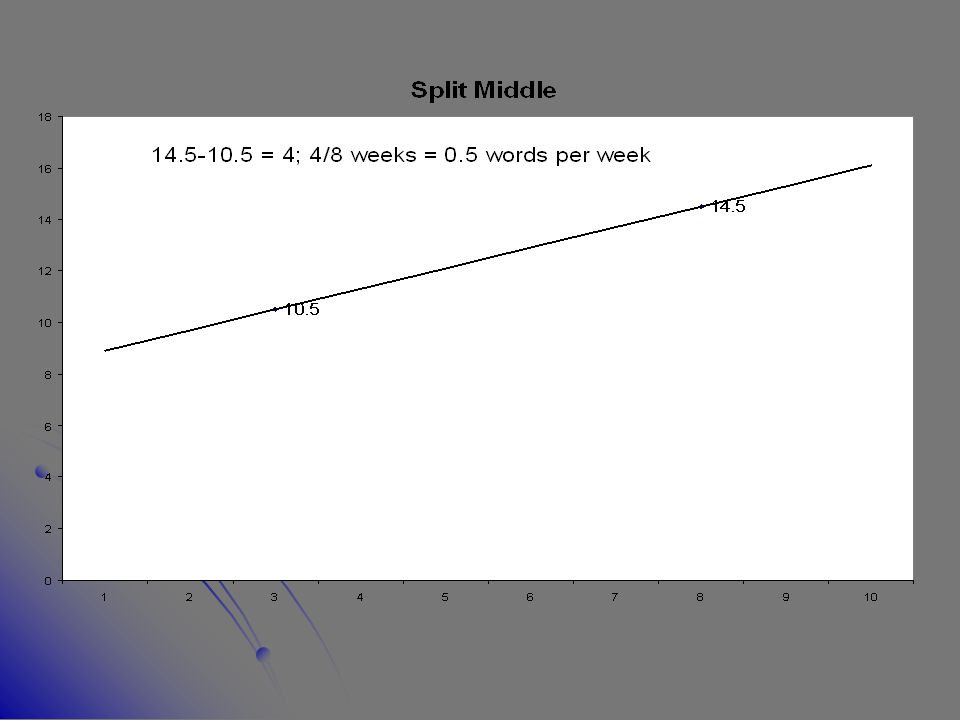
Multiple Methods for Calculating Growth
“Eye ball” Approach Last point minus First point Approach Split Middle Approach Linear Regression Approach

24
1.1 Words Per Week

25
RoI Consistency? Eye Ball ??? Last minus First 0.75 Split Middle* 0.50
Linear Regression 1.10

26
RoI Consistency? If we are not all using the same model to compute RoI, we continue to have the same problems as past models, where under one approach a student meets SLD criteria, but under a different approach, the student does not. Hypothetically, if the RoI cut-off was 0.65 or 0.95, different approaches would come to different conclusions on the same student.

27
Technical Adequacy Without a consensus on how to compute RoI, we risk falling short of having technical adequacy within our model.

28
So, Which RoI Method is Best?

29
Literature shows that Linear Regression is Best Practice
Student’s daily test scores…were entered into a computer program…The data analysis program generated slopes of improvement for each level using and Ordinary-Least Squares procedure (Hayes, 1973) and the line of best fit. This procedure has been demonstrated to represent CBM achievement data validly within individual treatment phases (Marston, 1988; Shinn, Good, & Stein, in press; Stein, 1987). Shinn, Gleason, & Tindal, 1989
 and the line of best fit. This procedure has been demonstrated to represent CBM achievement data validly within individual treatment phases (Marston, 1988; Shinn, Good, & Stein, in press; Stein, 1987). Shinn, Gleason, & Tindal,")
30
Growth (RoI) Research using Linear Regression
Christ, T. J. (2006). Short-term estimates of growth using curriculum based measurement of oral reading fluency: Estimating standard error of the slope to construct confidence intervals. School Psychology Review, 35, Deno, S. L., Fuchs, L. S., Marston, D., & Shin, J. (2001). Using curriculum based measurement to establish growth standards for students with learning disabilities. School Psychology Review, 30, Good, R. H. (1990). Forecasting accuracy of slope estimates for reading curriculum based measurement: Empirical evidence. Behavioral Assessment, 12, Fuchs, L. S., Fuchs, D., Hamlett, C. L., Walz, L. & Germann, G. (1993). Formative evaluation of academic progress: How much growth can we expect? School Psychology Review, 22,
. Short-term estimates of growth using curriculum based measurement of oral reading fluency: Estimating standard error of the slope to construct confidence intervals. School Psychology Review, 35, Deno, S. L., Fuchs, L. S., Marston, D., & Shin, J. (2001). Using curriculum based measurement to establish growth standards for students with learning disabilities. School Psychology Review, 30, Good, R. H. (1990). Forecasting accuracy of slope estimates for reading curriculum based measurement: Empirical evidence. Behavioral Assessment, 12, Fuchs, L. S., Fuchs, D., Hamlett, C. L., Walz, L. & Germann, G. (1993). Formative evaluation of academic progress: How much growth can we expect School Psychology Review, 22,")
31
Growth (RoI) Research using Linear Regression
Jenkins, J. R., Graff, J. J., & Miglioretti, D.L. (2009). Estimating reading growth using intermittent CBM progress monitoring. Exceptional Children, 75, Shinn, M. R., Gleason, M. M., & Tindal, G. (1989). Varying the difficulty of testing materials: Implications for curriculum-based measurement. The Journal of Special Education, 23, Shinn, M. R., Good, R. H., & Stein, S. (1989). Summarizing trend in student achievement: A comparison of methods. School Psychology Review, 18,
. Estimating reading growth using intermittent CBM progress monitoring. Exceptional Children, 75, Shinn, M. R., Gleason, M. M., & Tindal, G. (1989). Varying the difficulty of testing materials: Implications for curriculum-based measurement. The Journal of Special Education, 23, Shinn, M. R., Good, R. H., & Stein, S. (1989). Summarizing trend in student achievement: A comparison of methods. School Psychology Review, 18,")
32
So, Why Are There So Many Other RoI Models?
Ease of application How many of us want to calculate OLS Linear Regression formulas (or even remember how)?
")
33
An Easy and Applicable Solution

34
Or Kindly Look Over Your Neighbor’s Shoulder!
Get Out Your Laptops! Or Kindly Look Over Your Neighbor’s Shoulder! I love ROI

35
Open Microsoft Excel Microsoft Office 2003 for PCs
Microsoft Office for Macs

36
For Individual Students
Graphing RoI For Individual Students

37
Setting Up Your Spreadsheet
In cell B2, type School Week In cell C2, type Benchmark In cell D2, type WPM (or Student Scores)
")
38
Labeling School Weeks In cell B3, type 1 Continue entering numbers
through 36 in column B Week 36 will be in cell B38

39
Entering Benchmarks In cell C3, type the fall benchmark 77
In cell C20, type the winter benchmark 92 In cell C38, type the spring benchmark 110

40
Entering Student Data Points
Student data points are entered between cells D3 and D38. Type the student’s score next to the corresponding week that it was administered.

41
Entering Student Data Points
Week 1 – 41 Week 8 – 62 Week 9 – 63 Week 10 – 75 Week 11 – 64 Week 12 – 80 Week 13 – 83 Week

42
Entering Student Data Points
Week 15 – 56 Week 17 – 104 Week 18 – 74 Week 20 – 85 Week 21 – 89 Week 22 – 69 Week 23 – 85

43
Entering Student Data Points
Week 24 – 96 Week 25 – 90 Week 26 – 84 Week 27 – 106 Week 28 – 94 Week 32 – 100

44
*CAUTION* If a student was not assessed during a certain week, leave that cell blank Do not enter a score of Zero (0) it will be calculated into the trendline and interpreted as the student having read zero words correct per minute during that week.
 it will be calculated into the trendline and interpreted as the student having read zero words correct per minute during that week.")
45
Creating a Graph Highlight the data in Columns C and D Include cells
C2 and D2 through cells C38 and D38 Include any blank cells

46
Creating a Graph Excel 2003/Macs Excel 2007 Click Insert Click Chart
Find the icon for Line Click the arrow below Line

47
Creating a Graph Excel 2003/Macs Excel 2007
A Chart Wizard window will appear Excel 2007 6 graphics appear

48
Creating a Graph Excel 2003/Macs Excel 2007 Choose Line
Choose Line with markers Excel 2007 Choose Line with markers

49
Creating a Graph Excel 2003/Macs Excel 2007 Data Range tab Columns
Your graph appears

50
Creating a Graph Excel 2003/Macs Excel 2007 Chart Title
School Week (X Axis) WPM (Y Axis) Excel 2007 Change your labels by clicking on the graph
 WPM (Y Axis) Excel Change your labels by clicking on the graph.")
51
Creating a Graph Excel 2003/Macs Excel 2007
Choose where you want your graph Excel 2007 Your graph was automatically put into your data spreadsheet

52
Creating a Graph Excel 2003/Macs Excel 2007

53
Adding a Trendline Excel 2003/Macs Excel 2007
Right click on any of the student data points Excel 2007

54
Adding a Trendline Excel 2003/Macs Choose Linear Excel 2007

55
Adding a Trendline Excel 2003/Macs Excel 2007
Choose Custom and check box next to Display equation on chart Excel 2007

56
Adding a Trendline Clicking on the equation highlights a box around it
Clicking on the box allows you to move it to a place where you can see it better

57
Adding a Trendline You can repeat the same procedure to have a trendline for the benchmark data points Suggestion: label the trendline Expected ROI Move this equation under the first

58
Individual Student Graph

59
Individual Student Graph
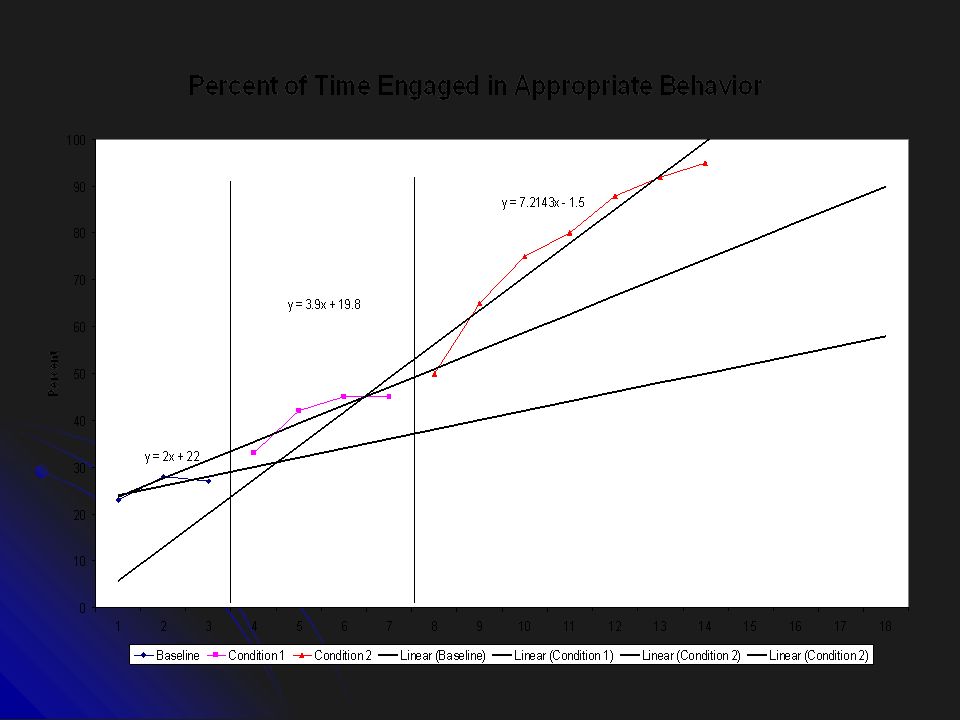
The equation indicates the slope, or rate of improvement. The number, or coefficient, before "x" is the average improvement, which in this case is the average number of words per minute per week gained by the student.

60
Individual Student Graph
The rate of improvement, or trendline, is calculated using a linear regression, a simple equation of least squares. To add additional progress monitoring/benchmark scores once you’ve already created a graph, enter additional scores in Column D in the corresponding school week.

61
Individual Student Graph
Remember to leave cells blank for the weeks that no score was obtained. The graph will incorporate that score into the set of data points and into the trendline.

62
Individual Student Graph
The slope can change depending on which week (where) you put the benchmark scores on your chart. Enter benchmark scores based on when your school administers their benchmark assessments for the most accurate depiction of expected student progress.
 you put the benchmark scores on your chart. Enter benchmark scores based on when your school administers their benchmark assessments for the most accurate depiction of expected student progress.")
63
Options for the Graph Resizing Coloring Data Labels

64
To Calculate RoI A Formula
Programming Excel To Calculate RoI A Formula

65
RoI Formula Type RoI in cell B39 below the last week of school

66
Calculate Expected Slope
Click on cell C39 Put your cursor at the top next to the fx Type =SLOPE(C3:C38,B3:B38) Hit Enter/Return
 Hit Enter/Return.")
67
Calculate Actual Slope
Click on cell D39 Put your cursor at the top next to the fx Type =SLOPE(D3:D38,B3:B38) Hit Enter/Return
 Hit Enter/Return.")
68
within a Problem-Solving Model
ROI as a Decision Tool within a Problem-Solving Model

69
Steps Gather the data Ground the data Interpret the data
Figure out how to fit Best Practice into Public Education

70
Universal Screening Progress Monitoring
Step 1: Gather Data Universal Screening Progress Monitoring

71
Common Screenings in PA
DIBELS AIMSweb MBSP 4Sight PSSA

72
Validated Progress Monitoring Tools
DIBELS AIMSweb MBSP

73
To what will we compare our student growth data?
Step 2: Ground the Data To what will we compare our student growth data?

74
Multiple Ways to Look at Growth
Needed Growth Expected Growth & Percent of Expected Growth Fuchs et. al. (1993) Table of Realistic and Ambitious Growth Growth Toward Individual Goal* *Best Practices in Setting Progress Monitoring Goals for Academic Skill Improvement (Shapiro, 2008)
 Table of Realistic and Ambitious Growth. Growth Toward Individual Goal* *Best Practices in Setting Progress Monitoring Goals for Academic Skill Improvement (Shapiro, 2008)")
75
Needed Growth Difference between student’s BOY (or MOY) score and benchmark score at MOY (or EOY). Example: MOY ORF = 10, EOY benchmark is 40, 18 weeks of instruction (40-10/18=1.67). Student must gain 1.67 wcpm per week to make EOY benchmark.
. Student must gain 1.67 wcpm per week to make EOY benchmark.")
76
Expected Growth Difference between two benchmarks.
Example: MOY benchmark is 20, EOY benchmark is 40, expected growth (40-20)/18 weeks of instruction = 1.11 wcpm per week.
/18 weeks of instruction = 1.11 wcpm per week.")
77
Looking at Percent of Expected Growth
Tier I Tier II Tier III Greater than 150% Between 110% & 150% Possible LD Between 95% & 110% Likely LD Between 80% & 95% May Need More Below 80% Needs More Tigard-Tualatin School District (

78
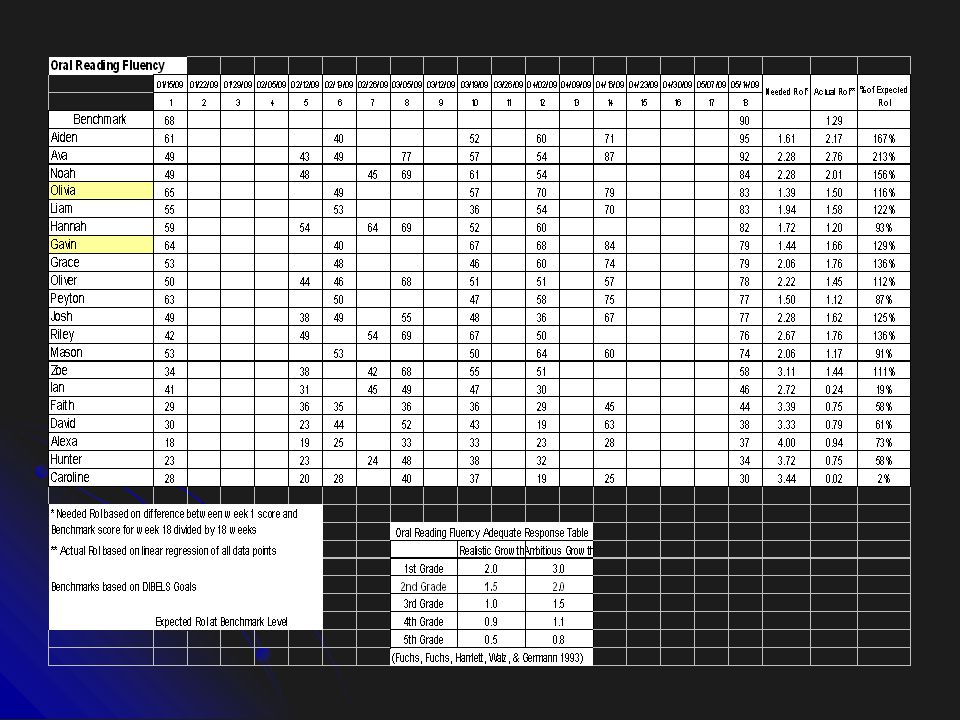
Oral Reading Fluency Adequate Response Table
Realistic Growth Ambitious Growth 1st 2.0 3.0 2nd 1.5 3rd 1.0 4th 0.9 1.1 5th 0.5 0.8 Fuchs, Fuchs, Hamlett, Walz, & Germann (1993)
")
79
Digit Fluency Adequate Response Table
Realistic Growth Ambitious Growth 1st 0.3 0.5 2nd 3rd 4th 0.75 1.2 5th Fuchs, Fuchs, Hamlett, Walz, & Germann (1993)
")
80
Making Decisions: Best Practice
Research has yet to establish a blue print for ‘grounding’ student RoI data. At this point, teams should consider multiple comparisons when planning and making decisions.

81
Making Decisions: Lessons From the Field
When tracking on grade level, consider an RoI that is 100% of expected growth as a minimum requirement, consider an RoI that is at or above the needed as optimal. So, 100% of expected and on par with needed become the limits of the range within a student should be achieving.

83
Step 3: Interpreting Growth

84
What do we do when we do not get the growth we want?
When to make a change in instruction and intervention? When to consider SLD?

85
When to make a change in instruction and intervention?
Enough data points (6 to 10)? Less than 100% of expected growth. Not on track to make benchmark (needed growth). Not on track to reach individual goal.
 Less than 100% of expected growth. Not on track to make benchmark (needed growth). Not on track to reach individual goal.")
86
When to consider SLD? Continued inadequate response despite:
Fidelity with Tier I instruction and Tier II/III intervention. Multiple attempts at intervention. Individualized Problem-Solving approach.

87
Three Levels of Examples
Whole Class Small Group Individual Student - Academic Data - Behavior Data

88
Whole Class Example

89
3rd Grade Math Whole Class
Who’s responding? Effective math instruction? Who needs more? N=19 4 > 100% growth 15 < 100% growth 9 w/ negative growth

90
Small Group Example

91
Intervention Group Intervention working for how many?
Can we assume fidelity of intervention based on results? Who needs more?

92
Individual Kid Example

93
Individual Kid Making growth? How much (65% of expected growth).
Atypical growth across the year (last 3 data points). Continue? Make a change? Need more data?
. Continue Make a change Need more data")
94
RoI and Behavior?

96
Step 4: Figure out how to fit Best Practice into Public Education

97
Things to Consider Who is At-Risk and needs progress monitoring?
Who will collect, score, enter the data? Who will monitor student growth, when, and how often? What changes should be made to instruction & intervention? What about monitoring off of grade level?

98
Who is At-Risk and needs progress monitoring?
Below level on universal screening Entering 4th Grade Example DORF (110) ISIP TRWM (55) 4Sight (1235) PSSA (1235) Student A 115 58 1255 1232 Student B 85 48 1216 1126 Student C 72 35 1056 1048
 ISIP TRWM (55) 4Sight (1235) PSSA (1235) Student A Student B Student C")
99
Who will collect, score, and enter the data?
Using MBSP for math, teachers can administer probes to whole class. DORF probes must be administered one-on-one, and creativity pays off (train and use art, music, library, etc. specialists). Schedule for progress monitoring math and reading every-other week.
. Schedule for progress monitoring math and reading every-other week.")
100
Week 1 Week 2 Reading Math 1st X 2nd 3rd 4th 5th

101
Who will monitor student growth, when, and how often?
Best Practices in Data-Analysis Teaming (Kovaleski & Pedersen, 2008) Chambersburg Area School District Elementary Response to Intervention Manual (McCrea et. al., 2008) Derry Township School District Response to Intervention Model (
 Chambersburg Area School District Elementary Response to Intervention Manual (McCrea et. al., 2008) Derry Township School District Response to Intervention Model (")
102
What changes should be made to instruction & intervention?
Ensure treatment fidelity!!!!!!!! Increase instructional time (active and engaged) Decrease group size Gather additional, diagnostic, information Change the intervention
 Decrease group size. Gather additional, diagnostic, information. Change the intervention.")
103
When Instructional Level is Not the Same as Grade Level
Understand needed and expected RoI within broader context: Needed growth will only get student to next level by next benchmark (as opposed to on level). 100% of expected growth may not be an acceptable minimum (not enough growth b/c level is so low).
. 100% of expected growth may not be an acceptable minimum (not enough growth b/c level is so low).")
104
Grounding RoI When Monitoring Off of Grade Level: Two Options
Best Practices in Setting Progress Monitoring Goals for Academic Skill Improvement (Shapiro, 2008). Tigard-Tualatin SD Chart: 150% instead of 100% as minimum RoI requirement???
. Tigard-Tualatin SD Chart: 150% instead of 100% as minimum RoI requirement")
105
Questions? & Comments!

106
Resources www.interventioncentral.com www.aimsweb.com
107
Resources www.fcrr.org Florida Center for Reading Research
What Works Clearinghouse National Center on RtI

108
Flinn & McCrea’s RoI Web Site
Download powerpoints, handouts, Excel graphs, charts, articles, etc. Caitlin Flinn Andrew McCrea

109
References Ardoin, S. P., & Christ, T. J. (2009). Curriculum-based measurement of oral reading: Standard errors associated with progress monitoring outcomes from DIBELS, AIMSweb, and an experimental passage set. School Psychology Review, 38(2), Ardoin, S. P. & Christ, T. J. (2008). Evaluating curriculum-based measurement slope estimates using triannual universal screenings. School Psychology Review, 37(1),
. Curriculum-based measurement of oral reading: Standard errors associated with progress monitoring outcomes from DIBELS, AIMSweb, and an experimental passage set. School Psychology Review, 38(2), Ardoin, S. P. & Christ, T. J. (2008). Evaluating curriculum-based measurement slope estimates using triannual universal screenings. School Psychology Review, 37(1),")
110
References Christ, T. J. (2006). Short-term estimates of growth using curriculum-based measurement of oral reading fluency: Estimating standard error of the slope to construct confidence intervals. School Psychology Review, 35(1), Deno, S. L. (1985). Curriculum-based measurement: The emerging alternative. Exceptional Children, 52,
. Short-term estimates of growth using curriculum-based measurement of oral reading fluency: Estimating standard error of the slope to construct confidence intervals. School Psychology Review, 35(1), Deno, S. L. (1985). Curriculum-based measurement: The emerging alternative. Exceptional Children, 52,")
111
References Deno, S. L., Fuchs, L.S., Marston, D., & Shin, J. (2001). Using curriculum-based measurement to establish growth standards for students with learning disabilities. School Psychology Review, 30, Flinn, C. S. (2008). Graphing rate of improvement for individual students. InSight, 28(3),
. Using curriculum-based measurement to establish growth standards for students with learning disabilities. School Psychology Review, 30, Flinn, C. S. (2008). Graphing rate of improvement for individual students. InSight, 28(3),")
112
References Fuchs, L. S., & Fuchs, D. (1998). Treatment validity: A unifying concept for reconceptualizing the identification of learning disabilities. Learning Disabilities Research and Practice, 13, Fuchs, L. S., Fuchs, D., Hamlett, C. L., Walz, L., & Germann, G. (1993). Formative evaluation of academic progress: How much growth can we expect? School Psychology Review, 22,
. Treatment validity: A unifying concept for reconceptualizing the identification of learning disabilities. Learning Disabilities Research and Practice, 13, Fuchs, L. S., Fuchs, D., Hamlett, C. L., Walz, L., & Germann, G. (1993). Formative evaluation of academic progress: How much growth can we expect School Psychology Review, 22,")
113
References Gall, M.D., & Gall, J.P. (2007). Educational research: An introduction (8th ed.). New York: Pearson. Jenkins, J. R., Graff, J. J., & Miglioretti, D.L. (2009). Estimating reading growth using intermittent CBM progress monitoring. Exceptional Children, 75,
. Estimating reading growth using intermittent CBM progress monitoring. Exceptional Children, 75,")
114
References Karwowski, W. (2006). International encyclopedia of ergonomics and human factors. Boca Raton, FL: Taylor & Francis Group, LLC. Shapiro, E. S. (2008). Best practices in setting progress monitoring goals for academic skill improvement. In A. Thomas and J. Grimes (Eds.), Best practices in school psychology V (Vol. 2, pp ). Bethesda, MD: National Association of School Psychologists.
. Best practices in setting progress monitoring goals for academic skill improvement. In A. Thomas and J. Grimes (Eds.), Best practices in school psychology V (Vol. 2, pp ). Bethesda, MD: National Association of School Psychologists.")
115
References Vogel, D. R., Dickson, G. W., & Lehman, J. A. (1990). Persuasion and the role of visual presentation support. The UM/3M study. In M. Antonoff (Ed.), Presentations that persuade. Personal Computing, 14.
. Persuasion and the role of visual presentation support. The UM/3M study. In M. Antonoff (Ed.), Presentations that persuade. Personal Computing, 14.")
Similar presentations
 for Alaska Schools: Scaling Practices to Meet Local Needs Rachel Brown-Chidsey, Ph.D. University of Southern.>")


 High Growth, High Achieving Schools: Is It Possible? Fall, 2011 PVAAS Webinar.>")


