Download presentation
Presentation is loading. Please wait.

1
Morbidity and Mortality in People with Serious Mental Illness
National Association of State Mental Health Program Directors Medical Directors Council July 2006

2
Overview- THE PROBLEM Increased Morbidity and Mortality Associated with Serious Mental Illness (SMI) Increased Morbidity and Mortality Largely Due to Preventable Medical Conditions Metabolic Disorders, Cardiovascular Disease, Diabetes Mellitus High Prevalence of Modifiable Risk Factors (Obesity, Smoking) Epidemics within Epidemics (e.g., Diabetes, Obesity) Some Psychiatric Medications Contribute to Risk Established Monitoring and Treatment Guidelines to Lower Risk Are Underutilized in SMI Populations
 Epidemics within Epidemics (e.g., Diabetes, Obesity) Some Psychiatric Medications Contribute to Risk. Established Monitoring and Treatment Guidelines to Lower Risk Are Underutilized in SMI Populations.")
3
Overview - PROPOSED SOLUTIONS
Prioritize the Public Health Problem Target Providers, Families and Clients Focus on Prevention and Wellness Track Morbidity and Mortality in Public Mental Health Populations Implement Established Standards of Care Prevention, Screening and Treatment Improve Access to and Integration of Physical Health and Mental Health Care

4
Why Should we be Concerned About Morbidity and Mortality?
Recent data from several states have found that people with serious mental illness served by our public mental health systems die, on average, at least 25 years earlier that the general population.

5
Increased Mortality From Medical Causes in Mental Illness
Increased risk of death from medical causes in schizophrenia and 20% (10-15 yrs) shorter lifespan1 Bipolar and unipolar affective disorders also associated with higher SMRs from medical causes2 1.9 males/2.1 females in bipolar disorder 1.5 males/1.6 females in unipolar disorder Cardiovascular mortality in schizophrenia increased from , with greatest increase in SMRs in men from SMR = standardized mortality ratio (observed/expected deaths). Harris et al. Br J Psychiatry. 1998;173:11. Newman SC, Bland RC. Can J Psych. 1991;36: 2. Osby et al. Arch Gen Psychiatry. 2001;58: 3. Osby et al. BMJ. 2000;321:
 shorter lifespan1. Bipolar and unipolar affective disorders also associated with higher SMRs from medical causes males/2.1 females in bipolar disorder. 1.5 males/1.6 females in unipolar disorder. Cardiovascular mortality in schizophrenia increased from , with greatest increase in SMRs in men from SMR = standardized mortality ratio (observed/expected deaths). Harris et al. Br J Psychiatry. 1998;173:11. Newman SC, Bland RC. Can J Psych. 1991;36: Osby et al. Arch Gen Psychiatry. 2001;58: Osby et al. BMJ. 2000;321:")
6
Recent Multi-State Study Mortality Data: Years of Potential Life Lost
Compared to the general population, persons with major mental illness typically lose more than 25 years of normal life span Colton CW, Manderscheid RW. Prev Chronic Dis [serial online] 2006 Apr [date cited]. Available from: URL:

7
Ohio Study-1998-2002 Mean Years of Potential Life lost 20,018 persons discharged, 608 deaths

8
Massachusetts Study: Deaths from Heart Disease by Age Group/DMH Enrollees with SMI Compared to Massachusetts 2.2RR 1.5RR 4.9RR 3.5 RR

9
Maine Study Results: Comparison of Health Disorders Between SMI & Non-SMI Groups

10
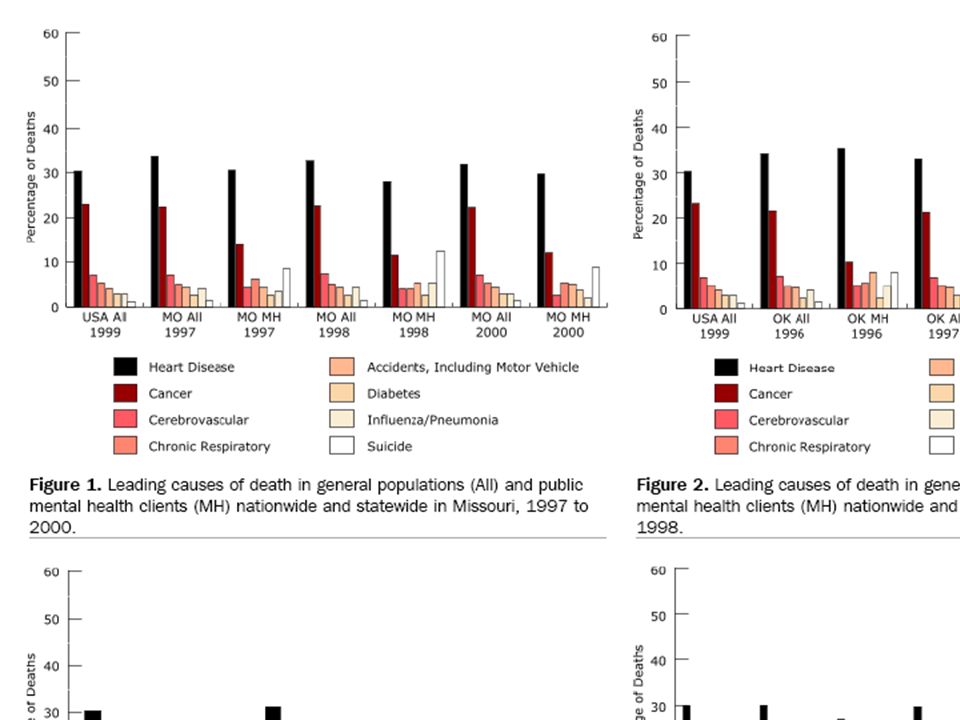
Ohio Study Leading Causes of Death

11
Ohio Study Standardized Mortality Ratios

12
What are the Causes of Morbidity and Mortality in People with Serious Mental Illness?
While suicide and injury account for about 30-40% of excess mortality, about 60% of premature deaths in persons with schizophrenia are due to “natural causes” Cardiovascular disease Diabetes Respiratory diseases Infectious diseases

13
Need slide (see next) from CDC paper indicating CVD as leading cause of death…this should be simple and direct
 from CDC paper indicating CVD as leading cause of death…this should be simple and direct")
15
Schizophrenia: Natural Causes of Death
Higher standardized mortality rates than the general population from: Diabetes x Cardiovascular disease 2.3x Respiratory disease 3.2x Infectious diseases 3.4x Cardiovascular disease associated with the largest number of deaths 2.3 X the largest cause of death in the general population Osby U et al. Schizophr Res. 2000;45:21-28.

16
Cardiovascular risk factors – overview
The Framingham Study 2 4 6 8 10 12 14 HTN DM Smoking BMI >27 TC >220 Single Risk Factors Multiple Risk Factors Odds ratios Smoking + BMI + TC >220 3 + DM + DM + HTN 5 This slide illustrates the cumulative effect of risk factors and illustrates that risk factors are more than additive; the total risk is higher than just the sum of the individual risk factors. Monitoring of a USA population cohort in the town of Framingham, Massachusetts, USA, for the period of 12 years led to the identification of the major CVD risk factors, including high blood pressure, high total blood cholesterol, smoking, obesity and diabetes. Odds ratio for each of these risk factors alone ranges from around 1.2 to 2.2. When more than one factor is present, odds ratios are increased by more than an additive rate, so that all five (BMI>27, smoking, high total cholesterol, diabetes and hypertension) led to an approximate 7-fold increased risk compared to any one risk factor alone. 1. Wilson PWF, D’Agostino RB, Levy D, Belanger AM, Silbershatz H, Kannel WB. Prediction of coronary heart disease using risk factor categories. Circulation. May 1998;97:1837–1847 BMI = body mass index; TC = total cholesterol; DM = diabetes mellitus; HTN = hypertension. Wilson PWF et al. Circulation. 1998;97:1837–1847.
 led to an approximate 7-fold increased risk compared to any one risk factor alone. 1. Wilson PWF, D’Agostino RB, Levy D, Belanger AM, Silbershatz H, Kannel WB. Prediction of coronary heart disease using risk factor categories. Circulation. May 1998;97:1837–1847. BMI = body mass index; TC = total cholesterol; DM = diabetes mellitus; HTN = hypertension. Wilson PWF et al. Circulation. 1998;97:1837–1847.")
17
Cardiovascular Disease (CVD) Risk Factors
Modifiable Risk Factors Estimated Prevalence and Relative Risk (RR) Schizophrenia Bipolar Disorder Obesity 45–55%, 1.5-2X RR1 26%5 Smoking 50–80%, 2-3X RR2 55%6 Diabetes 10–14%, 2X RR3 10%7 Hypertension ≥18%4 15%5 Dyslipidemia Up to 5X RR8 Key Points: There is growing evidence that patients with major mental disorders (on this slide, schizophrenia is shown as an example) have a higher prevalence of key cardiovascular risk factors; this may explain the observation of higher rates of cardiovascular disease in mental health populations 1. Davidson S, et al. Aust N Z J Psychiatry. 2001;35: Allison DB, et al. J Clin Psychiatry. 1999; 60: Dixon L, et al. J Nerv Ment Dis. 1999;187: Herran A, et al. Schizophr Res. 2000;41: MeElroy SL, et al. J Clin Psychiatry. 2002;63: Ucok A, et al. Psychiatry Clin Neurosci. 2004;58: Cassidy F, et al. Am J Psychiatry. 1999;156: Allebeck. Schizophr Bull. 1999;15(1)81-89.
 Schizophrenia. Bipolar Disorder. Obesity. 45–55%, 1.5-2X RR1. 26%5. Smoking. 50–80%, 2-3X RR2. 55%6. Diabetes. 10–14%, 2X RR3. 10%7. Hypertension. ≥18%4. 15%5. Dyslipidemia. Up to 5X RR8. Key Points: There is growing evidence that patients with major mental disorders (on this slide, schizophrenia is shown as an example) have a higher prevalence of key cardiovascular risk factors; this may explain the observation of higher rates of cardiovascular disease in mental health populations. 1. Davidson S, et al. Aust N Z J Psychiatry. 2001;35: Allison DB, et al. J Clin Psychiatry. 1999; 60: Dixon L, et al. J Nerv Ment Dis. 1999;187: Herran A, et al. Schizophr Res. 2000;41: MeElroy SL, et al. J Clin Psychiatry. 2002;63: Ucok A, et al. Psychiatry Clin Neurosci. 2004;58: Cassidy F, et al. Am J Psychiatry. 1999;156: Allebeck. Schizophr Bull. 1999;15(1)")
18
BMI Distributions for General Population and Those With Schizophrenia (1989)
30 Under- weight Acceptable Overweight Obese 20 Percent 10 < 18.5 20-22 22-24 24-26 26-28 28-30 30-32 32-34 > 34 BMI Range No schizophrenia Schizophrenia Allison DB et al. J Clin Psychiatry. 1999;60:

19
Mental Disorders and Smoking
Higher prevalence (56-88% for patients with schizophrenia) of cigarette smoking (overall U.S. prevalence 25%) More toxic exposure for patients who smoke (more cigarettes, larger portion consumed) Smoking is associated with increased insulin resistance Similar prevalence in bipolar disorder Medical Illness and Schizophrenia (62106) by Jonathan M. Meyer (Editor), Henry A. Nasrallah (Editor) Paperback: 256 pages ; Dimensions (in inches): 0.50 x 9.00 x 6.00 Publisher: Amer Psychiatric Pr; 1st edition (May 2003) ISBN: George TP et al. Nicotine and tobacco use in schizophrenia. In: Meyer JM, Nasrallah HA, eds. Medical Illness and Schizophrenia. American Psychiatric Publishing, Inc. 2003; Ziedonis D, Williams JM, Smelson D. Am J Med Sci. 2003(Oct);326(4):
 of cigarette smoking (overall U.S. prevalence 25%) More toxic exposure for patients who smoke (more cigarettes, larger portion consumed) Smoking is associated with increased insulin resistance. Similar prevalence in bipolar disorder. Medical Illness and Schizophrenia (62106) by Jonathan M. Meyer (Editor), Henry A. Nasrallah (Editor) Paperback: 256 pages ; Dimensions (in inches): 0.50 x 9.00 x Publisher: Amer Psychiatric Pr; 1st edition (May 2003) ISBN: George TP et al. Nicotine and tobacco use in schizophrenia. In: Meyer JM, Nasrallah HA, eds. Medical Illness and Schizophrenia. American Psychiatric Publishing, Inc. 2003; Ziedonis D, Williams JM, Smelson D. Am J Med Sci. 2003(Oct);326(4):")
20
Prevalence of Diagnosed Diabetes in General Population Versus Schizophrenic Population
Percent of population Comparison of data from Harris et al of prevalence of diagnosed diabetes in the general population, and data from Mukherjee on prevalence of diabetes in a schizophrenic population. Note that the data from these two studies were not broken down according to the same age categories, so the comparisons are approximate. Harris MI, Flegal KM, Cowie CC, et al. Prevalence of diabetes, impaired fasting glucose, and impaired glucose tolerance in U.S. adults. The Third National Health and Nutrition Examination Survey, Diabetes Care. 1998;21: Mukherjee et al Compr Psychiatry (1):68-73 Schizophrenic: General: 50-59 y 60-74 y 75+ y Harris et al. Diabetes Care. 1998; 21:518. Mukherjee et al. Compr Psychiatry. 1996; 37(1):68-73.
: Schizophrenic: General: y y. 75+ y. Harris et al. Diabetes Care. 1998; 21:518. Mukherjee et al. Compr Psychiatry. 1996; 37(1):")
21
Hypothesized Reasons Why There May Be More Type 2 Diabetes in People With Schizophrenia
Genetic link between schizophrenia and diabetes Impact of lifestyle Medication effect increasing insulin resistance by impacting insulin receptor or postreceptor function Drug effect on caloric intake or expenditure (obesity, activity) Slide 53: Current Treatment Paradigm The current treatment paradigm for type 2 diabetes consists of a stepwise approach with diet followed by a single oral agent, a second oral agent, and eventually insulin. Data from NHANES III indicate that the majority of patients with type 2 diabetes are poorly controlled by this approach. Failure of monotherapy results from the progressive nature of the disease and because a single drug does not address the defects in insulin secretion, hepatic glucose production, and peripheral insulin resistance that characterize type 2 diabetes. Furthermore, by waiting for failure before changing therapy, glucose toxicity may develop before the therapy is adjusted and impair the treatment response. Harris MI, Eastman RC, Cowie CC, et al. Racial and ethnic differences in glycemic control of adults with type 2 diabetes. Diabetes Care. 1999;22: Harris MI, Flegal KM, Cowie CC, et al. Prevalence of diabetes, impaired fasting glucose, and impaired glucose tolerance in U.S. adults. The Third National Health and Nutrition Examination Survey, Diabetes Care. 1998;21:
 Slide 53: Current Treatment Paradigm. The current treatment paradigm for type 2 diabetes consists of a stepwise approach with diet followed by a single oral agent, a second oral agent, and eventually insulin. Data from NHANES III indicate that the majority of patients with type 2 diabetes are poorly controlled by this approach. Failure of monotherapy results from the progressive nature of the disease and because a single drug does not address the defects in insulin secretion, hepatic glucose production, and peripheral insulin resistance that characterize type 2 diabetes. Furthermore, by waiting for failure before changing therapy, glucose toxicity may develop before the therapy is adjusted and impair the treatment response. Harris MI, Eastman RC, Cowie CC, et al. Racial and ethnic differences in glycemic control of adults with type 2 diabetes. Diabetes Care. 1999;22: Harris MI, Flegal KM, Cowie CC, et al. Prevalence of diabetes, impaired fasting glucose, and impaired glucose tolerance in U.S. adults. The Third National Health and Nutrition Examination Survey, Diabetes Care. 1998;21:")
22
How Does This Relate to What is Happening in the General Population?
There is an “epidemic” of obesity and diabetes, increasing risk of multiple medical conditions and cardiovascular disease. Obesity Diabetes Metabolic Syndrome Cardiovascular Disease

23
Diabetes and Obesity: The Continuing Epidemic
Mean body weight Prevalence (%) kg The Behavioral Risk Factor Surveillance System (BRFSS) is a cross-sectional random-digit telephone survey conducted by the CDC and state health departments. In 2000, 184,450 adults (age 18 years and older) were surveyed. According to the BRFSS data, the prevalence of diabetes increased by 49% in the period from 1990 through 2000, from 4.9%-7.3%. During the same period, the average self-reported weight increased from kg. The prevalence of obesity (BMI >30 kg/m2, calculated from self-reported weight and height) increased from 12% in 1991 to 19.8% in 2000. BMI is one of the strongest predictors of diabetes. In a national sample of adults, every 1-kg increase in measured weight was associated with a 4.5% increase in risk for diabetes. According to analyses from BRFSS, in which weight was self-reported, every 1-kg increase in average weight is associated with a 9% increase in the prevalence of diabetes. Both diabetes and obesity are preventable through improved diet and increased physical activity. Despite proven benefits of weight loss and previous appeals to physicians to become more involved in weight counseling, only 43% of obese adults were advised to lose weight during regular checkups. In 2000, most BRFSS participants (74%) were trying to lose or maintain weight. However, only 17.5% of those were following the recommendations to eat fewer calories and increase physical activity. The prevalence of obesity and diabetes has been increasing over the past decade despite calls to action. Weight loss, increased activity, and healthy eating can prevent onset of diabetes, but seem to be difficult to achieve in general population. More aggressive public education or alternative approaches are needed to stem the epidemic of diabetes. Mokdad AH, Ford ES, Bowman BA, et al. Diabetes trends in the U.S.: Diabetes Care. 2000;23: Mokdad AH, Serdula MK, Dietz WH, et al. The spread of the obesity epidemic in the United States, JAMA. 1999;282: Mokdad AH, Bowman BA, Ford ES, et al. The continuing epidemics of obesity and diabetes in the United States. JAMA. 2001;286: Prevalence of obesity, increased by 61% since More than 50% of US adults are overweight Only 43% of obese persons advised to lose weight during checkups BMI and weight gain major risk factors for diabetes Year Mokdad et al. Diabetes Care. 2000;23:1278. Mokdad et al. JAMA. 1999;282:1519. Mokdad et al. JAMA. 2001;286:1195.
 kg. The Behavioral Risk Factor Surveillance System (BRFSS) is a cross-sectional random-digit telephone survey conducted by the CDC and state health departments. In 2000, 184,450 adults (age 18 years and older) were surveyed. According to the BRFSS data, the prevalence of diabetes increased by 49% in the period from 1990 through 2000, from 4.9%-7.3%. During the same period, the average self-reported weight increased from kg. The prevalence of obesity (BMI >30 kg/m2, calculated from self-reported weight and height) increased from 12% in 1991 to 19.8% in BMI is one of the strongest predictors of diabetes. In a national sample of adults, every 1-kg increase in measured weight was associated with a 4.5% increase in risk for diabetes. According to analyses from BRFSS, in which weight was self-reported, every 1-kg increase in average weight is associated with a 9% increase in the prevalence of diabetes. Both diabetes and obesity are preventable through improved diet and increased physical activity. Despite proven benefits of weight loss and previous appeals to physicians to become more involved in weight counseling, only 43% of obese adults were advised to lose weight during regular checkups. In 2000, most BRFSS participants (74%) were trying to lose or maintain weight. However, only 17.5% of those were following the recommendations to eat fewer calories and increase physical activity. The prevalence of obesity and diabetes has been increasing over the past decade despite calls to action. Weight loss, increased activity, and healthy eating can prevent onset of diabetes, but seem to be difficult to achieve in general population. More aggressive public education or alternative approaches are needed to stem the epidemic of diabetes. Mokdad AH, Ford ES, Bowman BA, et al. Diabetes trends in the U.S.: Diabetes Care. 2000;23: Mokdad AH, Serdula MK, Dietz WH, et al. The spread of the obesity epidemic in the United States, JAMA. 1999;282: Mokdad AH, Bowman BA, Ford ES, et al. The continuing epidemics of obesity and diabetes in the United States. JAMA. 2001;286: Prevalence of obesity, increased by 61% since More than 50% of US adults are overweight. Only 43% of obese persons advised to lose weight during checkups. BMI and weight gain major risk factors for diabetes. Year. Mokdad et al. Diabetes Care. 2000;23:1278. Mokdad et al. JAMA. 1999;282:1519. Mokdad et al. JAMA. 2001;286:1195.")
24
Obesity Trends* Among US Adults BRFSS, 1991, 1996, 2003
(*BMI 30, or about 30 lbs overweight for 5’4” person) 1991 1996 2003 Obesity Trends Among US Adults. BRFSS, 1991, 1996, 2003. During the past 20 years there has been a dramatic increase in obesity in the United States. In 1991, four states had obesity prevalence rates of percent and no states had rates at or above 20 percent. In 2003, 15 states had prevalence rates of percent; 31 states had rates of percent; and 4 states had rates more than 25 percent. Reference Behavioral Risk Factor Surveillance System, CDC. Available at: Accessed January 25, 2005. No Data <10% 10%-14% 15%-19% 20%-24% 25% Behavioral Risk Factor Surveillance System, CDC.
 Obesity Trends Among US Adults. BRFSS, 1991, 1996, During the past 20 years there has been a dramatic increase in obesity in the United States. In 1991, four states had obesity prevalence rates of percent and no states had rates at or above 20 percent. In 2003, 15 states had prevalence rates of percent; 31 states had rates of percent; and 4 states had rates more than 25 percent. Reference. Behavioral Risk Factor Surveillance System, CDC. Available at: Accessed January 25, No Data. <10% 10%-14% 15%-19% 20%-24% 25% Behavioral Risk Factor Surveillance System, CDC.")
25
Diabetes and Gestational Diabetes Trends: US Adults, BRFSS 1990
The next few slides show graphically how dramatically the incidence of diabetes has risen over the last decade. These can be flipped through rather rapidly to show the changing of the map over the 10-year period. This is 1990—the majority of the country reported rates below 6%. In these slides, white areas are states that did not report data to the BRFSS. Light blue is rate less than 4%--11 states Medium blue is 4 to 6%--looks like about half the country Red is above 6%; which in 1990 is 4 states only Data are from the CDC and the Behavioral Risk Factors Surveillance System No Data Less than 4% % to 6% Above 6% Mokdad et al. Diabetes Care. 2000;23:

26
Diabetes and Gestational Diabetes Trends:
US Adults, BRFSS 1995 Only two years later, 12 states reported rates above 6% and only 5 states reported rates less than 4%. No Data Less than 4% % to 6% Above 6% Mokdad et al. Diabetes Care. 2000;23:

27
Diabetes and Gestational Diabetes Trends:
US Adults, BRFSS 1999 In 1999, the entire country is above 4%, with increasing numbers of states reporting rates above 5%, and, finally… No Data Less than 4% % to 6% Above 6% Mokdad et al. Diabetes Care. 2001;24:412.

28
Diabetes and Gestational Diabetes Trends:
US Adults, BRFSS 2000 In 2000, the last year that figures are available from the CDC, as you can see, nearly the entire country is red. And predictions are not good. As you can see on the next slide… No Data Less than 4% % to 6% Above 6% Mokdad et al. JAMA. 2001;286(10).
.")
29
Diabetes and Gestational Diabetes Trends:
US Adults, Estimate for 2010 By 2010, more than 10% of the US population will have diabetes. No Data Less than 4% % to 6% Above 6% Above 10%

30
US Diabetes Prevalence by Ethnic Group
Men and Women, Age Years 50 40 30 % with diabetes 20 10 The prevalence of diabetes varies among different ethnic groups in the United States. It is lowest in whites and occurs at higher rates in African Americans, Hispanics, and Native Americans such as Pima Indians. Harris MI, Hadden WC, Knowler WC, et al. Prevalence of diabetes and impaired glucose tolerance and plasma glucose levels in U.S. population aged yr. Diabetes. 1987;36: Flegal KM, Ezzati TM, Harris MI, et al. Prevalence of diabetes in Mexican Americans, Cubans, and Puerto Ricans from the Hispanic Health and Nutrition Examination Survey, Diabetes Care. 1991;14(suppl 3): Knowler WC, Saad MF, Pettitt DJ, et al. Determinants of diabetes mellitus in the Pima Indians. Diabetes Care. 1993;16(suppl 1): Fujimoto WY, Leonetti DL, Bergstrom RW, et al. Glucose intolerance and diabetic complications among Japanese-American women. Diabetes Res Clin Pract. 1991;13: Fujimoto WY, Leonetti DL, Kinyoun JL, et al. Prevalence of diabetes mellitus and impaired glucose tolerance among second-generation Japanese-American men. Diabetes. 1987;36: European Cuban American Japanese American African American Mexican American Puerto Rican Pima Harris et al. Diabetes. 1987;36:523. Flegal et al. Diabetes Care. 1991;14(suppl 3):628. Knowler et al. Diabetes Care. 1993;16(suppl 1):216. Fujimoto et al. Diabetes Res Clin Pract. 1991;13:119. Fujimoto et al. Diabetes. 1987;36:721.
: Knowler WC, Saad MF, Pettitt DJ, et al. Determinants of diabetes mellitus in the Pima Indians. Diabetes Care. 1993;16(suppl 1): Fujimoto WY, Leonetti DL, Bergstrom RW, et al. Glucose intolerance and diabetic complications among Japanese-American women. Diabetes Res Clin Pract. 1991;13: Fujimoto WY, Leonetti DL, Kinyoun JL, et al. Prevalence of diabetes mellitus and impaired glucose tolerance among second-generation Japanese-American men. Diabetes. 1987;36: European. Cuban. American. Japanese. American. African. American. Mexican. American. Puerto. Rican. Pima. Harris et al. Diabetes. 1987;36:523. Flegal et al. Diabetes Care. 1991;14(suppl 3):628. Knowler et al. Diabetes Care. 1993;16(suppl 1):216. Fujimoto et al. Diabetes Res Clin Pract. 1991;13:119. Fujimoto et al. Diabetes. 1987;36:721.")
31
Natural History of Type 2 Diabetes
Uncontrolled Obesity IGT Diabetes Hyperglycemia Post-Meal Glucose Plasma Glucose Fasting Glucose 126 (mg/dL) Relative -Cell Function Insulin Resistance 100 (%) Insulin Level -20 -10 10 20 30 Years of Diabetes IGT = impaired glucose tolerance. Adapted from: International Diabetes Center (IDC). Available at: Accessed March 26, 2006.
 Relative -Cell Function. Insulin Resistance. 100 (%) Insulin Level Years of Diabetes. IGT = impaired glucose tolerance. Adapted from: International Diabetes Center (IDC). Available at: Accessed March 26,")
32
Prevalence of Diabetic Tissue Damage at Diagnosis of Type 2 Diabetes
Dagogo-Jack et al. Arch Int Med. 1997;157:

33
Diabetes is a CVD Risk Equivalent to Previous Myocardial Infarction
45.0% Equivalent MI Risk Levels Fatal or nonfatal MI (%) 20.2% 18.6% 3.5% No Prior MI Prior MI No Prior MI Prior MI Nondiabetic Subjects Type 2 Diabetic Subjects (n = 1373) (n = 1059) Haffner SM et al. N Engl J Med. 1998;339:
 20.2% 18.6% 3.5% No Prior MI Prior MI No Prior MI Prior MI. Nondiabetic Subjects Type 2 Diabetic Subjects (n = 1373) (n = 1059) Haffner SM et al. N Engl J Med. 1998;339:")
34
ADA Cardiometabolic Risk Initiative

35
Identification of the Metabolic Syndrome
≥3 Risk Factors Required for Diagnosis Risk Factor Defining Level Abdominal obesity Men Women Waist circumference >40 in (>102 cm) >35 in (>88 cm) Triglycerides 150 mg/dL (1.69mmol/L) HDL cholesterol Men Women <40 mg/dL (1.03mmol/L) <50 mg/dL (1.29mmol/L) Blood pressure 130/85 mm Hg Fasting blood glucose 110 mg/dL (6.1mmol/L) Identification of the Metabolic Syndrome This slide presents the ATPIII Adult Treatment Panel definition of the metabolic syndrome. Three or more of the criteria listed are required for a diagnosis of metabolic syndrome. References National Cholesterol Education Program (NCEP) III. Third Report of the National Cholesterol Education Program (NCEP) Expert Panel on Detection, Evaluation, and Treatment of High Blood Cholesterol in Adults (Adult Treatment Panel III) Final Report. Circulation. 2002;106: HDL = high-density lipoprotein. NCEP III. Circulation. 2002;106:
 >35 in (>88 cm) Triglycerides. 150 mg/dL (1.69mmol/L) HDL cholesterol Men Women. <40 mg/dL (1.03mmol/L) <50 mg/dL (1.29mmol/L) Blood pressure. 130/85 mm Hg. Fasting blood glucose. 110 mg/dL (6.1mmol/L) Identification of the Metabolic Syndrome. This slide presents the ATPIII Adult Treatment Panel definition of the metabolic syndrome. Three or more of the criteria listed are required for a diagnosis of metabolic syndrome. References National Cholesterol Education Program (NCEP) III. Third Report of the National Cholesterol Education Program (NCEP) Expert Panel on Detection, Evaluation, and Treatment of High Blood Cholesterol in Adults (Adult Treatment Panel III) Final Report. Circulation. 2002;106: HDL = high-density lipoprotein. NCEP III. Circulation. 2002;106:")
36
CHD Risk Increases with Increasing Number of Metabolic Syndrome Risk Factors
Sattar et al, Circulation, 2003;108: Whyte et al, American Diabetes Association, 2001 Adapted from Ridker, Circulation 2003;107:

37
Meyer et al., Presented at APA annual meeting, May 21-26, 2005.
McEvoy JP et al. Schizophr Res. 2005;(August 29).
.")
38
Prevalence of Metabolic Syndrome According to BMI in the Adult General Population
Men Women N=12,363 “Overweight” = BMI “Obese” = BMI 30 (National Heart, Lung, and Blood Institute, Obesity Guidelines) Park et al. Arch Intern Med. 2003;163:427.
 Park et al. Arch Intern Med. 2003;163:427.")
39
Modifiable Risk Factors Affected by Psychotropics
Overweight / Obesity Insulin resistance Diabetes/hyperglycaemia Dyslipidemia Overweight and obesity are known to increase the risk for diabetes, cardiovascular disease (e.g., coronary heart disease [CHD] and cerebrovascular disease), hypertension, and certain cancers.1 In addition, they are associated with abnormal metabolic changes such as insulin resistance and dyslipidaemia, which are themselves risk factors for cardiovascular disease (CVD) and diabetes. 1. NIH/NHLBI guidelines. Clinical Guidelines on the Identification, Evaluation, and Treatment of Overweight and Obesity in Adults—The Evidence Report. NIH Publication No National Institutes of Health. September 1998. Newcomer JW. CNS Drugs 2005;19(Supp 1):1.93.
, hypertension, and certain cancers.1. In addition, they are associated with abnormal metabolic changes such as insulin resistance and dyslipidaemia, which are themselves risk factors for cardiovascular disease (CVD) and diabetes. 1. NIH/NHLBI guidelines. Clinical Guidelines on the Identification, Evaluation, and Treatment of Overweight and Obesity in Adults—The Evidence Report. NIH Publication No National Institutes of Health. September Newcomer JW. CNS Drugs 2005;19(Supp 1):1.93.")
40
1-Year Weight Gain: Mean Change From Baseline Weight
14 30 Olanzapine (12.5–17.5 mg) Olanzapine (all doses) Quetiapine Risperidone Ziprasidone Aripiprazole 12 25 10 20 Change From Baseline Weight (kg) 8 15 Change From Baseline Weight (lb) 6 10 4 5 1-Year Weight Gain: Mean Change From Baseline Weight For the most part antipsychotics are not used as short-term therapies. They are used as chronic therapies, principally for psychotic disorders and bipolar disorders. This graph depicts 1-year data for mean changes from baseline weight in long-term clinical trials. This data represents the largest data sets available in this area. Kilograms are on the left and the corresponding pounds are on the right of the graph. Note at the bottom of the slide that the drugs ziprasidone and aripiprazole, which produced relatively minimal short-term weight gain, produced about the same amount of weight gain long term, or an ~1-kg mean weight gain at 52 weeks. Risperidone produced an ~2.5-kg increase and quetiapine produced a 3.6-kg weight gain over ~1 year. There are 2 lines for olanzapine; the first is pooling together all doses of olanzapine, from 2.5 mg up to 17.5 mg, from the pooled clinical trial data sets, resulting in a mean increase in weight at 1 year of about 6 kg or about 13 lb. For most antipsychotic therapy 2.5 mg of olanzapine is not used. In other analyses of this data the mean increase exceeded 22 lb, or more than 10 kg at 52 weeks. This is a clinically important increase in terms of physiologic effects. References Nemeroff CB. Dosing the antipsychotic medication olanzipine. J Clin Psychiatry. 1997;58(suppl 10):45-49; Kinon BJ, Basson BR, Gilmore JA, Tollefson GD. Long-term olanzapine treatment: weight change and weight-related health factors in schizophrenia. J Clin Psychiatry. 2001;62:92-100; Brecher M, Zukin S, Leong R, Osterling-Koskinen L, Jones M. Long-term weight change with quetiapine treatment in schizophrenia: a comprehensive data review. Neuropsychopharmacology. 2004;29(suppl 1):S109; Brecher M, Zukin S, Leong R, Osterling-Koskinen L, Jones M. Long-term weight change with quetiapine treatment in schizophrenia: a comprehensive data review. Presented at: San Juan, Puerto Rico: Annual meeting of the American College of Neuropsychopharmacology. December 12-16,2004. Poster 114; Geodon® [package insert]. New York, NY:Pfizer Inc; 2005. 2 4 8 12 16 20 24 28 32 36 40 44 48 52 Weeks Nemeroff CB. J Clin Psychiatry. 1997;58(suppl 10):45-49; Kinon BJ et al. J Clin Psychiatry. 2001;62:92-100; Brecher M et al. American College of Neuropsychopharmacology; Poster 114; Brecher M et al. Neuropsychopharmacology. 2004;29(suppl 1):S109; Geodon® [package insert]. New York, NY:Pfizer Inc; Risperdal® [package insert]. Titusville, NJ: Janssen Pharmaceutica Products, LP; 2003; Abilify® [package insert]. Princeton NJ: Bristol-Myers Squibb Company and Rockville, Md: Otsuka America Pharmaceutical, Inc.; 2005.
 Olanzapine (all doses) Quetiapine. Risperidone. Ziprasidone. Aripiprazole Change From Baseline Weight (kg) Change From Baseline Weight (lb) Year Weight Gain: Mean Change From Baseline Weight. For the most part antipsychotics are not used as short-term therapies. They are used as chronic therapies, principally for psychotic disorders and bipolar disorders. This graph depicts 1-year data for mean changes from baseline weight in long-term clinical trials. This data represents the largest data sets available in this area. Kilograms are on the left and the corresponding pounds are on the right of the graph. Note at the bottom of the slide that the drugs ziprasidone and aripiprazole, which produced relatively minimal short-term weight gain, produced about the same amount of weight gain long term, or an ~1-kg mean weight gain at 52 weeks. Risperidone produced an ~2.5-kg increase and quetiapine produced a 3.6-kg weight gain over ~1 year. There are 2 lines for olanzapine; the first is pooling together all doses of olanzapine, from 2.5 mg up to 17.5 mg, from the pooled clinical trial data sets, resulting in a mean increase in weight at 1 year of about 6 kg or about 13 lb. For most antipsychotic therapy 2.5 mg of olanzapine is not used. In other analyses of this data the mean increase exceeded 22 lb, or more than 10 kg at 52 weeks. This is a clinically important increase in terms of physiologic effects. References Nemeroff CB. Dosing the antipsychotic medication olanzipine. J Clin Psychiatry. 1997;58(suppl 10):45-49; Kinon BJ, Basson BR, Gilmore JA, Tollefson GD. Long-term olanzapine treatment: weight change and weight-related health factors in schizophrenia. J Clin Psychiatry. 2001;62:92-100; Brecher M, Zukin S, Leong R, Osterling-Koskinen L, Jones M. Long-term weight change with quetiapine treatment in schizophrenia: a comprehensive data review. Neuropsychopharmacology. 2004;29(suppl 1):S109; Brecher M, Zukin S, Leong R, Osterling-Koskinen L, Jones M. Long-term weight change with quetiapine treatment in schizophrenia: a comprehensive data review. Presented at: San Juan, Puerto Rico: Annual meeting of the American College of Neuropsychopharmacology. December 12-16,2004. Poster 114; Geodon® [package insert]. New York, NY:Pfizer Inc; Weeks. Nemeroff CB. J Clin Psychiatry. 1997;58(suppl 10):45-49; Kinon BJ et al. J Clin Psychiatry. 2001;62:92-100; Brecher M et al. American College of Neuropsychopharmacology; Poster 114; Brecher M et al. Neuropsychopharmacology. 2004;29(suppl 1):S109; Geodon® [package insert]. New York, NY:Pfizer Inc; Risperdal® [package insert]. Titusville, NJ: Janssen Pharmaceutica Products, LP; 2003; Abilify® [package insert]. Princeton NJ: Bristol-Myers Squibb Company and Rockville, Md: Otsuka America Pharmaceutical, Inc.;")
41
CATIE Trial Results: Weight Gain Per Month Treatment
Weight gain (lb) per month OLZ QUET RIS PER ZIP NEJM :
 per month. OLZ. QUET. RIS. PER. ZIP. NEJM :")
42
Weiden P et al. Presented APA 2004.
Change in Weight From Baseline 58 Weeks After Switch to Low Weight Gain Agent 6 10 14 19 23 27 32 36 40 45 49 53 58 5 * LS Mean Change (lb) -5 *** ** -10 *** ** -15 *P<0.05 **P<0.01 ***P<0.0001 -20 *** -25 Switched from Conventionals Risperidone Olanzapine Weiden P et al. Presented APA 2004.
 -5. *** ** -10. *** ** -15. *P<0.05. **P<0.01. ***P< *** -25. Switched from. Conventionals. Risperidone. Olanzapine. Weiden P et al. Presented APA")
43
Levels of Evidence Case reports, case series, uncontrolled observational studies - hypothesis-generation only Retrospective database analyses - could be hypothesis-testing, but methodological issues might limit these to hypothesis-generation Controlled analytic studies, including randomized clinical trials - hypothesis-testing Casey DE, Haupt DW, Newcomer JW, Henderson DC, Sernyak MJ, Davidson M, Lindenmayer JP, Manoukian SV, Banerji MA, Lebovitz HE, Hennekens CH, J Clin Psychiatry 65(Suppl 7):4-18, 2004.
:4-18,")
44
Modifiable Risk Factors Affected by Psychotropics
Overweight / Obesity Insulin resistance Diabetes/hyperglycaemia Dyslipidemia Overweight and obesity are known to increase the risk for diabetes, cardiovascular disease (e.g., coronary heart disease [CHD] and cerebrovascular disease), hypertension, and certain cancers.1 In addition, they are associated with abnormal metabolic changes such as insulin resistance and dyslipidaemia, which are themselves risk factors for cardiovascular disease (CVD) and diabetes. 1. NIH/NHLBI guidelines. Clinical Guidelines on the Identification, Evaluation, and Treatment of Overweight and Obesity in Adults—The Evidence Report. NIH Publication No National Institutes of Health. September 1998. Newcomer JW. CNS Drugs 2005;19(Supp 1):1.93.
, hypertension, and certain cancers.1. In addition, they are associated with abnormal metabolic changes such as insulin resistance and dyslipidaemia, which are themselves risk factors for cardiovascular disease (CVD) and diabetes. 1. NIH/NHLBI guidelines. Clinical Guidelines on the Identification, Evaluation, and Treatment of Overweight and Obesity in Adults—The Evidence Report. NIH Publication No National Institutes of Health. September Newcomer JW. CNS Drugs 2005;19(Supp 1):1.93.")
45
Randomized Clinical Trials
Growing number of studies measure drug effects on the following: Insulin resistance Fasting lipids Fasting or post-load glucose and insulin Metabolic syndrome Key Points: Weight and other metabolic parameters are becoming increasingly well recognized as important considerations in the treatment of bipolar disorder; as such, these parameters are being examined in a growing number of drug trials

46
CATIE Results: Metabolic Changes From Baseline
40.5 Cholesterol (mg/dL) Triglycerides (mg/dL) 21.2 9.4 9.2 6.6 1.3 -1.3 -2.4 -8.2 -16.5 OLZ QUET RIS PER ZIP NEJM :
 Triglycerides (mg/dL) OLZ. QUET. RIS. PER. ZIP. NEJM :")
47
CATIE Results: Metabolic Changes From Baseline
13.7 Glucose (mg/dL) Glycosylated HB (%) 7.5 6.6 5.4 2.9 0.4 0.11 0.04 0.07 0.0 OLZ QUET RIS PER ZIP NEJM :
 Glycosylated HB (%) OLZ. QUET. RIS. PER. ZIP. NEJM :")
48
clozapine + + + + olanzapine risperidone + + D quetiapine aripiprazole
American Diabetes Association, American Psychiatric Association, American Association of Clinical Endocrinologists, North American Association for the Study of Obesity: Consensus Conference on Antipsychotic Drugs and Risk of Obesity and Diabetes Drug Weight Gain Diabetes Risk Dyslipidemia clozapine + + + + olanzapine risperidone + + D quetiapine aripiprazole +/- - ziprasidone + = increased effect; - = no effect; D = discrepant results. Diabetes Care 27: , 2004

49
*More frequent assessments may be warranted based on clinical status
ADA/APA/AACE/NAASO Consensus on Antipsychotic Drugs and Obesity and Diabetes: Monitoring Protocol* Start 4 wks 8 wks 12 wk qtrly 12 mos. 5 yrs. Personal/family Hx X Weight (BMI) Waist circumference Blood pressure Fasting glucose Fasting lipid profile X *More frequent assessments may be warranted based on clinical status Diabetes Care. 27: , 2004
 Waist circumference. Blood pressure. Fasting glucose. Fasting lipid profile. X. *More frequent assessments may be warranted based on clinical status. Diabetes Care. 27: ,")
51
Problem: SMI and Reduced Use of Medical Services
Fewer routine preventive services (Druss 2002) Worse diabetes care (Desai 2002, Frayne 2006) Lower rates of cardiovascular procedures (Druss 2000)
 Worse diabetes care (Desai 2002, Frayne 2006) Lower rates of cardiovascular procedures (Druss 2000)")
52
Access and Quality of Care
SMI may be a health risk factor because of: Patient factors, e.g.: amotivation, fearfulness, homelessness, victimization/trauma, resources, advocacy, unemployment, incarceration, social instability, IV drug use, etc Provider factors: Comfort level and attitude of healthcare providers, coordination between mental health and general health care, stigma, System factors: Funding, fragmentation

53
Goals: Lower Risk for CVD
Blood cholesterol 10% = 30% in CHD ( ) High blood pressure (> 140 SBP or 90 DBP) 4-6 mm Hg = 16% in CHD; 42% in stroke Cigarette smoking cessation 50%-70% in CHD Maintenance of ideal body weight (BMI = 25) 35%-55% in CHD Maintenance of active lifestyle (20-min walk daily) Hennekens CH. Circulation. 1998;97:
 High blood pressure (> 140 SBP or 90 DBP) 4-6 mm Hg = 16% in CHD; 42% in stroke. Cigarette smoking cessation. 50%-70% in CHD. Maintenance of ideal body weight (BMI = 25) 35%-55% in CHD. Maintenance of active lifestyle (20-min walk daily) Hennekens CH. Circulation. 1998;97:")
54
Survival Following Myocardial Infarction
88,241 Medicare patients, 65 years of age and older, hospitalized for MI Mortality increased by 19%: any mental disorder 34%: schizophrenia Increased mortality explained by measures of quality of care Druss BG et al. Arch Gen Psychiatry. 2001;58:

55
Disparities in care: impact of mental illness on diabetes management
Depression Anxiety Psychosis Mania Substance use disorder Personality disorder 0.8 1.0 1.2 1.4 1.6 0.8 1.0 1.2 1.4 1.6 0.8 1.0 1.2 1.4 1.6 0.8 1.0 1.2 1.4 1.6 0.8 1.0 1.2 1.4 1.6 0.8 1.0 1.2 1.4 1.6 No HbA test done No LDL test done No Eye examination done No Monitoring Poor glycemic control Poor lipemic control Odds ratio for: 313,586 Veteran Health Authority patients with diabetes 76,799 (25%) had mental health conditions (1999) Frayne et al. Arch Intern Med. 2005;165:
 had mental health conditions (1999) Frayne et al. Arch Intern Med. 2005;165:")
56
Why Should we be Concerned About Morbidity and Mortality?
Recent data from several states have found that people with serious mental illness served by our public mental health systems die, on average, at least 25 years earlier that the general population.

57
Overview - PROPOSED SOLUTIONS
Prioritize the Public Health Problem Target Providers, Families and Clients Focus on Prevention and Wellness Track Morbidity and Mortality in Public Mental Health Populations Implement Established Standards of Care Prevention, Screening and Treatment Improve Access to and Integration of Physical Health and Mental Health Care

58
Recommendations NATIONAL LEVEL
Seek federal designation of people with SMI as a distinct at-risk health disparities population. Establish co-ordinated mental health and general health care as a national healthcare priority. Establish a committee at the federal level to recommend changes to national surveillance activities that will incorporate information about health status in the population with SMI. Consider representation from SAMHSA, Medicaid , the Centers for Disease Control and Prevention, state MH authorities / NASMHPD, and experts This may include the IOM project and other national surveys. NATIONAL LEVEL 1. Seek federal designation of people with SMI as a distinct at-risk health disparities population 2. Establish a committee at the federal level to recommend changes to national surveillance activities that will incorporate information about health status in the population with SMI. Existing national surveillance activities for health should include mental health and surveys for mental health should include general health. Develop and recommend standard definitions for SMHA tracking of deaths as well as key data elements of morbidity and mortality surveillance at the state level. composed of with SAMHSA, Medicaid and the Centers for Disease Control and Prevention, SMHA representatives and expert panelists This might be a follow-up IOM project or one of the functions of the PNFC interagency group that is currently meeting.

59
Recommendations NATIONAL LEVEL
Share information widely about physical health risks in persons with SMI to encourage awareness and advocacy. Educate the health care community. Encourage consumers and family members to advocate for wellness approaches as part of recovery. FEDERAL RECOMMENDATIONS – continued Per the IOM report, engage at the national and state levels in development of the National Health Information Infrastructure (NHII) to assure that HER(electronic health record) and PHR (Personal health records) templates include the data elements needed to manage and coordinate general health care and mental health care. Additional recommendations at federal level: Assure that implementation of SAMHSA evidence-based practices such as Illness Management and Recovery, Family Psychoeducation, and Assertive Community Treatment include a component that is focused on health status and healthy lifestyles. Continue to promote adoption of recommendations in the NASMHPD Technical Reports on Polypharmacy and Smoking to implement policies and programs addressing these risk factors. Assure that all initiatives to address morbidity and mortality have concrete goals, timeframes and specific steps. Gather performance measurement data and use to manage overall system performance. Provide support to mental health and health care providers, SMHAs and other state agencies in implementing the recommendations listed below.
 to assure that HER(electronic health record) and PHR (Personal health records) templates include the data elements needed to manage and coordinate general health care and mental health care. Additional recommendations at federal level: Assure that implementation of SAMHSA evidence-based practices such as Illness Management and Recovery, Family Psychoeducation, and Assertive Community Treatment include a component that is focused on health status and healthy lifestyles. Continue to promote adoption of recommendations in the NASMHPD Technical Reports on Polypharmacy and Smoking to implement policies and programs addressing these risk factors. Assure that all initiatives to address morbidity and mortality have concrete goals, timeframes and specific steps. Gather performance measurement data and use to manage overall system performance. Provide support to mental health and health care providers, SMHAs and other state agencies in implementing the recommendations listed below.")
60
Recommendations STATE LEVEL
Seek state designation of people with SMI as BOTH an at-risk and a health disparities population. Establish co-ordinated mental health and general health care as a state healthcare priority. Education and advocacy policy makers funders providers individuals, family, community State Level Seek state designation of people with SMI as a distinct at-risk health disparities population, and request development and adaptation of materials and methods for prevention in this population as well as inclusion in morbidity and mortality surveillance demographics. Work with Medicaid and Public Health agencies to build state level surveillance data bases to provide surveillance data on both morbidity and mortality in the population with SMI. Track early death and chronic medical illness as negative outcomes in the population with SMI. SMHAs in conjunction with these other agencies should develop policies/memoranda of agreement regarding who is responsible for disease surveillance in the SMI population.

61
Recommendations STATE LEVEL
Require, regulate and lead Behavioral Health provider systems to screen, assess and treat both mental health and general health care issues. Provide for staffing time record keeping reimbursement linkage with physical healthcare providers Funding Promote co-ordinated and integrated mental health and physical health care for persons with SMI. See 11th NASMHPD Technical Paper: Integrating Mental Health and Primary Care. State Level system transformation recommendations from the New Freedom Commission, Institute of Medicine and SAMHSA to achieve a more person-centered mental health system. Specifically, implement the following selected recommendations, as identified in the IOM report, and modified to address the morbidity and mortality issues: State and local policy-makers should: Revise laws and other policies that obstruct communication between providers Create high-level mechanisms to improve collaboration and coordination across agencies Implement the recommendations for MH systems found in the 11th NASMHPD Technical Paper: Integrating Mental Health and Primary Care. Improve linkages between mental health providers and community medical providers, including development of onsite, integrated primary healthcare services in mental health treatment programs. This will require effective leadership, education and readiness for consumers and providers, workforce training, and support for system change in mental health agencies (licensing, credentialing, electronic health records, and financing).
.")
62
Recommendations STATE LEVEL
Develop a quality improvement (QI) process that supports increased access to physical healthcare and ensures appropriate prevention, screening and treatment services. Target common causes of increased mortality and chronic medical illness in the SMI population Include all key stakeholders: state agencies, practitioners, individuals and their families, academic and training institutions in QI planning and review A key component : training and technical assistance for practitioners in both mental health and primary health fields Join with the Medicaid and Public Health agencies at the state level to develop a quality improvement (QI) plan to support appropriate screening, treatment and access to health care for people being served by the public mental health system, whether Medicaid or uninsured. Target common causes of increased mortality and chronic medical illness in the SMI population for QI action planning and programmatic interventions. Keeping people appropriately out of inpatient medical settings should have the same priority as keeping them out of the criminal justice system or promoting community tenure by keeping people appropriately out of inpatient mental health care. Implement standards of care for prevention, screening and treatment in the context of better access to health care. Develop toolkits to help providers, self-help/peer support groups and families understand how to facilitate healthy choices while promoting personal responsibility. A key component of this plan will be training and technical assistance for the mental health workforce on the importance of the issues. Assure financing methods for service improvements. Assure integrated data analysis of utilization, cost and quality outcomes for both health care and mental health, including analysis of degree to which improvements in one system of care leads to changes in the other system of care. Involve academic and association partners in planning and conducting training.
 process that supports increased access to physical healthcare and ensures appropriate prevention, screening and treatment services. Target common causes of increased mortality and chronic medical illness in the SMI population. Include all key stakeholders: state agencies, practitioners, individuals and their families, academic and training institutions in QI planning and review. A key component : training and technical assistance for practitioners in both mental health and primary health fields. Join with the Medicaid and Public Health agencies at the state level to develop a quality improvement (QI) plan to support appropriate screening, treatment and access to health care for people being served by the public mental health system, whether Medicaid or uninsured. Target common causes of increased mortality and chronic medical illness in the SMI population for QI action planning and programmatic interventions. Keeping people appropriately out of inpatient medical settings should have the same priority as keeping them out of the criminal justice system or promoting community tenure by keeping people appropriately out of inpatient mental health care. Implement standards of care for prevention, screening and treatment in the context of better access to health care. Develop toolkits to help providers, self-help/peer support groups and families understand how to facilitate healthy choices while promoting personal responsibility. A key component of this plan will be training and technical assistance for the mental health workforce on the importance of the issues. Assure financing methods for service improvements. Assure integrated data analysis of utilization, cost and quality outcomes for both health care and mental health, including analysis of degree to which improvements in one system of care leads to changes in the other system of care. Involve academic and association partners in planning and conducting training.")
63
Recommendations LOCAL AGENCY / CLINICIAN
BH providers shall provide quality medical care and mental health care Screen for general health with priority for high risk conditions Offer prevention and intervention especially for modifiable risk factors (obesity, abnormal glucose and lipid levels, high blood pressure, smoking, alcohol and drug use, etc.) Prescribers will screen, monitor and intervene for medication risk factors related to treatment of SMI (e.g. risk of metabolic syndrome with use of second generation anti-psychotics) Treatment per practice guidelines, e.g heart disease, diabetes, smoking cessation, use of novel anti-psychotics. Have effective linkages with community resources (including access to healthcare and engage families and other collateral service providers in understanding how to support consumers in maintaining their healthy choices) Screen for co-morbid conditions (obesity, diabetes, high blood pressure) Routinely assess treatment outcomes (physical as well as mental health) Routinely share clinical information with other providers (primary and specialty healthcare providers as well as mental health providers) Practice evidence-based care coordination (coordinate care of the whole person) Assure health status assessment and planning are a part of treatment planning and goal setting for every person with SMI, throughout the system. Adopt the U.S. Public Health Service guidelines for prevention and intervention in regard to modifiable risk factors—assure at least the same standard of care as that available to the general population. Prescribers should be accountable for screening to assure adequate treatment of medical risk factors such as metabolic syndrome and its consequences to the same extent that they are for Extra-Pyramidal Symptoms and Tardive Dyskinesia. Adopt consistent use of a metabolic screening and monitoring tool. Implement standards of care for prevention, screening and treatment in the context of better access to health care. Use guidelines for prevention and intervention to assure there is consistent monitoring of individuals receiving psychotropic medications as a part of medication evaluation and follow up services in outpatient mental health settings as well as inpatient settings. Using the monitoring tools recommended above, assure consistent diabetes screening for all individuals actively being served by the public mental health system.Assure priority for those receiving second generation antipsychotic medications and/or high risk ethnic populations.
 Prescribers will screen, monitor and intervene for medication risk factors related to treatment of SMI (e.g. risk of metabolic syndrome with use of second generation anti-psychotics) Treatment per practice guidelines, e.g heart disease, diabetes, smoking cessation, use of novel anti-psychotics. Have effective linkages with community resources (including access to healthcare and engage families and other collateral service providers in understanding how to support consumers in maintaining their healthy choices) Screen for co-morbid conditions (obesity, diabetes, high blood pressure) Routinely assess treatment outcomes (physical as well as mental health) Routinely share clinical information with other providers (primary and specialty healthcare providers as well as mental health providers) Practice evidence-based care coordination (coordinate care of the whole person) Assure health status assessment and planning are a part of treatment planning and goal setting for every person with SMI, throughout the system. Adopt the U.S. Public Health Service guidelines for prevention and intervention in regard to modifiable risk factors—assure at least the same standard of care as that available to the general population. Prescribers should be accountable for screening to assure adequate treatment of medical risk factors such as metabolic syndrome and its consequences to the same extent that they are for Extra-Pyramidal Symptoms and Tardive Dyskinesia. Adopt consistent use of a metabolic screening and monitoring tool. Implement standards of care for prevention, screening and treatment in the context of better access to health care. Use guidelines for prevention and intervention to assure there is consistent monitoring of individuals receiving psychotropic medications as a part of medication evaluation and follow up services in outpatient mental health settings as well as inpatient settings. Using the monitoring tools recommended above, assure consistent diabetes screening for all individuals actively being served by the public mental health system.Assure priority for those receiving second generation antipsychotic medications and/or high risk ethnic populations.")
64
LOCAL AGENCY / CLINICIAN Recommendations
2. Care coordination Models Assure that there is a specific practitioner in the MH system who is identified as the responsible party for each person’s medical health care needs being addressed and who assures coordination all services. Routine sharing of clinical information with other providers (primary and specialty healthcare providers as well as mental health providers Care integration where services are co-located Have effective linkages with community resources (including access to healthcare and engage families and other collateral service providers in understanding how to support consumers in maintaining their healthy choices) Screen for co-morbid conditions (obesity, diabetes, high blood pressure) Routinely assess treatment outcomes (physical as well as mental health) Routinely share clinical information with other providers (primary and specialty healthcare providers as well as mental health providers) Practice evidence-based care coordination (coordinate care of the whole person)
 Screen for co-morbid conditions (obesity, diabetes, high blood pressure) Routinely assess treatment outcomes (physical as well as mental health) Routinely share clinical information with other providers (primary and specialty healthcare providers as well as mental health providers) Practice evidence-based care coordination (coordinate care of the whole person)")
65
LOCAL AGENCY / CLINICIAN RECOMMENDATIONS
3. Support consumer wellness and empowerment to improve personal mental and physical well-being educate / share information to make healthy choices regarding nutrition, tobacco use, exercise, implications of psychotropic drugs teach /support wellness self-management skills teach /support decision making skills motivational interviewing techniques Implement a physical health Wellness approach that is consistent with Recovery principles, including supports for smoking cessation, good nutrition, physical activity and healthy weight. attend to cultural and language needs Utilize the system transformation recommendations from the New Freedom Commission, Institute of Medicine and SAMHSA to achieve a more person-centered mental health system. Specifically, implement the following selected recommendations, as identified in the IOM report, and modified to address the morbidity and mortality issues: Direct care providers should: Support consumer decision making and treatment preferences (regarding physical health as well as mental health, giving information to make healthy choices on weight, implications of psychotropic drugs, education about the effects of smoking, obesity and lack of exercise) Use illness self-management practices ( expand opportunities for individuals to practice and develop decision making skills in regard to physical as well as mental health) Develop approaches to support exercise, good nutrition, and weight within the context of each person’s unique interests and history. Motivational interviewing techniques will be useful as a part of staging and framing the change process.
 Use illness self-management practices ( expand opportunities for individuals to practice and develop decision making skills in regard to physical as well as mental health) Develop approaches to support exercise, good nutrition, and weight within the context of each person’s unique interests and history. Motivational interviewing techniques will be useful as a part of staging and framing the change process.")
66
Overview - PROPOSED SOLUTIONS
Prioritize the Public Health Problem Target Providers, Families and Clients Focus on Prevention and Wellness Track Morbidity and Mortality in Public Mental Health Populations Implement Established Standards of Care Prevention, Screening and Treatment Improve Access to and Integration of Physical Health and Mental Health Care

67
Full report available at

Similar presentations