Download presentation
Presentation is loading. Please wait.

1
David Childs, Presenter
Cell:

2
High-Performance Cultures

3
Charlotte, N.C. 1972 – Implemented H.P.C.
1995 – Designated “most livable city in the nation”

4
Coral Springs, FL (winner of 2007 Baldrige Award)
Performance: First in EMS/Fire Call Response % within 8 minutes; Second in average Police Response Time Resource Allocation: Lowest tax rate among 6 cities; lowest employee count per population among 9 cities; 2nd lowest operating cost per citizen and 2nd lowest debt burden among 9 AAA bond-rated cities

5
Dallas County Tax Office (Quality Texas recognition for 2007 & 2008)
Performance: First in State in vehicle titles and registrations per FTE; 2nd in Nation in tax accounts per FTE; reduced average DMV wait time from 48 to 8 minutes; reduced peak telephone wait time from 8 to 3 minutes Resource Allocation: Over 20 year period, reduced staff while tripling workload and improving response times; maintained average annual increase of 3.3% in gross annual budget while comparable agencies increased by 10-12%

6
Galveston Tax Office Over four year period, increased production and improved response times while reducing staff from 67 to 51

7
State of Iowa Improved processing time for air quality permits – from 62 days to 6 days Improved processing time for wastewater discharge permits – from 28 months to 4.5 months

8
City of Irving, TX (Quality Texas recognition for 2009)
One of only four cities in Texas with AAA bond rating 2nd lowest tax rate among 11 cities 2nd lowest debt burden among 11 cities

9
High Performance Culture yields proven results
Improved performance Increased productivity Improved citizen service Reduced resource/financial demands Documentable improved efficiency and effectiveness

10
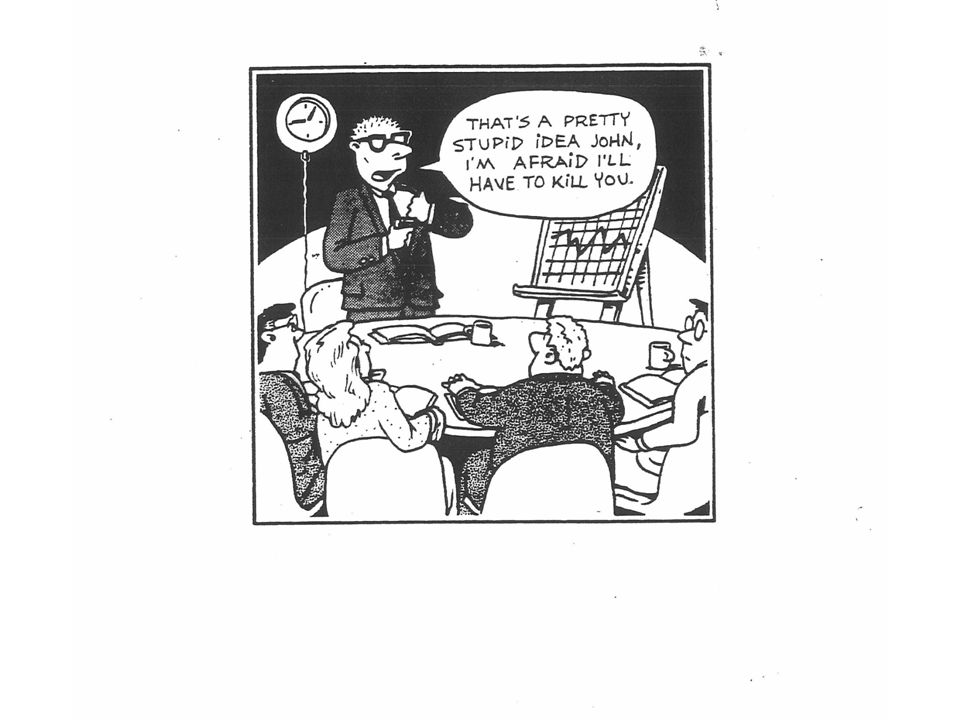
“Typical” Management

11
“Typical” Management Top Down Negative Profit today Self-centered
Sociopathic

12
High Performance Culture

13
High Performance Culture
Bottom up Positive Long-term service Mission-centered Actualized

14
Known meaning/purpose/focus/motivation
H.P.C. Step #1: MISSION Known meaning/purpose/focus/motivation

15
Characteristics of a Quality Mission Statement
Brief Unique Visionary Lived

16
Look for “actualizers” and “PHACES”
H.P.C. Step #2: RECRUITING Look for “actualizers” and “PHACES”

17
“Typical” Hires: Skills/ Experience

18
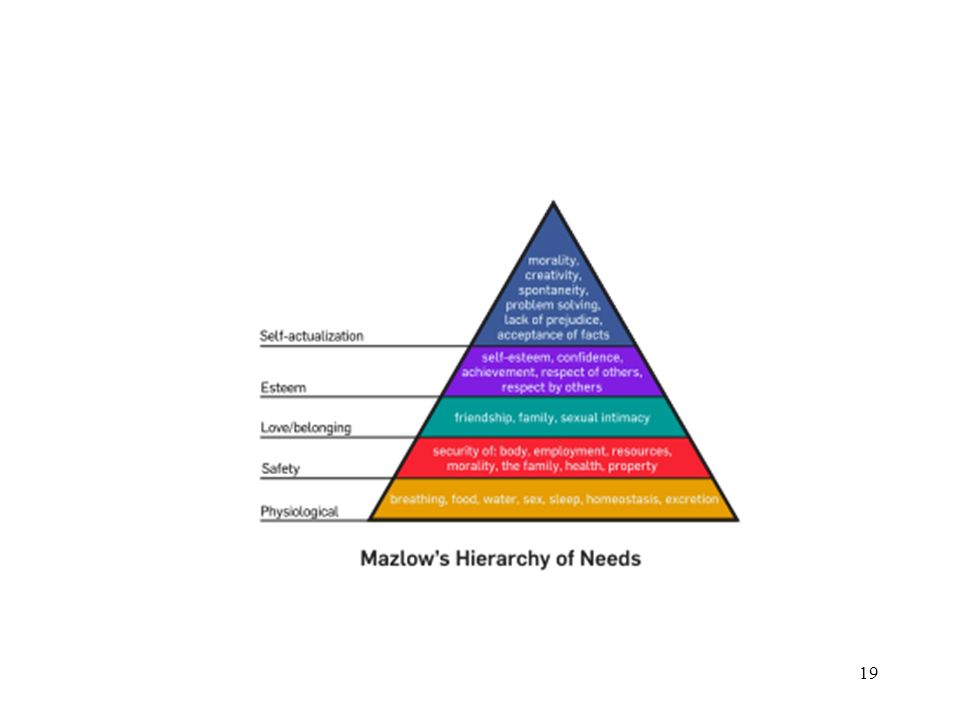
H.P.C. Hires: Actualizers; givers; ‘at peace’

20
H.P.C. Hires: “PHACES” P = Positive H = Happy A = Alert C = Confident
E = Energetic S = Sophisticated

21
The most revealing interview question….?

22
H.P.C. Step #3: EMPOWER You hired excellence!
You have given them an inspiring mission! Let them do it!

25
Workplace Improvements Suggested by Employees

26
H.P.C. Step #4: COUNT Can you document it?
Who are your 5 most productive employees? Your 5 most efficient departments? How effective/efficient is your organization in comparison with 5 of its “peers”? Can you document it?

27
The Cornerstone Question: Are you accomplishing the mission more successfully than you were four years ago? PROVE IT!

29
Key Elements of Effective Performance Measures
Measure the mission Measure the tangible desired impact Few (end result, not processes) Positive
 Positive.")
30
Develop Key Measures

31
What 5 efficiencies/outcomes/impacts do you most want to monitor to determine progress toward your mission? ______________________________

32
ANNUAL FITNESS CHECK-UP (CITIES): Animal Code
FIT FOR SERVICE © ANNUAL FITNESS CHECK-UP (CITIES): Animal Code Organization Name: __________________________________________ Date: ___________ Population: _________________ 2 years ago Last year This year 1. Average % facility occupancy 2. Average cost/animal per day 3. Average total cost/animal 4. Adoption % 5. % Animal code complaints brought to compliance 6. % Total costs recovered/ donated/etc. 7. Total cost per citizen
: Animal Code. Organization. Name: __________________________________________ Date: ___________ Population: _________________. 2 years ago Last year This year. 1. Average % facility occupancy. 2. Average cost/animal per day. 3. Average total cost/animal. 4. Adoption % 5. % Animal code complaints brought to compliance. 6. % Total costs recovered/ donated/etc. 7. Total cost per citizen.")
33
Code Enforcement: 2 years ago Last year This year 1. Code Accounts/FTE
2. Inspections/FTE 3. Annual cost per account 4. Complaints as % of total violations 5. Average # days from complaint to inspection 6. Average # days from inspection to compliance 7. % Code violations voluntarily corrected 8. Violations as % of total accounts 9. % Total costs recovered

34
Permits: 2 years ago Last year This year
1. # Days from request to BEMP approval 2. # Days from request to building plan approval 3. Cost per BEMP inspection 4. Cost per building plan review 5. BEMP inspections /FTE 6. Building plan reviews/FTE 7. % Total costs recovered

35
ANNUAL FITNESS CHECK-UP (CITIES): Facilities
FIT FOR SERVICE © ANNUAL FITNESS CHECK-UP (CITIES): Facilities Organization Name: __________________________________________ Date: ___________ Population: _________________ 2 years ago Last year This year 1. Total Square Feet 2. Cost/Sq. Ft. for maintenance 3. Cost/Sq. Ft. for custodial 4. Cost/Sq. Ft. for energy 5. % Total FTE/Hours dedicated to emergency repairs 6. Average hours from emergency call until repair completion 7. % Total FTE/Hours dedicated to prevention 8. # Facilities-related injuries (maintenance staff/office staff/ citizens)
: Facilities Organization. Name: __________________________________________ Date: ___________ Population: _________________ 2 years ago Last year This year. 1. Total Square Feet. 2. Cost/Sq. Ft. for maintenance. 3. Cost/Sq. Ft. for custodial. 4. Cost/Sq. Ft. for energy. 5. % Total FTE/Hours dedicated to emergency repairs. 6. Average hours from emergency call until repair completion. 7. % Total FTE/Hours dedicated to prevention. 8. # Facilities-related injuries (maintenance staff/office staff/ citizens)")
36
EMS: 2 years ago Last year This year 1. # Seconds to answer call 2. Average time from first ring to arrival 3. #Calls/FTE 4. % Total calls resulting in dispatch 5. Average cost per dispatch 6. Call monitoring quality of call % 7. # Poor quality of service complaints/lawsuits 8. Survival % of cardiac calls 9. # Attending healthy lifestyle presentations 10. % Total costs recovered 11. Total cost/citizen

37
ANNUAL FITNESS CHECK-UP (CITIES): Purchasing
FIT FOR SERVICE © ANNUAL FITNESS CHECK-UP (CITIES): Purchasing Organization Name: __________________________________________ Date: ___________ Population: _________________ 2 years ago Last year This year 1. # Days from requisition until product is installed 2. % Total contract cost/original bid cost 3. Revenue from sale of surplus 4. # Contract mediations 5. Total $ in maintenance/repair contracts 6. Total $ in purchase contracts
: Purchasing. Organization. Name: __________________________________________ Date: ___________ Population: _________________. 2 years ago Last year This year. 1. # Days from requisition until product is installed. 2. % Total contract cost/original bid cost. 3. Revenue from sale of surplus. 4. # Contract mediations. 5. Total $ in maintenance/repair contracts. 6. Total $ in purchase contracts.")
38
Congratulations! You have measures!

39
H.P.C. Step #5: REWARD Verifies commitment to mission
Verifies monitoring Maintains focus/commitment to mission Attracts more actualizers/PHACES

40
Types of Reward Recognition Positive atmosphere Purpose Accomplishment
$$$

41
H.P.C. Step #6: CONSTANTLY IMPROVE
“Don’t look back. Somethin’ might be gainin’ on ya!” ---Satchel Paige

42
6 phases of a project Enthusiasm Disillusionment Panic
Search for the Guilty Punishment of the Innocent Praise and Honors for the Non Participants

44
Core Question: How can we improve our measures of mission success?
Process analysis Cost/benefit Staff performance

46
Summary: the symbiotic cycle of success
Mission Hire actualizers/PHACES Empower Count Reward Improve Repeat

47
Leaders are best when people barely know they exist
Leaders are best when people barely know they exist. Not so good when people obey and acclaim them, Worse when they are despised. Fail to honor people and they will not honor you. But of good leaders who talk little, When the work is done and the aims fulfilled, Their people will say, ‘We did this ourselves.’ Lao-Tse, 565 BC

48
You and your staff are now living a life with:
Focus Purpose Meaning Achievement CONGRATULATIONS!!

49
David Childs, Presenter
Cell:

Similar presentations