Download presentation
Presentation is loading. Please wait.

1
Understanding Your Tests

2
What’s Your Wellness Score?
Get a Good Grade In Your Health

3
Body Mass Index (BMI) BMI = Weight (in kg) Height2 (in meters)
Lbs/ inches2 x 703 A BMI of <25 = desirable 25 – = overweight >30 = obese Tells us if you are over weight

4
Relationship of BMI to Excess Mortality
300 Age at Issue 20-29 250 30-39 200 150 Mortality Ratio 100 Low Moderate High Dr. George Bray is a well-known obesity researcher. He’s looked at our likelihood of living a long life relative to our BMI and found the risk of dying is low with a BMI of 25 to 30 and increases as BMI increases. The greatest risk is seen with BMIs above 40. 50 Risk Risk Risk 15 20 25 30 35 40 Body Mass Index (kg/[m2]) Bray GA. Overweight is risking fate. Definition, classification, prevalence and risks. Ann NY Acad Sci 1987;499:14-28.
 Bray GA. Overweight is risking fate. Definition, classification, prevalence and risks. Ann NY Acad Sci 1987;499:")
5
Waist/Hip Ratio Waist/Hip Ratio Ideal: <.80 Woman and <.95 Man
Tells us if you are Over-Fat. Skinny fat person can have normal BMI and high body fat. Adipose Tissue is the largest endocrine gland in the body and produce: Inflammatory chemicals Estrogen Cortisol

6
Blood Pressure & Resting Pulse
Systolic less than or equal to 110mm-Good Diastolic equal to or less than 70mm-Good Greater than 130/85mm is Mildly Hypertensive In Blood Pressure above 11/5/75, a 10 point jump in Diastolic BP (bottom number), causes a 2-fold increase in death from heart disease Medications??
, causes a 2-fold increase in death from heart disease. Medications")
7
Sugar Biomarkers Fasting Glucose 80-100 mg/dl
If Fasting Glucose is above 100 mg/dl then consider HbA1C- Glycosylated Hemoglobin Normal range is %. In poorly controlled diabetes, its 8.0% or above, and in well controlled patients it's less than 7.0% The predictive value of HbA1C for total mortality was stronger than that documented for cholesterol concentration, body mass index and blood pressure.” Khaw, K-T, et al, BMJ, 2001, Vol 322: 1-6 Also consider Fasting Insulin Increased insulin production causes insulin resistance Sign of Insulin Resistance with levels over 15 uU/ml

8
Lipid Biomarkers Lipids, fractionated lipids
Total Cholesterol-under 200 Triglycerides-under 150, preferably under 100 HDL-over 50 (male) and over 60 (female) LDL-under 130 Trig/HDL ratio- under 2.0 Chol/HDL ratio- under 3.0 Triglyceride/HDL ratio predicts a heart attack 17 times more accurately than just Cholesterol numbers.
 and over 60 (female) LDL-under 130. Trig/HDL ratio- under 2.0. Chol/HDL ratio- under 3.0. Triglyceride/HDL ratio predicts a heart attack 17 times more accurately than just Cholesterol numbers.")
9
Consider an MSQ- Systems Evaluation
Medical Symptoms Questionnaire (MSQ) Identifies symptoms in most body systems Quantifies patient’s level of symptoms Provides a simple metric to track patient improvement
 Identifies symptoms in most body systems. Quantifies patient’s level of symptoms. Provides a simple metric to track patient improvement.")
10
EPIC HEALTHY LIVING STUDY
1. BMI Under Hours of Physical Activity Per Week 3. Following a Healthy Diet (fruits, vegetables, beans, whole grains, nuts, seeds, and limited amounts of meat) 4. Never Smoking Participants with all 4 factors to the right had a 78% lower risk of developing a chronic disease (diabetes 93%; myocardial infarction 81%; stroke 50% and cancer 36% than participants without engaging in healthy factors. Arch Intern Med. 2009;169(15):
 4. Never Smoking Participants with all 4 factors to the right had a 78% lower risk of developing a chronic disease (diabetes 93%; myocardial infarction 81%; stroke 50% and cancer 36% than participants without engaging in healthy factors. Arch Intern Med. 2009;169(15):")
11
How to Identify Patients with Metabolic Syndrome
National Cholesterol Education Program (NCEP) definition is the presence of 3 or more of the following: Waist Circumference Men >40 in, Women >35 in Triglycerides ≥150 mg/dL HDL Cholesterol TG/HDL Ratio ≥3 Men <40 mg/dL; Women <50mg/dL Blood Pressure ≥130/≥85 mmHg Blood Glucose ≥100 mg/dL According to the CDC if you have any two of these symptoms you have double the risk of death from coronary heart disease and if you have 4 of the above you have 3.5 times the risk.
 definition is the presence of 3 or more of the following: Waist Circumference. Men >40 in, Women >35 in. Triglycerides. ≥150 mg/dL. HDL Cholesterol. TG/HDL Ratio ≥3. Men <40 mg/dL; Women <50mg/dL. Blood Pressure. ≥130/≥85 mmHg. Blood Glucose. ≥100 mg/dL. According to the CDC if you have any two of these symptoms you have double the risk of death from coronary heart disease and if you have 4 of the above you have 3.5 times the risk.")
12
General Features of Metabolic Syndrome
Abdominal obesity Men – waist > 40 inches, or waist is larger than hips Women – waist > 35 inches, or waist is greater than 80% the size of hips Altered blood lipids (fats) High triglycerides, trig/HDL ratio Small LDL cholesterol particles Low HDL cholesterol Raised blood pressure Insulin resistance ( glucose intolerance) Pro-thrombotic state (blood clotting tendency) Increased Fibrinogen and PAI-1 Pro-inflammatory state Increased IL-6 and hs-CRP firstline therapy
 High triglycerides, trig/HDL ratio. Small LDL cholesterol particles. Low HDL cholesterol. Raised blood pressure. Insulin resistance ( glucose intolerance) Pro-thrombotic state (blood clotting tendency) Increased Fibrinogen and PAI-1. Pro-inflammatory state. Increased IL-6 and hs-CRP. firstline. therapy.")
13
Weight Management/Nutrition What is Food?

14
Food is a Mixture 30-20-10 Protein Fat 20 g 10 g Carbohydrate 30 g
We don’t tend to think of what we eat as protein, carbohydrate and fat. We think in terms of food, but the body sees food in these terms. Most foods are a mixture of these macronutrients. Knowledge is power. You must know what you are eating. Yes there’s lots of info out there, high fat, low fat, low salt, Atkins, South Beach, Weight Watchers. Etc etc. Go through example of PBnJ sandwich, what is carb, what is fat, what is protein, and are they healthy. Carbohydrate 30 g

15
What Hormone is secreted when your eat sugar
What Hormone is secreted when your eat sugar? Understanding Glycemic Index

17
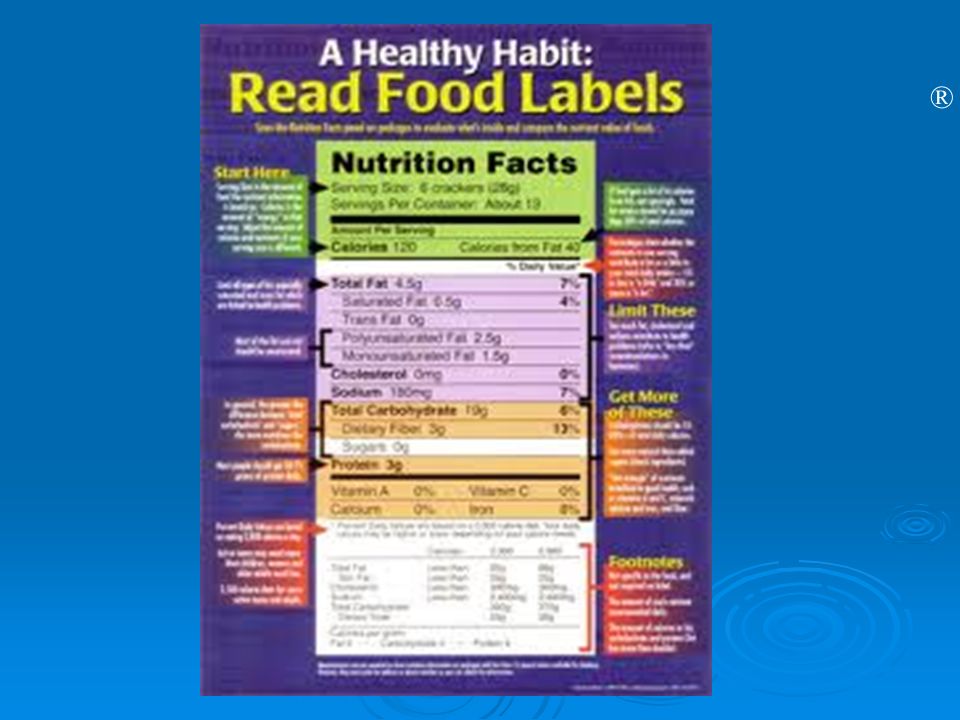
Understanding Food Labels

18
Use your hand as your guide
Carbohydrate- Fist Protein- Palm Fat- Thumb

19
Question? How many teaspoons of sugar in a 20 ounce soda?
Bonus question – what is the average pH of a soda (diet or regular)?
")
20
Are you eating like a BEAR or a DEER?
Eats Big Meals 2-3 times a day! Eats Small Meals 5-7 times a day!

21
Eating Out Don’t look at the menu
The average restaurant portion size is 4-5 X a normal size The calories add up quickly No Starch-Double Vegetable Split meals and ask for the “to go” container ahead of time No bread before dinner!

22
Good Fat vs. Bad Fat 70 Trillion Cells in the Human Body!!

23
Power of Habits

Similar presentations


 of 30 or higher. Obesity: Body Mass Index (BMI) of 30 or higher. Body Mass Index (BMI): A measure.>")
.>")
>")


 of 30 or higher.>")
 Definitions: Obesity: having a very high amount of body fat in relation to lean body mass, or Body Mass Index.>")
