Download presentation
Presentation is loading. Please wait.

1
The Aetiology of Obesity
A New Hope – Part 1 of 6

2
William Banting 1796-1878 www.kidneylifescience.ca
Age 62 weighed 202lbs and stood 5’5” Increased exercise and decrease caloric intake but no weight loss Ate 3 meals a day of meat, fish or game with an ounce or 2 of stale toast or cooked fruit on the side Scrupulously avoided any other food that might contain either sugar or starch – in particular – bread, milk, beer, sweets, and potatoes Avoid ‘fattening’ carbohydrates “Letter on Corpulence” 1863

3
William Osler www.kidneylifescience.ca “Father of Modern Medicine”
Author of seminal textbook “The Principles and Practice of Medicine” 1907 Discussed treatment of obesity These diets featured lean beef, veal, mutton and eggs 1882 monograph “Obesity and Its Treatment” – insisted that fatty foods were crucial because they increased satiety and so decreased fat accumulation “Father of Modern Medicine”

4
Common Knowledge Obesity www.kidneylifescience.ca Fattening
Baby and Child Care “Rich desserts, the amount of plain, starchy foods (cereals, breads, potatoes) taken is what determines … how much (weight) they gain or lose” 1963 –British Journal of Nutrition “Every woman knows that carbohydrate is fattening: this is a piece of common knowledge, which few nutritionists would dispute” Fattening Carbohydrates Obesity
 taken is what determines … how much (weight) they gain or lose 1963 –British Journal of Nutrition. Every woman knows that carbohydrate is fattening: this is a piece of common knowledge, which few nutritionists would dispute Fattening. Carbohydrates. Obesity.")
5
The Great Epidemic of Coronary Disease
1950s - “Diet-Heart” Hypothesis 1960s - Jean Mayer carbohydrate-restricted diets “The equivalent of mass murder” Fattening carbohydrate suddenly transformed into the healthy whole grain 1950s Dietary fat increasingly vilified for heart disease due to its effects on LDL cholesterol 1960sthe American Medical Association were insisting that low carbohydrate diets were dangerous fads (a 200 year old fad) Low fat, high carbohydrate diets previously unknown in human history BUT… the fattening carbohydrate could not be healthy (low fat) and unhealthy (causes obesity) at the same time Fat, with dense calories assumed to cause obesity Calories in/ calories out model displaces traditional ‘fattening carbohydrate’ model Created in 1948
 Low fat, high carbohydrate diets previously unknown in human history. BUT… the fattening carbohydrate could not be healthy (low fat) and unhealthy (causes obesity) at the same time. Fat, with dense calories assumed to cause obesity. Calories in/ calories out model displaces traditional ‘fattening carbohydrate’ model. Created in")
6
Dietary Goals For the United States 1977
Dietary Goals 1. Raise consumption of carbohydrates until they constituted 55-60% of calories 2. Decrease fat consumption from approximately 40% to 30% of which no more than 1/3 from saturated fat First time any government institution had told Americans they could improve their health by eating less fat Dietary fat controversy was now a political issue and not a scientific one

7
Food Pyramid

8
An Eating Plan for Healthy Americans: The American Heart Association Diet 1995
“To control the amount and kind of fat, saturated fatty acids and dietary cholesterol you eat, choose snacks from other food groups such as…low fat cookies, low-fat crackers…unsalted pretzels, hard candy, gum drops, sugar*, syrup, honey, jam, jelly, marmalade (as spreads)” *WTF?? AHA endorsed ‘healthy snacks’
 *WTF AHA endorsed ‘healthy snacks’")
9
How did we do? www.kidneylifescience.ca
Conscious effort to eat less fat, less red meat, fewer eggs Clear evidence that the general public listened to the leading authorities of the day and tried to comply Rise in obesity was not simply a case of the general public not listening to conventional medical advice Average fat intake decreased from 45% of calories to less than 35% 1976 – 1996 40% decline in hypertension 28% decline in hypercholesterolemia Smoking drops 33% to 25%

10
Jus’ Doin’ what we’re told…
Source

11
Increasing Sugar Consumption
Dietary Guidelines Increasing availability of sugar

12
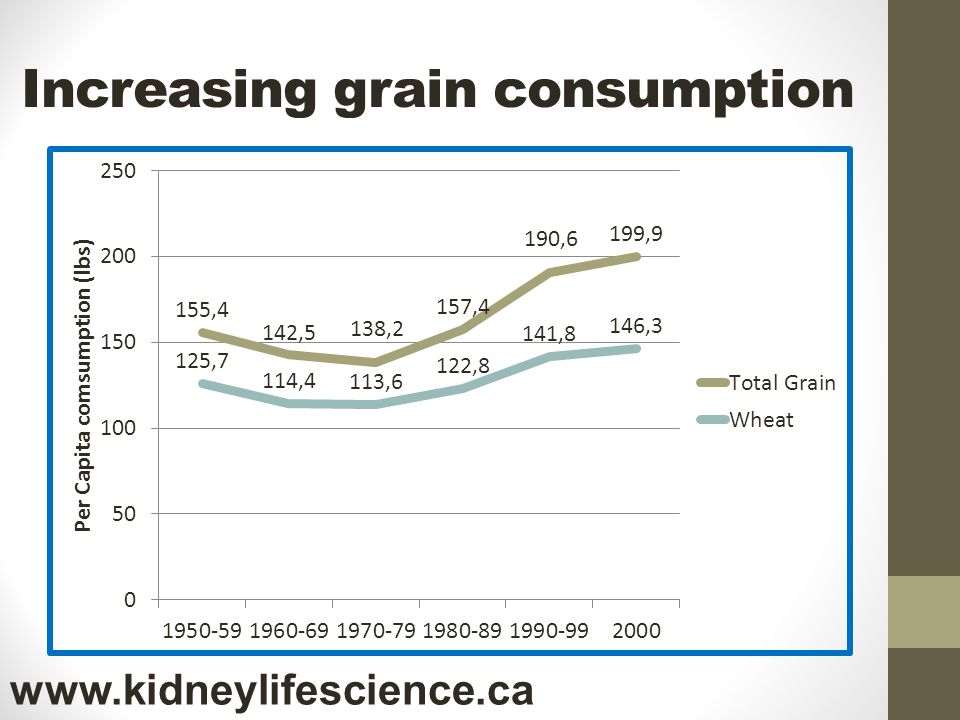
Increasing grain consumption
13
1st Dietary Guidelines for Americans

14
Caloric Reduction As Primary
Eat too much Personal Choice Behaviour Obesity Exercise too little Implicit Assumptions 1. “A calorie is a calorie” 2. Fat stores are essentially unregulated A ‘dump’ for excess calories 3. Intake and Expenditure of calories are under conscious control Ignores effects Hunger and basal metabolic rates 4. Intake and Expenditure of calories are independent of each other

15
Energy Balance Paradigm
Calories in/ Calories out model True but completely useless Example – crowded airport at March Break Too many people entering, too few people leaving is the cause of the crowding Key question is WHY? Accumulation of fat due to caloric imbalance “First Law of Thermodynamics” Cause of overeating/ underactivity is BEHAVIOURAL

16
Popular Theory www.kidneylifescience.ca
Easy to understand Appeals to American sense of self-determinism – it is your ‘choice’, ‘captain of your own ship’ Obesity is not a medical condition, but a psychological, character defect ‘low willpower’

17
Experts say… Eat Less and Exercise More
Joslin’s Diabetes Mellitus (2005) “reduction of caloric intake” is “the cornerstone of any therapy for obesity” However, from low calorie to very low calorie diets “none of these approaches has any proven merit” Handbook of Obesity (1998) “Dietary therapy remains the cornerstone of treatment and the reduction of energy intake continues to be the basis of successful weight reduction programs” Results of such diets are “known to be poor and not long-lasting” 2005 USDA Dietary Guidelines for Americans “eating fewer calories while increasing physical activity are the keys to controlling body weight”
 reduction of caloric intake is the cornerstone of any therapy for obesity However, from low calorie to very low calorie diets none of these approaches has any proven merit Handbook of Obesity (1998) Dietary therapy remains the cornerstone of treatment and the reduction of energy intake continues to be the basis of successful weight reduction programs Results of such diets are known to be poor and not long-lasting 2005 USDA Dietary Guidelines for Americans eating fewer calories while increasing physical activity are the keys to controlling body weight")
18
An easily tested hypothesis
Eat too much Personal Choice Behaviour Obesity Exercise too little Key Assumption – Caloric intake and expenditure are independent of each other

19
Elusive Benefits of Under-eating
Semi-starvation diets of cal/day “almost impossible to keep warm, even with an excessive amount of clothing” 30% decrease in metabolism Excess eating immediately after experiment - Weight regain 12 young men Decreases in BP, HR, inability to concentrate and marked weakness during physical activity reduced energy expenditure so much that if they ate more than 2100 calories/day – would start to regain weight Subjects lost weight, but constantly complained of hunger Carnegie Institution of Washington’s Nutrition Laboratory 1917

20
The Biology of Human Starvation
1570 calories per day Resting metabolic rates declined by 40 percent Heart volume shrank by 20 percent Heart rate slowed Body temperatures dropped Obsessive thoughts about food, binge eating 36 men put on a 24 weeks semi-starvation diet 1944 Ancel Keys University of Minnesota

21
Changes in Energy Expenditure
18 obese and 23 non obese subjects with a stable weight Fed a liquid diet of 40% fat, 45% carbohydrates and 15% protein Caloric intake adjusted until weight stable Subjects then measured for energy expenditure Changes in Energy Expenditure Resulting from Altered Body Weight Rudolph L. Leibel NEJM 1995 march 9, 332 (10);
;")
22
Response to weight change
Leibel RL et al. N Engl J Med 1995;332:

23
Reduced Energy Expenditure
Maintained weight loss of 10% over 1 year 21 Subjects fed liquid diet of 45% carbohydrates Measured total, resting and non resting energy expenditure Decreased energy expenditure Even 1 year after weight loss Long-term persistence of adaptive thermogenesis in subjects who have maintained a reduced body weight

24
Mean (±SE) Changes in Weight from Baseline to Week 62.
Hormonal Changes Mean (±SE) Changes in Weight from Baseline to Week 62. 50 patients given 10 weeks of 500 calorie liquid shakes (51% carbohydrates) Hormonal analysis after 1 year of weight loss Persistent increase in hunger signalling 1 year after weight loss Long-Term Persistence of Hormonal Adaptations to Weight Loss N Engl J Med 2011; 365: October 27, 2011 Sumithran P et al. N Engl J Med 2011;365:
 Changes in Weight from Baseline to Week patients given 10 weeks of 500 calorie liquid shakes (51% carbohydrates) Hormonal analysis after 1 year of weight loss. Persistent increase in hunger signalling 1 year after weight loss. Long-Term Persistence of Hormonal Adaptations to Weight Loss. N Engl J Med 2011; 365: October 27, Sumithran P et al. N Engl J Med 2011;365:")
25
Increased Hunger www.kidneylifescience.ca
Long term persistence of hormonal mediators of hunger after weight loss

26
Body Weight “Thermostat”
10% increase weight 16% increase Energy expended 10% decrease weight 15% decrease Energy expended Increased hormonal Signals of hunger Physiological changes aimed at increasing the ‘metabolic efficiency’ and fuel supply of the tissues at a time of energy deficit The body is smart!! Body fat is finely regulated Adaptions to weight loss: Reduced energy expenditure Increased hunger Weight Regain!

27
Caloric Reduction as Primary
Coal Power plant Storage

28
Eat less… www.kidneylifescience.ca
Randomized controlled trial 19,541 low-fat diet 29,294 usual diet started in 1993 50,000 women age enrolled Dietary counselling – goal to lower fat calories from 38% to less than 20% rich in fruits, vegetables and fibre Low-fat dietary pattern and weight change over 7 years: the Women's Health Initiative Dietary Modification Trial Howard BV et al. JAMA 2006; 295:39-49

29
Exercise more…

30
What happened? www.kidneylifescience.ca Normal Diet Eat Less
Exercise More

31
What happened? www.kidneylifescience.ca
Women should have lost 36 pounds of fat in the first year alone!

32
The Cruel Hoax www.kidneylifescience.ca
A perfect 35 year record unblemished by success Caloric deprivation triggers 2 adaptive mechanisms 1. Reduced energy output 2. Increased hunger Virtually all studies of ‘semi-starvation’ diets are remarkably similar and unsuccessful The Cruel Hoax of the low fat, calorie-restricted diet THEY DON’T WORK!

33
Vicious Cycle of Under-eating
Eat Less Calories Regain Weight Lose Weight Continues until it is intolerable – then we blame the victim Decreased Energy Expenditure Increased Hunger

34
The Overeating Paradox
Most famous of overeating studies done in late 1960’s by endocrinologist Ethan Sims Studied convicts at Vermont State Prison Initially raised food consumption to 4000 calories/ day gained some weight but then weight stabilized Ate up to 10,000 calories a day, while carefully controlling exercise Took 4-6 months to increase weight by 20-25% One man less than 10 pound weight gain Most returned to normal weight with surprising rapidity Metabolism increased by 50%

35
The Overfeeding Paradox
Overfed volunteers by 50% over 42 days followed by 6 weeks of monitoring 46% carbohydrate diet Metabolic response to experimental overfeeding in lean and overweight healthy volunteers Am J Clin Nutr Oct 1992;56(4): Diaz EO
: Diaz EO.")
36
The Overfeeding Paradox
Why didn’t they gain weight? Body is burning it off – increase in energy expenditure Metabolic response to experimental overfeeding in lean and overweight healthy volunteers Am J Clin Nutr Oct 1992;56(4): Diaz EO
: Diaz EO.")
37
Caloric Reduction www.kidneylifescience.ca
Weight Loss Eat Less Eat More Weight Gain Induces hunger and a compensatory decrease in energy expenditure Body weight acts as if it has an ‘set point’ Body acts as a thermostat NOT a scale Caloric deprivation is difficult because it is a fight against mechanisms which have evolved to precisely minimize its effects

38
The Ultimate Proof…

39
Exercise More… www.kidneylifescience.ca
1966 US Public Health Service advocated increased physical activity and diet as the best ways to lose weight 1980’s “new fitness revolution” led by running and aerobics “Experts” routinely claim that exercise is the key to weight loss

40
Exercise More… www.kidneylifescience.ca
Source: wholehealthsource.blogspot.ca

41
Exercise does not lead to increased weight loss
Completed health questionnaires every 6 months Prospective cohort study women Physical Activity and Weight Gain Prevention, Women’s Health Study JAMA 2010;303(12): Buring et al
: Buring et al.")
42
Exercise and Weight Loss
Age Average increase in weight loss over 3 years 0.12 kg Just over ¼ pounds weight loss in 3 years!! 3 years of 60 minutes per day, every day!! Reference Physical Activity and Weight Gain Prevention, Women’s Health Study JAMA 2010;303(12): Buring et al
: Buring et al.")
43
No Weight Loss www.kidneylifescience.ca
Randomized to 0, 72, 136, 194 min/wk exercise No change in dietary habits 24 week study duration 464 women Changes in Weight, Waist Circumference and Compensatory Responses with Different Doses of Exercise among Sedentary, Overweight Postmenopausal Women Church et al PLoS One (Public Library of Science) Feb 2009 Vol 4 #2 e4515 No difference in any of the group in weight lost!
 Feb 2009 Vol 4 #2 e4515. No difference in any of the group in weight lost!")
44
Minimal Weight Loss www.kidneylifescience.ca 6 days per week of 1 hour
Exercise Effect on Weight and Body Fat in Men and Women McTiernan et al, Obesity (2007) 15, 12 month randomised, controlled trial 6 days per week of 1 hour Results 1.4 kg! (3 pounds) – women 1.8 kg! (4 pounds) - men 102 men and 100 women – sedentary moderate – vigorous exercise At baseline average weight Women 78 kg (172 lbs) Men 96 kg (211 lbs)
 15, month randomised, controlled trial. 6 days per week of 1 hour. Results. 1.4 kg! (3 pounds) – women. 1.8 kg! (4 pounds) - men. 102 men and 100 women – sedentary. moderate – vigorous exercise. At baseline average weight. Women 78 kg (172 lbs) Men 96 kg (211 lbs)")
45
Marathons must work…. www.kidneylifescience.ca Results
Food intake and body composition in novice athletes during a training period to run a marathon International Journal of Sports Medicine, May 1989; 10(1 suppl.):S17-21 Janssen GM Results Men – average weight loss 5 pounds 9 women – no weight lost “no change in body composition was observed” Trained sedentary subjects to run marathon over 18 months
:S17-21 Janssen GM. Results. Men – average weight loss 5 pounds. 9 women – no weight lost. no change in body composition was observed Trained sedentary subjects to run marathon over 18 months.")
46
Compensation www.kidneylifescience.ca
Multiple studies lasting more than 25 weeks that average weight loss was only 30% of predicted* Possible mechanisms 1. Increased caloric intake 2. Decreased activity outside of prescribed exercise *Ross R et al Physical activity, total and regional obesity: dose-response considerations. Med Sci Sports Exerc 33: S Difference between actual weight loss and predicted weight loss called “compensation” Church et al 2009 PLos

47
PhysEd www.kidneylifescience.ca European Congress on Obesity 2009
Alissa Fremeaux Measured physical activity of 206 children aged 7-8 by accelerometer Averaged 9.2 hours per week of physical education in school No difference in total weekly activity “children who got a lot of PE time at school were compensating by doing less at home, while those who got very little PE time compensated by cranking up their activity at home, so that over the week, they all accumulated the same amount"

48
Compensation – mechanisms

49
Exercise More… www.kidneylifescience.ca
Baseline Energy Expenditure for 140 pound person: calories/day Caloric expenditure 45 minute walk (2 miles/hour): 102 calories – 4% of daily caloric intake BEE estimated to calories per pound In bed bound state caloric needs is (BEE) * 1.2 Majority of calories expended is NOT exercise but basal metabolic rate – mostly used in heating the body Why do we get so hungry after swimming? Why do patients on semi-starvation diets get cold?
: 102 calories – 4% of daily caloric intake BEE estimated to calories per pound. In bed bound state caloric needs is (BEE) * 1.2. Majority of calories expended is NOT exercise but basal metabolic rate – mostly used in heating the body. Why do we get so hungry after swimming Why do patients on semi-starvation diets. get cold")
50
Exercise is not the Key www.kidneylifescience.ca
WE SHOULD ALL GET EXERCISE But simply not that effective for weight loss Increase muscle tone Increase insulin sensitivity of muscles Decrease vascular disease Increased bone density Despite 40 years of constant and utter failure ‘experts’ still insist exercise is the key to weight loss 1. Burn surprising few calories with exercise – we focus on the 4% of daily caloric intake and ignore the 96% (Basal Metabolic Rate) 2. Compensation effects Increase in appetite Decreased other activity
 2. Compensation effects. Increase in appetite. Decreased other activity.")
51
Not True! Hypothesis Obesity www.kidneylifescience.ca Behaviour
Eat too much Behaviour Gluttony/ Sloth Obesity Exercise too little Not True!

52
Hormonal Obesity Theory
Insulin (cortisol)
")
53
An Easily tested hypothesis
High Insulin (cortisol) Levels Eat too much Obesity Exercise too little Implicit Assumptions Fat, like all body systems, are regulated under hormonal control Intake and Expenditure of calories are under hormonal control Hunger/ Basal metabolic Rate Intake and Expenditure of calories are linked to each other
 Levels. Eat too much. Obesity. Exercise too little. Implicit Assumptions. Fat, like all body systems, are regulated under hormonal control. Intake and Expenditure of calories are under hormonal control. Hunger/ Basal metabolic Rate. Intake and Expenditure of calories are linked to each other.")
54
Insulin – fattening agent
Insulin discovered in 1921 1923 clinicians successfully used insulin to fatten chronically underweight children 1930’s clinicians using it regularly in Europe and USA for pathologically underweight patients Often gained as much as 6 pound per week using insulin and meals “rich in carbohydrates”

55
I can make you fat… www.kidneylifescience.ca
The percentage of adult men (a) and women (b) with major weight gain (increase in BMI of more than 5 kg/m 2 ) receiving intensive (white bars) or conventional (black bars) insulin therapy in the DCCT. The overall pattern of differences over time was significant (p < 0.01) for both sexes (DCCT 2001). © 2001 Diabetes Care 2001, 24: 1711–172
 and women (b) with major weight gain (increase in BMI of more than 5 kg/m 2 ) receiving intensive (white bars) or conventional (black bars) insulin therapy in the DCCT. The overall pattern of differences over time was significant (p < 0.01) for both sexes (DCCT 2001). © 2001 Diabetes Care 2001, 24: 1711–")
56
Insulin and weight gain
Intensive control of type 1 DM in DCCT trial resulted in average 4.75 kg more weight gain Diabetes Control and Complications (DCCT) Trial Research Group. Influence of intensive diabetes treatment on body weight and composition of adults with type 1 diabetes in the Diabetes Control and Complications Trial. Diabetes Care 2001;24:
 Trial Research Group. Influence of intensive diabetes treatment on body weight and composition of adults with type 1 diabetes in the Diabetes Control and Complications Trial. Diabetes Care 2001;24:")
57
Weight gain during insulin therapy in patients with type 2 diabetes mellitus
Weight gain over time in type 2 diabetes patients undergoing intensive or conventional treatment with insulin or sulfonylureas. (The Lancet, vol. 352, 1998, pp. 837–853)
")
58
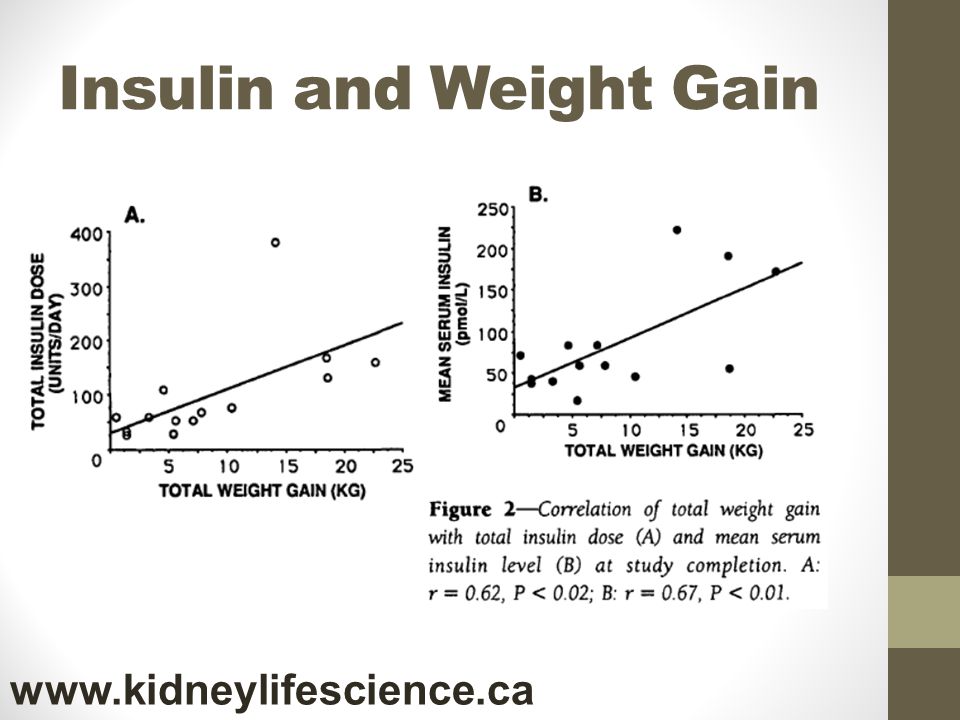
Insulin and Weight gain
14 DM2 patients treated with intensive insulin therapy At 6 months 100 units insulin/day Decrease of 300 calories/day Weight gain of 8.7 kg (19lbs)! Intensive Conventional Insulin Therapy for Type II Diabetes Diabetes Care 16:21-31 Henry RR
! Intensive Conventional Insulin Therapy for Type II Diabetes Diabetes Care 16:21-31 Henry RR.")
59
Insulin and Weight Gain
60
Insulin and Weight Gain
708 patients on oral hypo-glycemics who added insulin Increasing insulin dose leads to increased weight Addition of Biphasic, Prandial, or Basal Insulin to Oral Therapy in Type 2 Diabetes N Engl J Med 2007;357: Holman RR

61
Insulin Lipohypertrophy
‘Lipogenic’ effect of insulin – self injections of insulin can lead to masses of fat at site of injection Insulin acts through LPL (Lipoprotein Lipase) – and HSL (Hormone Sensitive Lipase)
 – and HSL (Hormone Sensitive Lipase)")
62
Insulin and oral hypoglycemics
The American Journal of Medicine 108, Issue 6, Supp 1, 17 April 2000, Pages 23–32 John Buse et al

63
Insulin and Weight Gain
Combination of insulin and dapaglifozin Change in Weight Change in daily dose of insulin Long-Term Efficacy of Dapagliflozin in Patients With Type 2 Diabetes Mellitus Receiving High Doses of Insulin: A Randomized Trial Ann Intern Med. 2012;156(6):
:")
64
Metformin is Weight Neutral
Metformin does not increase insulin levels Increases insulin sensitivity Is weight reduction related to its effect on blood glucose?

65
Januvia www.kidneylifescience.ca
DPP4 inhibitors increase glucose dependent insulin release

66
Dapaglifozin www.kidneylifescience.ca
24-wk multicenter, randomized, parallel-group, double-blind, placebo-controlled study 182 diabetic patients with T2DM SGLT2I vs placebo Effects of Dapagliflozin on Body Weight, Total Fat Mass, and Regional Adipose Tissue Distribution in Patients with Type 2 Diabetes Mellitus with Inadequate Glycemic Control on Metformin J Clin Endocrinol Metab 97: 1020–1031, 2012

67
Fat Loss www.kidneylifescience.ca
J Clin Endocrinol Metab 97: 1020–1031, 2012

68
Drugs that increase basal insulin
No Increase Insulin Sulfonylureas Glyburide Glicizide Metformin DPP IV inhibitors Januvia Onglyza Trajenta SGLT – 2 With exception of TZD class

69
Drugs that cause weight gain
Increase No Increase Insulin Sulfonylureas Glyburide Glicizide Metformin DPP IV inhibitors Januvia Onglyza Trajenta SGLT – 2

70
I can make you thin… www.kidneylifescience.ca
Type 1 diabetes Aretaeus’ classic description “Diabetes is …a melting down of the flesh and limbs into urine...” Lack of insulin leads to rapid loss of weight and fat Lose all fat! No matter how many calories are ingested Untreated and treated Type 1 Diabetes Mellitus

71
Diabulimia www.kidneylifescience.ca
Diabulimia (diabetes and bulimia) refers to an eating disorder in which people with Type 1 diabetes deliberately give themselves less insulin than they need, for the purpose of weight loss Well known in Type 1 DM community that a lack of insulin causes immediate and substantial weight loss
 refers to an eating disorder in which people with Type 1 diabetes deliberately give themselves less insulin than they need, for the purpose of weight loss. Well known in Type 1 DM community that a lack of insulin causes immediate and substantial weight loss.")
72
I can make you fat… www.kidneylifescience.ca
Excess cortisol result in weight gain Exogenous – steroids, prednisone Endogenous – Cushings syndrome ”the hallmark sign of Cushing's syndrome is accelerated weight gain” Excess fat deposition due to hormonal dys-regulation – not character defect (lack of willpower)
")
73
I can make you thin…. www.kidneylifescience.ca
“Most patients with Addison's disease experience fatigue, generalized weakness, loss of appetite and weight loss” Lack of cortisol results called Addison’s disease

74
Hormones are the Key! Eat too much Exercise too little
Insulin = Weight Cortisol = Weight What makes us fat? Eat too much Exercise too little Hormones! Obesity is a hormonal dis-regulation of fat! Insulin (cortisol)
")
75
Caloric Reduction As Primary
Eat too much Behaviour Gluttony/ Sloth Obesity Exercise too little Uninterrupted 35 year string of failure in treatment of obesity “a perfect record - unblemished by success” Belief in CRAP theory led to singular research focus on behavioural/ psychological issue (lack of willpower, overeating, lack of exercise) Entire generation of health professionals endorsing low fat caloric restriction as treatment
 Entire generation of health professionals endorsing low fat caloric restriction as treatment.")
76
Hormonal Theory of Obesity
High Insulin (cortisol) Levels Eat too much Obesity Exercise too little We do not get fat because we overeat We overeat because we get fat! Calories are primarily pushed into storage leaving inadequate amounts for energy expenditure – thus either increase caloric intake or decrease energy expenditure Overeating and under-activity are the result not the cause of obesity
 Levels. Eat too much. Obesity. Exercise too little. We do not get fat because we overeat We overeat because we get fat! Calories are primarily pushed into storage leaving inadequate amounts for energy expenditure – thus either increase caloric intake or decrease energy expenditure. Overeating and under-activity are the result not the cause of obesity.")
77
The Aetiology of Obesity
What is driving my insulin (cortisol) levels up? Answer – The fattening carbohydrates The absolutely crucial question in obesity is not how many calories am I eating Calories are largely irrelevant – increased caloric intake will be matched by increased caloric expenditure More calories in, more calories out Fattening Carbohydrates Over-eating Under-activity High Insulin Levels Obesity
 levels up Answer – The fattening carbohydrates. The absolutely crucial question in obesity is not how many calories am I eating. Calories are largely irrelevant – increased caloric intake will be matched by increased caloric expenditure. More calories in, more calories out. Fattening. Carbohydrates. Over-eating. Under-activity. High Insulin. Levels. Obesity.")
78
Banting’s understanding
Fattening Carbohydrates Obesity Fattening Carbohydrates Increased Insulin Levels Obesity

79
Obesity Set Point www.kidneylifescience.ca
Insulin tells the body to get fat – calories and energy expenditure are adjusted to meet that goal Insulin adjusts the “body weight setpoint” Body acts as a thermostat not a scale

80
The Practice of Endocrinology 1951
Food to be avoided: 1. Bread, and everything else made with flour 2. Cereals, including breakfast cereals and milk puddings 3. Potatoes and all other white root vegetables 4. Foods containing much sugar 5. All sweets You can eat as much as you like of the following foods: 1. Meat, fish, birds 2. All green vegetables 3. Eggs, dried or fresh 4. Cheese 5. Fruit, if unsweetened, except bananas, and grapes

83
Increasing Grain consumption
Per Capita Grain consumption

84
Women’s Health Study - Results

85
Is Weight Gain related to change in blood glucose?
Postgraduate Medicine: Volume 124 No. 4 Pencek et al Pooled data from 7 randomized trials

Similar presentations


. OR FAT WEIGHT COMPARED TO FAT FREE WEIGHT BODY WEIGHT = 200 LBS. %BODY FAT.>")