Download presentation
Presentation is loading. Please wait.

1
Evidence for Complex Causes
Evidence and Causality in the Sciences University of Kent 5-7 September 2012 Evidence for Complex Causes Sandra D Mitchell Department of History and Philosophy of Science University of Pittsburgh Title: Evidence of Complex Causes Abstract: Complex causal structures pose special problems for standard methods of eliciting causal knowledge from experiment and observation. In this talk I will outline several such problems stemming from robustness and the role of "context" in the the dynamic stabilization characteristic of causation in complex biological systems.

2
Complex causality Multiple contributing causes (at multiple levels)
Interactions among causes Self-organization (feedback and feed forward) Inhibition and excitation Robustness Context sensitivity (contributions of non-modeled causes)
 Inhibition and excitation. Robustness. Context sensitivity (contributions of non-modeled causes)")
3
Complex causality Multiple contributing causes (at multiple levels)
Interactions among causes Self-organization (feedback and feed forward) Inhibition and excitation Robustness Context sensitivity (contributions of non-modeled causes) 'robustness is a property that allows a system to maintain its functions against internal and external perturbations.’ Kitano 2004
 Inhibition and excitation. Robustness. Context sensitivity (contributions of non-modeled causes) robustness is a property that allows a system to maintain its functions against internal and external perturbations.’ Kitano")
4
Robust AND Fragile Robust output/functional stability in response to to large variations in environment and component parts at the same time… Fragile, often catastrophically so, to cascading failures events The HOT model argues that systems that have evolved to have a higher level of complexity are optimized for specific perturbations but, at the same time, are also inevitably extremely fragile against unexpected perturbations (Carlson and Doyle, 1999, 2002).
.")
5
Robustness Trade-offs
Robustness trade-offs. (A) If robustness is strictly conserved, then any increase in robustness for specific perturbation shall be compensated by increase in fragility elsewhere. Left panel is a profile of robustness of a hypothetical system that responds equally to perturbations of each feature (from g1 to g6). Now, if the system is tuned to cope better with perturbations of a subset of features (g1, g2, and g3), then robustness against other subset of perturbations are significantly reduced (right panel). Total robustness of both systems over this perturbation space remains equal. (B) If the robustness-performance trade-off holds, a system that is tuned to attain high performance might be less robust than a system with moderate performance but a higher level of robustness. Let's assume Ya=fa(0) for system A where f(0) is the performance of the function of the system under perturbation '0' (no perturbation) and Ra is the robustness of the system over some defined perturbations. Although the figure simply refers to the colored areas for ease of understanding, the exact Ra needs to be calibrated based on Equation (1). The horizontal dashed lines indicate the threshold under which the system fails to perform the function considered. A robustness-performance trade-off would then imply that YaRa=YbRb. (C) Identical circuits with slightly difference resource use are shown. Both use NFB loop, but one uses only one resistor in the loop, whereas the other one uses two resistors in parallel. Parallel use of components significantly improves robustness of the system against component failure, but requires more resources. Here, the probability of degradation of system function can be computed using basic equations from reliability engineering so that the difference of robustness can be derived for simple example like this one
 If robustness is strictly conserved, then any increase in robustness for specific perturbation shall be compensated by increase in fragility elsewhere. Left panel is a profile of robustness of a hypothetical system that responds equally to perturbations of each feature (from g1 to g6). Now, if the system is tuned to cope better with perturbations of a subset of features (g1, g2, and g3), then robustness against other subset of perturbations are significantly reduced (right panel). Total robustness of both systems over this perturbation space remains equal. (B) If the robustness-performance trade-off holds, a system that is tuned to attain high performance might be less robust than a system with moderate performance but a higher level of robustness. Let s assume Ya=fa(0) for system A where f(0) is the performance of the function of the system under perturbation 0 (no perturbation) and Ra is the robustness of the system over some defined perturbations. Although the figure simply refers to the colored areas for ease of understanding, the exact Ra needs to be calibrated based on Equation (1). The horizontal dashed lines indicate the threshold under which the system fails to perform the function considered. A robustness-performance trade-off would then imply that YaRa=YbRb. (C) Identical circuits with slightly difference resource use are shown. Both use NFB loop, but one uses only one resistor in the loop, whereas the other one uses two resistors in parallel. Parallel use of components significantly improves robustness of the system against component failure, but requires more resources. Here, the probability of degradation of system function can be computed using basic equations from reliability engineering so that the difference of robustness can be derived for simple example like this one.")
6
Robustness is achieved by building barriers to cascading failures
This often requires complicated internal structure, layers of feedback, signaling, regulation… Greater genetic complexity = more parts, more structure, more interactions Molecular biology has focused on biological simplicity, what are the entities (genes) and how do they individually contribute to causing a phenotype. Systems biology focuses on biological complexity, what are the networks, what are alternative pathways with alternative entities generating the same outcome. Robust systems can have sloppier parts.
 and how do they individually contribute to causing a phenotype. Systems biology focuses on biological complexity, what are the networks, what are alternative pathways with alternative entities generating the same outcome. Robust systems can have sloppier parts.")
7
Cell Temp cell Temp environ Unfolded Proteins Folded Proteins Network
failure Loss of Protein Function Cell Death Aggregates Folded Proteins Unfolded Proteins Temp cell Temp environ

8
The cell builds “barriers” to stop this cascading failure event.
Network failure Loss of Protein Function Cell Death The cell builds “barriers” to stop this cascading failure event. Aggregates Folded Proteins Unfolded Proteins Temp cell Temp environ

9
Heat shock response involves complex feedback and feedforward control.
Refold denatured proteins Heat shock response involves complex feedback and feedforward control. Unfolded Proteins Temp cell Folded Proteins Temp environ

10
Complexity and Robustness
How complex systems are less fragile to high-order perturbations. Biological processes are often modeled as networks of interacting components that generate output responses based on input conditions. For a trivially simple system with a single pathway and no feedback, removing a single node will eliminate all output, so applying additional deletions will yield no synergistic responses. Networks that have more redundancy provide opportunities for synergy because cutting off alternative pathways or feedbacks can lead to lower output levels. If we monitor the output response as well-chosen nodes are successively removed from the network, the output should be only weakly affected until it reaches a ‘combination order of fragility’ (COF), where all available alternative pathways have been blocked.
, where all available alternative pathways have been blocked.")
11
sampling to make the most of dose responses (Greco et al, 1995)
sampling to make the most of dose responses (Greco et al, 1995). A factorial design, where all permutations of serially diluted single-agent doses are tested, makes very few assumptions about the response surface shape, but is prohibitively expensive for high-order combinations. A more efficient format is to test fixed dose ratio responses, by mixing the component drugs at a high concentration (e.g. twice their 50% effective concentrations, or the highest achievable concentration for singly inactive compounds) and serially diluting that mixture. If response curves are collected for all submixtures of any high-order combination as part of a systematic experiment, there will be sufficient information to fully describe most high-order synergies and antagonisms. Most synergy measures compare a combination’s response to those of the constituent single agents (Greco et al, 1995). For genetic interactions, synergy is measured by comparing the combined effect to a model that represents the expectation for non-interaction (Anastassiou, 2007; Mani et al, 2008). For chemical combinations, synergy can be measured either as a high concentration effect boost using one of the genetic interaction models, or as a potency shift at a chosen effect level (Chou and Talalay, 1984; Leha´r et al, 2007). These definitions generalize readily to high-order combinations and can be used to quantify the ‘absolute synergy’ of a combination compared to its single agents (see Figure 2). Although there is considerable debate concerning which null-interaction modelis most generally applicable to biological contexts (Chou and Talalay, 1984; Greco et al, 1995; Leha´r et al, 2007; Mani et al2008), all of them permit the calculation of an absolute synergy score as described here. At high order, it is also useful to consider the ‘differential synergy’ (Figure 2) that measures the extra benefit gained by increasing the combination order.Differential synergy can be calculated from the differences between an mth order combination’s synergy score and t hose on its (m1)th order submixtures, and should peak at the combination order where the system becomes fragile and the absolute synergy increases most rapidly. Finally, efficient sampling methods are needed to explorethe vast space of possible high-order combinations. Comprehensively testing all pairs of 10 perturbers and their singleagents would require only 55 tests, but that number grows to 845 up to sixth order, and for 20 perturbations there are over permutations up to sixth order. High-throughput experimental testing should enable screens on that scale(Zimmermann et al, 2007), but it will be some time before comprehensive coverage at higher order or for more than 20 agents is feasible. It is still possible, however, to sample such high-order spaces using informed searching methods. For example, one strategy is to employ an iterative maximal damage search (Agoston et al, 2005) where each perturber is first tested alone and the most effective agent is combined and tested with all the other agents. Higher orders are tested by Box 1 To illustrate how the combination order of fragility (COF) depends on system complexity, we used a simple simulation of graphs with looped topology. A family of networks with the same number of nodes but increasing numbers of loops can be created using a modified attachment algorithm (Baraba´ si and Albert 1999), starting with a single closed loop and randomly connecting both ends of fixed-length linear ‘pathways’ to the existing network. Such networks can be tested for vulnerability to dismemberment by deleting a set of nodes M and measuring the average distance dM . Pfi;jg di;j=N between nodes in network fragments, where N is the number of distinct node pairs {i,j}, and di,j is the number of steps along the shortest path between nodes i and j, excluding node pairs acros s fragments. The integrity of perturbed network can be assessed by calculating the ratio betweend¯ M and the correspondingd¯ 0 for the unperturbed network. Using this procedure to generate 100-node networks with 1 through 32 loops (left), and applying a maximal damage algorithm that selects the most disruptive node at each order for the next set of combined deletions (Agoston et al, 2005), the robustness to high-order perturbations shows a clear trend with system complexity. Simple networks are rapidly disrupted by second- or third-order combinations, whereas networks with many loops are steadily eroded at slower rates. Networks with intermediate levels of complexity are able to maintain integrity under low-order attacks, but are rapidly dismembered once the combination order exceeds a critical level related to the network’s level of redundancy. Note that these networks are robust not only to the removal of random peripheral nodes but also to the removal of the highly connected central nodes until the COF has been exceeded. More realistic simulations would require a biologically relevant modeling approach (e.g. flux balance analysis; Segre` et al, 2005), but are likely to find similar trends. Box 1 How fragility to combined perturbations depends on system complexity Synergy and robustness J Leha´r et al & 2008 EMBO and Nature Publishing Group Molecular Systems Biology
. A factorial design, where all permutations of serially diluted single-agent doses are tested, makes very few assumptions about the response surface shape, but is prohibitively expensive for high-order combinations. A more. efficient format is to test fixed dose ratio responses, by mixing the component drugs at a high concentration (e.g. twice. their 50% effective concentrations, or the highest achievable concentration for singly inactive compounds) and serially. diluting that mixture. If response curves are collected for all submixtures of any high-order combination as part of a. systematic experiment, there will be sufficient information to fully describe most high-order synergies and antagonisms. Most synergy measures compare a combination’s response to those of the constituent single agents (Greco et al, 1995). For. genetic interactions, synergy is measured by comparing the combined effect to a model that represents the expectation for. non-interaction (Anastassiou, 2007; Mani et al, 2008). For chemical combinations, synergy can be measured either as a. high concentration effect boost using one of the genetic interaction models, or as a potency shift at a chosen effect level. (Chou and Talalay, 1984; Leha´r et al, 2007). These definitions generalize readily to high-order combinations and can be used. to quantify the ‘absolute synergy’ of a combination compared to its single agents (see Figure 2). Although there is. considerable debate concerning which null-interaction modelis most generally applicable to biological contexts (Chou and. Talalay, 1984; Greco et al, 1995; Leha´r et al, 2007; Mani et al2008), all of them permit the calculation of an absolute synergy. score as described here. At high order, it is also useful to consider the ‘differential synergy’ (Figure 2) that measures the. extra benefit gained by increasing the combination order.Differential synergy can be calculated from the differences. between an mth order combination’s synergy score and t hose on its (m1)th order submixtures, and should peak at the. combination order where the system becomes fragile and the absolute synergy increases most rapidly. Finally, efficient sampling methods are needed to explorethe vast space of possible high-order combinations. Comprehensively. testing all pairs of 10 perturbers and their singleagents would require only 55 tests, but that number grows to. 845 up to sixth order, and for 20 perturbations there are over permutations up to sixth order. High-throughput. experimental testing should enable screens on that scale(Zimmermann et al, 2007), but it will be some time before. comprehensive coverage at higher order or for more than 20 agents is feasible. It is still possible, however, to sample such. high-order spaces using informed searching methods. For example, one strategy is to employ an iterative maximal. damage search (Agoston et al, 2005) where each perturber is first tested alone and the most effective agent is combined and. tested with all the other agents. Higher orders are tested by Box 1 To illustrate how the combination order of fragility (COF) depends on system complexity, we used a simple simulation of graphs with looped topology. A family of networks with the same number of nodes but increasing numbers of loops can be created using a modified attachment algorithm (Baraba´ si and Albert. 1999), starting with a single closed loop and randomly connecting both ends of fixed-length linear ‘pathways’ to the existing network. Such networks can be tested for vulnerability to dismemberment by deleting a set of nodes M and measuring the average distance dM . Pfi;jg di;j=N between nodes in network fragments, where N is the number of distinct node pairs {i,j}, and di,j is the number of steps along the shortest path between nodes i and j, excluding node pairs acros s fragments. The integrity of perturbed network can be assessed by calculating the ratio betweend¯ M and the correspondingd¯ 0 for the unperturbed network. Using. this procedure to generate 100-node networks with 1 through 32 loops (left), and applying a maximal damage algorithm that selects the most disruptive node at. each order for the next set of combined deletions (Agoston et al, 2005), the robustness to high-order perturbations shows a clear trend with system complexity. Simple networks are rapidly disrupted by second- or third-order combinations, whereas networks with many loops are steadily eroded at slower rates. Networks. with intermediate levels of complexity are able to maintain integrity under low-order attacks, but are rapidly dismembered once the combination order exceeds a. critical level related to the network’s level of redundancy. Note that these networks are robust not only to the removal of random peripheral nodes but also to the. removal of the highly connected central nodes until the COF has been exceeded. More realistic simulations would require a biologically relevant modeling. approach (e.g. flux balance analysis; Segre` et al, 2005), but are likely to find similar trends. Box 1 How fragility to combined perturbations depends on system complexity. Synergy and robustness. J Leha´r et al. & 2008 EMBO and Nature Publishing Group Molecular Systems Biology")
12
Robustness and Woodward causes
Invariance Is a relation between purported cause variable and effect variable over some range of values of the cause variable (not necessarily universal) Modularity or Separability Is a relation of independent disruptability or contribution to overall effect of casual components of a system with multiple invariant causal functions. Insensitivity Stability of causal relation across variations in background, context, or conditions external to system.
 Modularity or Separability. Is a relation of independent disruptability or contribution to overall effect of casual components of a system with multiple invariant causal functions. Insensitivity. Stability of causal relation across variations in background, context, or conditions external to system.")
13
Modularity “..this is implicit in the way people think about causation…this sort of independence is essential to the notion of causation. Causation is connected to manipulability and that connection entails that separate mechanisms are in principle independently disruptable.” (Hausman and Woodward 1999) What if they are not?
 What if they are not")
14
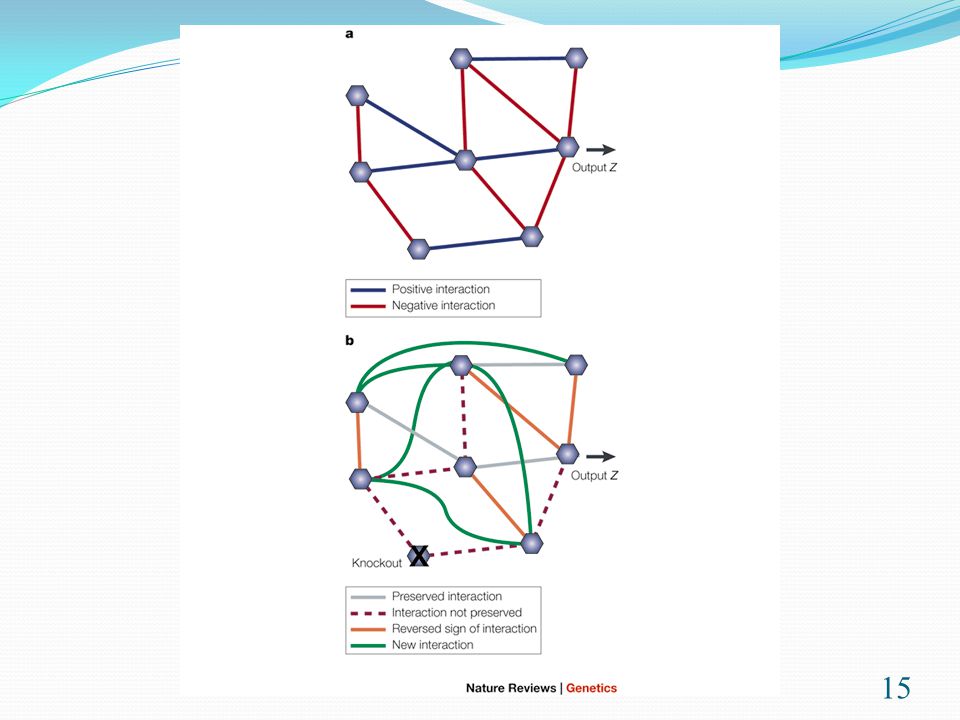
Genetic knock-out experiments
Principle assumption: normal function of a gene can be inferred directly from its mutant phenotype. “If you give me a gene, I could knock it out and tell you what its function is” Mario Capecchi (co-developer of knock out technique)
")
16
What does the evidence support? What is the cause of a phenotype Z?
Is the gene the wrong entity to identify as the cause of the phenotype? Sometimes the very presence of a particular gene is what makes the difference! Sometimes the presence of a particular gene makes no difference at all – rather it is the robust network of multiple pathways – the system – that is the cause. If independent disruptability is essential to causality – then evidence says – the gene is not a cause. But in Robust Causation – get phenotype by means of alternative pathways making up the networkn– the gene IS part of a the network.

17
Robustness and Mechanism Causes
“Mechanisms are entities and activities organized such that they are productive of regular changes from start or set-up to finish or termination conditions” MDC In robust gene regulatory networks –what are the entities and what are the activities? How regular are the changes?

18
Mechanism and Organization
“Organization is the final element in the explanation. We identify a phenomenon to be explained, and discover the entities and activities relevant to that phenomenon. Finally we discover what kinds of relations the entities and activities stand in that produces that phenomenon.” “The overall conclusion of this paper is that the kinds of parts that should be sought, and the kinds of relations among them that explain phenomena, are empirical discoveries. Much detail about relevant parts and relations will be particular to a domain, or particular to a mechanism.” Illari and Williamson

19
Robust Networks What does the empirical evidence support?
Entities = genes Activities = transcription, translation Organization = ? Which diagram? Both? Mechanism approach places the “entity” at the center of causal explanation – Robustness makes the entity non-essential to causal production.

20
Robust Causality Single controlled experiments can fail to isolate the entities whose presence/activity cause the phenomenon of interest. Robustness is a feature of a system that demotes entities from causal priority and replaces them with a network of Multiple alternative pathways Dynamic responsiveness to perturbation

21
Evidence for Robust Causation
Empirical evidence supports robustness –but it is hard to get. Double and triple knock out experiments – can begin to determine network structure. There is a “growing appreciation that biological systems are best manipulated not by targeting a single protein, but by modulating the set of many nodes that can selectively control a system's functional state.” Mol Syst Biol. 2008; 4: 215. Published online 2008 August 5. doi: /msb PMCID: PMC High-order combination effects and biological robustness Joseph Lehár,1,2,a Andrew Krueger,2 Grant Zimmermann,1 and Alexis Borisy1

22
Why is Robust Causation important?
Clinical experience shows that drug combinations can be more effective than single agents, especially for resistant bacteria, viruses, and many cancers, where combinations have become the main treatment strategy. In vitro studies of resistant bacteria show that third-order combinations are more effective than drug pairs, and clinical regimens for resistant tuberculosis or AIDS infections routinely require more than two drugs together. agents (Zimmermann et al, 2007) (Walsh, 2000) (Bonhoeffer et al, 1997(Dancey and Chen, 2006) \ (Bhusal et al, 2005)
 (Walsh, 2000) (Bonhoeffer et al, 1997(Dancey and Chen, 2006) \ (Bhusal et al, 2005)")
23
Conclusion Robust causation presents conceptual challenges for both Woodward causal explanation and Mechanism causal explanation Role of evidence is not neutral – i.e. not JUST an empirical matter what role organization plays in causal explanation. Woodward Causes – if stick to modularity requirement – causal pathways that are PART of robust network are not causal – not independently disruptable Mechanism Causes – if E+A+O generates a cause – then robust networks have MANY causes – many mechanisms – this does not capture the evolution, maintenance and intervention on robust systems.

Similar presentations


>")
