Download presentation
Presentation is loading. Please wait.

1
System Engineering & Economy Analysis
Lecturer Maha Muhaisen College of Applied Engineering& Urban Planning

2
Lecture (2) Decision making process, include :
- Rational Decision making - Decision making for current cost - Examples

3
Decision making process
It is the choosing from alternatives, but is this enough for definition?

4
Rational Decision Making
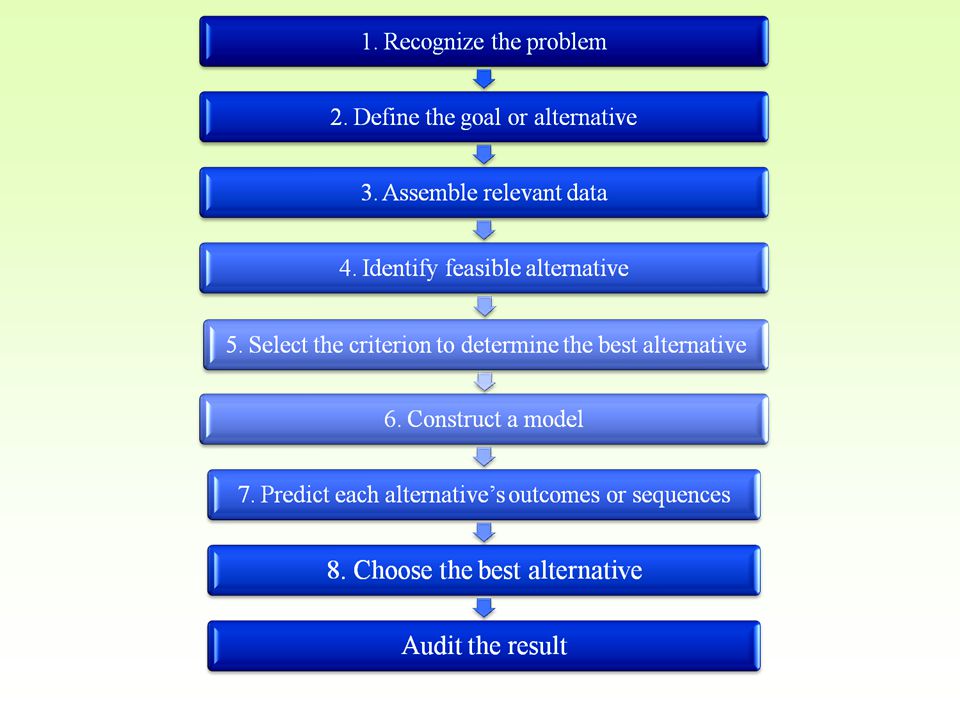
Rational decision making is a complex process that contain nine essential elements. Although those nine steps are shown sequentially it is common for decision making to repeat the steps. All those steps is required and shown in a logical order.

6
1- Recognize the problem
Recognition of the problem is obvious and immediate Many firms establish programs for total quality management (TQM) or continuous improvement that are designed to identify the problems, so that they can be solved.
 or continuous improvement that are designed to identify the problems, so that they can be solved.")
7
2- Define the Goal or objective
The goal can be a grand, overall goal of a person or a firm. The presence of multiple goal is often foundation of complex problem. But the objective need not to be a grand but the overall objective may be specific and narrow. “I want to pay a load by may” So defining the objective is the act of exactly describing the task and goal

8
3- Assemble of relevant data
Good decision good information Some data are available immediately at little or no cost, but still other require survey, or consulting with specific knowledgeable people Time horizon is part of data as how long equipment, building will last? Accounting system is of important source of data Financial and cost accounting are designed to show accounting values and the flow of money (cost & benefit) What are the cost that related to specific operation , those indirect (overhead) cost, that usually allocated to operations, those may be satisfactory for cost –accounting purposes, but may be unreliable for economic analysis. To understand the meaningful analysis see the following example :
 What are the cost that related to specific operation , those indirect (overhead) cost, that usually allocated to operations, those may be satisfactory for cost –accounting purposes, but may be unreliable for economic analysis. To understand the meaningful analysis see the following example :")
9
Example The cost accounting records of a large company show the avg. monthly costs for the three persons printing dep. The wages of the three dep. members and benefits such as vacation, sick leave, make up the first category of the direct labor. The company’s indirect or overhead costs – such heat , electricity, …etc must be distributed to its various departments in some manner , this one uses floor space as basis for its allocations Direct labor cost $6000 Material and supplies consumed $7000 Allocated overhead costs 200m2 of the floor area at $25/m $5000 The total $ 18000 The printing dep. charges other dep. for its services to cover 18,000$ monthly cost. For example , the charge to run 1000 copies of an announcement is : Direct labor $ Material and supplies $ Over head Cost to other dep.s $

10
Cont. The shipping dep. checks with a commercial printer which would print 1000 copies for $ although the shipping dep. needs only about 30,000 copies printed a month, its Forman decision to stop printing dep. and have work done by outside printer. The manger has asked to study situation and recommend what should be done. Solution : Printing dep. Outside Printer 1000 copies 30,000 copies Direct cost $ 7.6 $ Material and supplies 9.8 294.00 $ 22.95 $ 688.5 overhead 9.05 271.5 Total $ 26.45 $ 793.5 $

11
Cont. The firm will save $ 294 in material and may or may not save $ 228 in direct labor if printing dep. no longer does the shipping dep. work. The max. saving will be = $ 522 But if the shipping dep. Is permitted to obtain its printing from outside, the firm will be 688.5$ a month. The saving from not doing the shipping dep. work in printing de. Would not exceed $ 522 and it is probably would be $ 294 The result would be a net increase in cost to firm. For this reason it is not encouraged to print outside. Data cost gathering present other difficulty. One way to look at financial consequences , cost-benefit, of various alternative : Market consequences : raw material, machinery cost, ..etc. Extra market consequences : (shadow prices) as cost of employee injury,…ect. Intangible consequences : numerical analysis probably never fully describe the difference between alternative. As how does one evaluate the potential loss of worker’s job due to automation ?
 as cost of employee injury,…ect. Intangible consequences : numerical analysis probably never fully describe the difference between alternative. As how does one evaluate the potential loss of worker’s job due to automation")
12
4. Identify feasible alternative
There is no way to ensure the best alternative is listed among the alternatives considered. Sometime a group of people considering alternative in an innovative atmosphere ( brainstorming) can be helpful Any good listing of alternative will produce both practical and impractical solutions. Only feasible alternative are retained for further analysis.
 can be helpful. Any good listing of alternative will produce both practical and impractical solutions. Only feasible alternative are retained for further analysis.")
13
5. Select the criterion to determine the best alternative
To choose the best alternative , we must define what we mean by best. Criterion or set of criteria must be judged. Worst – Bad – Fair – Good – Better – Best Several possible criteria are : create the least disturbance to the environment Improve the distribution of the wealth among people. Minimize the expenditure Ensure that benefit greater that losses Minimize the time to achieve the goal Minimize unemployment Maximize profit Maximize profit is normally selected in engineering decision . When it is used all problems fall into one of the three categories : fixed output , fixed input, or neither input nor output.

14
Cont. Fixed input : the amount of money or other input resources (like labor, material, or equipment) . The objective is no effectively utilize them. Example : A project engineer has a budget of 350,000$ to renovate a portion of petroleum refinery. For ecom\nomic efficiency, the appropriate criterion is to maximize benefits or outputs. Fixed output : there is a fixed task (or other output objectives / results) to be accomplished Example: Civil engineer firm has been given a job of surveying land and preparing a record of survey map. purchasing a car without any optional equipment.
 to be accomplished. Example: Civil engineer firm has been given a job of surveying land and preparing a record of survey map. purchasing a car without any optional equipment.")
15
Cont. Neither input nor output fixed : It is the general situation, whereas the amount of money or inputs is not fixed, nor is the amount of benefits or other output. Example: A consulting eng. Firms has a lot of work, and paying for the staff for evening works to increase the amount of design work. In this category, maximize the benefit is the criterion, since the difference between input and output is simply the profit.

16
Maximize benefit or other outputs Fixed output
Cont. Category Economic Criterion Fixed input Maximize benefit or other outputs Fixed output Minimize the costs or other inputs Neither input nor output Maximize (benefits or, other output minus costs or other input) or stated another way, maximize profit.
 or stated another way, maximize profit.")
17
6. Constructing the model
Putting various elements together (objective, relevant data, feasible alternatives, and selection criteria) Relationship between the elements called model building or constructing model. To an engineer, the model is a mathematical equations.
 Relationship between the elements called model building or constructing model. To an engineer, the model is a mathematical equations.")
18
7. Predicting the outcomes for each alternative.
Each alternative might produce a variety of outcomes. Studying each alterntive and outcomes for eveyone.

19
8. Choose the best alternative
The selection of the feasible alternative may be key item, with the rest of the analysis a methodical process leading to predictable decision.

20
9. Audit the results It the comparison of what happened against predication. Do the results of decision agree with its predications? The audit help ensure that projected operating advantages are ultimately obtained. On other hand, the economic decision may be unjustifiably optimistic.

21
Example A concrete aggregate mix is required to contain at least 31% sand by volume for proper batching. One source of material, which has 25% sand and 75% coarse aggregate, sells for $3 per cubic meter (m3). Another source, which has 40% sand and 60% coarse aggregate, sells for $4.40/m3. Determine the least cost per cubic meter of blended aggregates. Solution : The least cost of blended aggregates will result from maximum use of the lower-cost material. The higher-cost material will be used to increase the proportion of sand up to the minimum level (3 1%) specified. Let x = Portion of blended aggregates from $3.00/m3 source 1 - x = Portion of blended aggregates from $4.40hi3 source Sand Balance X(0.25) + (1 -x)(0.40) = 0.31 0.25x x = 0.31 0.31 – = Thus the blended aggregates will contain : 60% of $3.0m3 material, 40% of $4.40/m3 material The least cost per cubic meter of blended aggregates is: 0.6($3.00)+ 0.4($4.4) = = $3.56 / m3
. Another source, which has 40% sand and 60% coarse aggregate, sells for $4.40/m3. Determine the least cost per cubic meter of blended aggregates. Solution : The least cost of blended aggregates will result from maximum use of the lower-cost material. The higher-cost material will be used to increase the proportion of sand up to the minimum level (3 1%) specified. Let x = Portion of blended aggregates from $3.00/m3 source. 1 - x = Portion of blended aggregates from $4.40hi3 source. Sand Balance. X(0.25) + (1 -x)(0.40) = x x = – 0.4 = Thus the blended aggregates will contain : 60% of $3.0m3 material, 40% of $4.40/m3 material. The least cost per cubic meter of blended aggregates is: 0.6($3.00)+ 0.4($4.4) = = $3.56 / m3.")
Similar presentations


 2002 Contemporary Engineering Economics 1 Chapter 3 Cost Concepts and Behaviors General Cost Terms Classifying Costs for Financial Statements Cost.>")
