Download presentation
Presentation is loading. Please wait.

1
A PRESENTATION TO GREEK SHIPPING COMMUNITY
Best Fuel Purchase Practices, Energy Management and Asset Protection – An attempt to quantify benefits MARPOL ANNEXE VI – AN UPDATE

2
BEST FUEL AND LUBE PURCHASE PRACTICES – ENERGY MANAGEMENT AND ASSET PROTECTION- AN ATTEMPT TO QUANTIFY THE BENEFITS Bunker Industry Overview and Potential for savings Quantification of savings through Bunker Quantity Surveys, ROB Surveys and Sludge Surveys Holistic View of Bunker Fuel Performance including Bunker Purchase Efficiency - Saving Millions Algorithms to Identify Problem Fuels saving marine machinery from major breakdown expenses Spending less $ through best Fuel and Lube management – Energy Efficiency and Asset Protection Total Lube Management – Quantifying $ Benefits Scrubbers – A new simplified low cost regulations compliant design

3
INTRODUCTION TO BUNKER INDUSTRY - GLOBAL AND IN SINGAPORE
GLOBAL BUNKERING – 230 MILLION MT HFO AND 70 MILLION MDO VALUE - $240 BILLION ((HFO $700/MT, MDO $1200/MT, AVERAGE TAKEN AS $800/MT) SINGAPORE QUANTITY BUNKERED IN SINGAPORE > 40 MILLION MT THE EFFECT OF WATER WATER CONTENT IS 0.16% AGAINST 0.06% IN JAPAN 0.1% OF WATER = 40,000 MT = $32 MILLION !
 SINGAPORE QUANTITY BUNKERED IN SINGAPORE > 40 MILLION MT THE EFFECT OF WATER WATER CONTENT IS 0.16% AGAINST 0.06% IN JAPAN 0.1% OF WATER = 40,000 MT = $32 MILLION !")
4
INTRODUCTION TO BUNKER INDUSTRY - GLOBAL AND IN SINGAPORE
THE EFFECT OF DENSITY DIFFERENCE EVEN FOR DENSITY DIFFERENCE BETWEEN BDN (SAY 990) AND LAB DENSITY (980), IT IS 10 MT PER 1,000 MT. IN SINGAPORE, THIS COMES TO 400,000 MT = $320 MILLION THE EFFECT OF QUANTITY SURVEY SHORTAGE ASSUMING 40,000 BUNKERINGS AT 1,000 MT EACH AND 10 MT LOST PER BUNKERING = 400,000 MT LOST DUE TO QUANTITY SUPPLY SHORTAGE = $320 MILLION !! ADD UP THESE LOSES AND IN SINGAPORE ALONE THE LOSS IS NEARLY $672 MILLION HOW TO REDUCE THESE LOSSES?
 AND LAB DENSITY (980), IT IS 10 MT PER 1,000 MT. IN SINGAPORE, THIS COMES TO 400,000 MT = $320 MILLION. THE EFFECT OF QUANTITY SURVEY SHORTAGE. ASSUMING 40,000 BUNKERINGS AT 1,000 MT EACH. AND 10 MT LOST PER BUNKERING = 400,000 MT LOST DUE TO QUANTITY SUPPLY SHORTAGE = $320 MILLION !! ADD UP THESE LOSES AND IN SINGAPORE ALONE THE LOSS IS NEARLY $672 MILLION. HOW TO REDUCE THESE LOSSES")
5
QUANTIFICATION OF SAVINGS FOR BQS, ROB AND SLUDGE SURVEYS
# SERVICE NATURE OF PROBLEM $700/MT COST OF SERVICE 1 BQS - Quantity Shortage 30 MT $21,000 $1,000 2 BQS - Density Differential 3000 X ( ) = 30 MT included in #1 3 BQS - Water Differential 3000 X ( ) = 3 MT $2,100 4 Remaining on Board (ROB) 30 days X 2 MT/day = 60 MT $42,000 5 Sludge Survey (SS) 3000 X 0.5% = 15 MT $10,500 Savable Loss in 30 day voyage $96,600 Total Cost of Service about $3,000 Assumptions: 1 Bunkering Stem = 3,000 MT of HFO used up in a 30 day voyage.
 = 30 MT. included in #1. 3. BQS - Water Differential X ( ) = 3 MT. $2, Remaining on Board (ROB) 30 days X 2 MT/day = 60 MT. $42, Sludge Survey (SS) 3000 X 0.5% = 15 MT. $10,500. Savable Loss in 30 day voyage. $96,600. Total Cost of Service. about $3,000. Assumptions: 1 Bunkering Stem = 3,000 MT of HFO used up in a 30 day voyage.")
6
WHY BQS? Disputes on bunker quantity are about 8 times that of disputes on quality. Lot of scope for errors & manipulations Well known that quantities and their measurements are manipulated by some suppliers through sounding tape, temperature, water addition, ship staff corruption, Cappuccino etc. Quantity surveys do not eliminate, but reduce losses considerably

7
WHY DO BQS WITH VISWA? Viswa Lab is the one of few labs to be accredited to ISO by Singapore Accreditation Council for the Bunker Quantity Survey Activity Highly Experienced, Highly paid and mature surveyors familiar with Cappuccino and Line blending Calibration table and barge track record Proper sampling and dealing with barge captains 7 Exclusive employees surveyors in Singapore/Malaysia area, 3 in mainland China/Hong Kong area and many more in US and Europe

8
WHY ROB SURVEY? WHY ROB SURVEY
- To capture unaccounted and hidden bunker fuels on ships - Sounding all tanks and hidden spaces for the above - Helps in keeping ship staff and supply barge stay above temptation - Helps shore operations to calculate exact fuel consumption - Helps shore operations to order the correct bunker fuel quantity - Savings can be 2 MT/day or $42,000 in a 30 day voyage

9
WHY SLUDGE SURVEY? HISTORY
- Some sludge is always produced on a ship; this is stored in the sludge tank. It contains some fuel which has value PRACTICE The sludge generation can be increased through unethical practices such as - Forced de sludging of heavy oil purifier - Excessive draining of heavy oil settling and service tank Forced purifier malfunctioning to extract more sludge Excess sludge so produced stored in sludge tank and smaller quantity declared. The excess sludge commands premium and payments in some ports

10
WHY SLUDGE SURVEY? Viswa Solutions
Viswa surveyors will carry out comprehensive sludge survey, calculate the sludge discharge, study the oil record book and identify and quantify malpractices Savings affected = 0.5% or 15 MT/3000 MT= $10,500 per 30 day voyage

11
BUNKER PURCHASE EFFICIENCY (BPE)
VL uses three clear parameters to study Bunker Purchase Efficiency (BPE) Density differential, Water content differential EFN (Engine Friendliness Number) The study reveals that avoiding bunkering in a certain port will improve BPE considerably. Similarly, avoiding purchasing from a certain supplier can show dramatic improvements in BPE. See below Singapore example * There is a difference in the supplier BDN density and the lab determined density. Fuel buyer can claim this difference. ** There is a difference supplier BDN water content and the lab determined water content. Fuel buyer can also claim.
 Density differential, Water content differential. EFN (Engine Friendliness Number) The study reveals that avoiding bunkering in a certain port will improve BPE considerably. Similarly, avoiding purchasing from a certain supplier can show dramatic improvements in BPE. See below Singapore example. * There is a difference in the supplier BDN density and the lab determined density. Fuel buyer can claim this difference. ** There is a difference supplier BDN water content and the lab determined water content. Fuel buyer can also claim.")
12
BUNKER PURCHASE EFFICIENCY (BPE) COMPARISON OF PERFORMANCE ON QUALITY SINGAPORE PORT - 4/2010 TO 4/2011 ABCD had lowest losses due to density differential (- 0.02%) ABCD purchased fuel with lowest water content (0.13%) Catfines in fuel purchased by ABCD was lowest at ppm Vanadium in fuel purchased by ABCD was lowest at ppm ABCD purchased fuel had best EFN at 61 Quantity loss per 1000 MT by ABCD due to density difference and water content was lowest at 1.43 MT/1000 MT (worst performer lost 3.78 MT/1000 MT). This means that ABCD saved over 2.35 MT/1000 MT or $1.65 per MT over the poorest bunker purchase buyer.
 ABCD purchased fuel with lowest water content (0.13%) Catfines in fuel purchased by ABCD was lowest at ppm. Vanadium in fuel purchased by ABCD was lowest at ppm. ABCD purchased fuel had best EFN at 61. Quantity loss per 1000 MT by ABCD due to density difference and water content was lowest at 1.43 MT/1000 MT (worst performer lost 3.78 MT/1000 MT). This means that ABCD saved over 2.35 MT/1000 MT or $1.65 per MT over the poorest bunker purchase buyer.")
13
BUNKER PURCHASE – SHOWING BENEFITS OF FUEL QUALITY INCLUDING IGNITION AND COMBUSTION PROPERTIES TRUE WORTH INDEX – TABLE 1 CALCULATING TWI (EFN common as 50) - TABLE 1 BUNKER PORT AVERAGE LIFT (MT) AVERAGE DENSITY (Kg/m3) QUANTITY CONSIDERED FOR CALCULATION (KG) AVERAGE WATER (%) AVERAGE WATER (Kg) KG AVAILABLE FOR COMBUSTION ROTTERDAM 1000 987.7 0.14 14 986 SINGAPORE 988.1 0.16 16 984 JEDDAH 968.6 0.1 10 990 TOKYO 983 0.06 6 994 HOUSTON 988.6 UAE 979.7 0.09 9 991
 - TABLE 1. BUNKER PORT. AVERAGE LIFT (MT) AVERAGE DENSITY (Kg/m3) QUANTITY CONSIDERED FOR CALCULATION (KG) AVERAGE WATER (%) AVERAGE WATER (Kg) KG AVAILABLE FOR COMBUSTION. ROTTERDAM SINGAPORE JEDDAH TOKYO HOUSTON UAE")
14
BUNKER PURCHASE – SHOWING BENEFITS OF FUEL QUALITY INCLUDING IGNITION AND COMBUSTION PROPERTIES TRUE WORTH INDEX – TABLE 2 CALCULATING TWI with EFN common as 50 (continued) A B C D E F G H BUNKER PORT KG AVAILABLE FOR COMBUSTION AVG CALORIFIC VALUE (MJ/Kg) MJ in 1000 kg (A X B) TWI (NO EFN) (expressed as %) MJ available for work (C X D) HFO 380 cost $/MJ (F/E) MJ/$ (E/F) ROTTERDAM 986 40.38 44 $644 0.0368 27.20 SINGAPORE 984 39.57 47 $680 0.0372 26.91 JEDDAH 990 40.93 61 $703 0.0284 35.16 TOKYO 994 41.23 60 $707 0.0288 34.78 HOUSTON 40.25 39606 42 $662 0.0398 25.13 UAE 991 40.3 50 $677 0.0339 29.50 BEST PORT Jeddah $/MJ or 35.16 MJ/$ TRUE PRICE DIFFERENTIAL FROM JEDDAH 22.80% ( )/0.0368 23.70% 1.40% 28.60% 16.20% Though Rotterdam price appears to be cheaper at $644 per MT, if you take into account the quality of the fuel, Jeddah fuel is 22.8% less expensive even though the Jeddah fuel costs $703 per MT.
 A. B. C. D. E. F. G. H. BUNKER PORT. KG AVAILABLE FOR COMBUSTION. AVG CALORIFIC VALUE (MJ/Kg) MJ in 1000 kg (A X B) TWI (NO EFN) (expressed as %) MJ available for work (C X D) HFO 380 cost. $/MJ (F/E) MJ/$ (E/F) ROTTERDAM $ SINGAPORE $ JEDDAH $ TOKYO $ HOUSTON $ UAE $ BEST PORT. Jeddah $/MJ or MJ/$ TRUE PRICE DIFFERENTIAL FROM JEDDAH % ( )/ % 1.40% 28.60% 16.20% Though Rotterdam price appears to be cheaper at $644 per MT, if you take into account the quality of the fuel, Jeddah fuel is 22.8% less expensive even though the Jeddah fuel costs $703 per MT.")
15
FUEL RELATED MACHINERY PROBLEMS – P&I FINDINGS
GARD - An International P&I company reported: MAIN AND AUXILARY ENGINE REPORTED CLAIMS - 31% OF TOTAL HULL AND MACHINERY CLAIMS INDUSTRY STATISTICS INDICATE 80% OF ALL ENGINE BREAKDOWNS ARE RELATED TO FUEL OIL OF LUBE OIL. CIMAC USER GROUP IN VIENNA COMPLAINED THAT 40% OF THE VESSELS DEVELOPED MACHINERY PROBLEMS WITHIN THE WARRANTY PERIOD. ENGINE BREAKDOWNS, BLACKOUTS, DRIFTING SHIPS CONSTITUTE MAJOR DANGERS

16
FINDINGS OF A SURVEY CONDUCTED ON BUNKER FUELS
Asked if they had encountered "any serious off-specification fuel deliveries" last year, 52% said no, while 44% said yes. 4% did not reply. Off spec included items covered by para 5.1 of ISO 8217:2005 64% reported filter clogging, 48% experienced sludging, 40% said they had fuel pump sticking/seizures, and 19% had piston ring breakages. 77% said they had no regulatory problems in emission control areas (ECAs), while 22% said they did.
, while 22% said they did.")
17
MACHINERY PROBLEMS AND ISO 8217
WITH THE REGULATIONS DRIVEN NEED TO DROP SULPHUR CONTENT, MORE AND MORE REFINERY PROCESS CHANGES BEING EMPLOYED – MORE CONTAMINANTS ARE FINDING THEIR WAY INTO THE FUEL COMPLIANCE WITH ISO 8217 NO GUARANTEE THAT CONTAMINANTS WILL NOT BE PRESENT IN OVER 99% OF MACHINERY PROBLEMS, FUEL CONFORMED TO THE ISO 8217 SPECS!!

18
SOME QUESTIONS A)Can we identify problem fuels using comprehensive testing and before they cause machinery damage? Yes, thereby you can save machinery from poor performance and fuel related damage. B) Can a problem fuel be treated on board to mitigate damage? Yes. Performance of Purifier/Filters have to be monitored closely. Asset protection of high order can be achieved through proper monitoring of onboard treatment C) Can the performance of the fuel be maximized using mechanical and chemical manipulations? Yes. Through TFM and TLM, substantial savings can be achieved
 Can a problem fuel be treated on board to mitigate damage Yes. Performance of Purifier/Filters have to be monitored closely. Asset protection of high order can be achieved through proper monitoring of onboard treatment. C) Can the performance of the fuel be maximized using mechanical and chemical manipulations Yes. Through TFM and TLM, substantial savings can be achieved.")
19
HOLISTIC VIEW OF BUNKER FUEL

20
Using the Magic of Algorithms to identify problem fuels and saving millions

21
A formula or a set of rules to solve a problem Definition Of Algorithm
Algorithms A formula or a set of rules to solve a problem Definition Of Algorithm In Layman's terms, play with numbers (data), find patterns and empirical rules.
, find patterns and empirical rules.")
22
Viswa Lab Algorithms # ALGORITHM ACRONYM 1 ENGINE FRIENDLINESS NUMBER
EFN 2 PURIFIER EFFICIENCY FRIENDLINESS NUMBER PEFN 3 PROBLEM FUEL IDENTIFICATION NUMBER PFIN 4 TRUE WORTH INDEX TWI 5 NEW EQUIVALENT CETANE NUMBER NECN 6 FILTER BLOCKING TENDENCY NUMBER FBTN 7 CONTAMINANT PRESENCE INDICATOR CPI 8 FAMES DETECTION INDICATOR FDI

23
Beautification Algorithm
Beautification Algorithm uses mathematical formula to alter original form into more attractive version Israeli Software takes into account 234 facial parameters. These parameters were arrived at based on likes and dislikes of 68 people who expressed their preference in beauty.

24
Algorithms In Bunker Fuel
Typically a fuel test yields 29 data points With additional tests, this can be up to 40 Yes, we can use data, statistical analysis, pattern recognition studies to identify most of the problem fuels The secret to identifying problem fuels is using appropriate Algorithms Viswa Lab deeply into Algorithms and can claim success in >85%

25
PROBLEM – SEVERE M.E PISTON RING BREAKAGE
ALGORITHM PFIN (Problem Fuel Identification Number) PISTON RING BREAKAGE PROBLEM – SEVERE M.E PISTON RING BREAKAGE PROBLEM PORTS – SINGAPORE, GREECE, GIBRALTAR, SPAIN, PANAMA, HOUSTON PROBLEM PERIOD – OVER 3 YEARS NUMBER OF REPORTED CASES - OVER 100
 PISTON RING BREAKAGE. PROBLEM – SEVERE M.E PISTON RING BREAKAGE. PROBLEM PORTS – SINGAPORE, GREECE, GIBRALTAR, SPAIN, PANAMA, HOUSTON. PROBLEM PERIOD – OVER 3 YEARS. NUMBER OF REPORTED CASES - OVER 100.")
26
BROKEN PISTON RINGS

27
(Problem Fuel Identification Number)
WHAT IS PFIN? (Problem Fuel Identification Number) Fuels with high MCR(11.5%), high asphaltene (> 10.5%) and high CCAI (>849) were found to cause main engine piston ring breakage. However, in a few cases even this combination did not cause piston rings to break The need for finding other parameters which, in addition to the three above can effectively pin down the problem fuels was clear. VL was able to identify Xylene Equivalent number and Reserve Stability Number as two other parameters which in combination with the three listed above, clearly flagged fuels likely to cause piston ring breakage with over 85% certainty using an algorithm developed for this purpose. Further study continuing.
 Fuels with high MCR(11.5%), high asphaltene (> 10.5%) and high CCAI (>849) were found to cause main engine piston ring breakage. However, in a few cases even this combination did not cause piston rings to break. The need for finding other parameters which, in addition to the three above can effectively pin down the problem fuels was clear. VL was able to identify Xylene Equivalent number and Reserve Stability Number as two other parameters which in combination with the three listed above, clearly flagged fuels likely to cause piston ring breakage with over 85% certainty using an algorithm developed for this purpose. Further study continuing.")
28
PORTS PFIN TESTS REQUIRED PORTS PFIN TESTS NOT REQUIRED
PFIN GLOBAL COVERAGE PORTS PFIN TESTS REQUIRED PORTS PFIN TESTS NOT REQUIRED Singapore Hong Kong Malta Brazil Gibraltar Africa Panama Argentina Houston Australia Spain Russia ARA Japan China Korea UAE Saudi Arabia

29
Quantification of Fuel Quality-EFN
Engine Friendliness Number (EFN) - Already famous Benchmark of fuel quality. Quantification helps evaluation of engine maintenance cost. 18 years, hundred’s of thousands of samples after EFN < Fuel usually has problem EFN > generally there is no problem
 - Already famous Benchmark of fuel quality. Quantification helps evaluation of engine maintenance cost. 18 years, hundred’s of thousands of samples after. EFN < 35 Fuel usually has problem. EFN > 60 generally there is no problem.")
30
TRUE WORTH INDEX OF BUNKER FUEL –TWI (PUBLISHED AT BUNKERWORLD.COM)
The Selection of Bunker fuel – Importance of TWI True worth of a fuel is the energy transformable to useful work with minimal machinery wear What constitutes the True Worth of a Fuel? Calorific Value (CV) – the energy content Engine Friendliness Number (EFN) Equivalent Cetane Number (ECN) or the ability of the fuel to combust on time to maximize fuel energy usage
 – the energy content. Engine Friendliness Number (EFN) Equivalent Cetane Number (ECN) or the ability of the fuel to combust on time to maximize fuel energy usage.")
31
Determination FBT Of Problem Fuel Oils
Procedure Fuel oil is pumped with target viscosity of 35 cst at flow rate (20mL/min) through 10µm mesh filter paper using a piston type metering pump. Back pressure of filter is recorded continuously. Test is designed to record pressure until 100kPa or the volume of the oil pumped reaches 300 mL. FBT is pressure differential/volume pumped
 through 10µm mesh filter paper using a piston type metering pump. Back pressure of filter is recorded continuously. Test is designed to record pressure until 100kPa or the volume of the oil pumped reaches 300 mL. FBT is pressure differential/volume pumped.")
32
Determination Of FBTN Of Problem Fuel Oils
Test parameters of fuel oil Sample ID AAA BBB CCC DDD Vessel Name Morning Express ANTWERPEN CARDONIA AU ARIES Density (kg/m3) 987.8 974.3 942.3 988.1 50°C (cst) 330.3 310.3 407.1 330 Temperature to attain 15 cst viscosity ( °C) 124.5 129.7 125.7 Al+Si (ppm) 143 58 43 TSP (%,mass) 0.02 0.06 0.03 Iron (ppm) 10 36 22 Water (%,vol) 0.10 0.70 0.20 FBT number (obtained by ASTM formula) 1.04 15.09 2.02 3.53
 °C (cst) Temperature to attain 15 cst viscosity ( °C) Al+Si (ppm) TSP (%,mass) Iron (ppm) Water (%,vol) FBT number (obtained by ASTM formula)")
33
Energy Management – Not only saves energy… but also reduces emissions
(ENERGY = FUEL = $$) but also reduces emissions
 but also reduces emissions.")
34
VISWA ENERGY INITIATIVES
Energy and Emission improvements – Driven by regulations VISWA Contributes through : TOTAL LUBE MANAGEMENT TOTAL FUEL MANAGEMENT CHOOSING THE FUELS WITH BEST VALUE (TWI) – SAVINGS IN COST, EMISSIONS AND ENERGY ENERGY MONITORING – SEEMP & EEOI SCRUBBERS
 – SAVINGS IN COST, EMISSIONS AND ENERGY. ENERGY MONITORING – SEEMP & EEOI. SCRUBBERS.")
35
VISWA LAB TOTAL LUBE MANAGEMENT
LUBE SELECTION BASED ON ENERGY EFFICIENCY Lubricants provide a barrier between rubbing surfaces and prevent metallic wear Lubricants consume 5% to 15% of the energy transmitted in order to provide this lubrication. This energy loss is used for overcoming churning losses and friction losses which are load, viscosity and chemistry dependent. Viscosity behavior under high temperature and high shear mainly determines oil energy efficiency. Many base oils to meet many viscosity requirement.

36
VISWA LAB TOTAL LUBE MANAGEMENT
LUBE SELECTION BASED ON ENERGY EFFICIENCY In selecting the right lubricant for the right function, energy aspect has not received due weightage. Energy efficiency can be improved by selecting the right viscosity (lower the better but must avoid boundary conditions) Energy efficiency can also be improved by right selection and quantity of the additives. The savings in energy far outweighs the cost of the lubricant itself.
 Energy efficiency can also be improved by right selection and quantity of the additives. The savings in energy far outweighs the cost of the lubricant itself.")
37
VISWA LAB TOTAL LUBE MANAGEMENT
LUBE SELECTION BASED ON ASSET PROTECTION Asset protection simply means reduced wear and tear in the machinery. Wear and tear can be reduced by correct selection of additives and their quantity Wear and tear can be reduced by monitoring the oil condition and taking preventive action Wear and tear reduced by the correct filtration, particle count, temperature and every operational aspect of the oil Asset protection should extend even to the surface finish condition of the rubbing parts. The machinery life can be extended 3-4 times by investing in the above points

38
VISWA LAB TOTAL LUBE MANAGEMENT
LUBE CONDITION MONITORING INCLUDING AFTERMARKET ADDITIVES. Detergents to keep spaces clean which will have the effect of clean combustion which could add to the fuel efficiency. Detergents prevent scale formation which impedes heat transfer (0.1 mm layer of soot/sludge can affect heat transfer to the effect of 50 to 100 degC). Higher the temp of the piston, greater the wear on the liner and piston ring. Identifying and purchasing After Market Additives - This is based on knowledge and functionality and how the additives work. This can provide valuable asset protection, higher energy efficiency, lower wear and particles generation and longer life for the lubricating oil.
. Higher the temp of the piston, greater the wear on the liner and piston ring. Identifying and purchasing After Market Additives - This is based on knowledge and functionality and how the additives work. This can provide valuable asset protection, higher energy efficiency, lower wear and particles generation and longer life for the lubricating oil.")
39
VISWA LAB TOTAL LUBE MANAGEMENT
LUBE AND MACHINERY DATA COLLECTION AND ANALYSIS

40
WEAR DEBRIS ANALYSIS

41
Viswa Total Fuel Management
A concept in fuel management introduced by Viswa in 2001 How to get the best out of the fuel – Maximize Thermal Efficiency Obtain the ignition and combustion characteristics. Carry out complete analysis and forensic studies to identify chemical contaminants. Based on analysis results and EFN and TWI values of the fuel, mechanical manipulation of machinery controls to obtain maximum thermal efficiency Also chemical manipulation by using additives or lighter fractions such as distillate fuels

42
Percentage Fuel Savings per day after TFM Savings over 30 day voyage
TFM Benefit – As Computed For APL/NOL SHIPPING Calculations Over Several Voyages Location Hong Kong San Pedro Singapore Quantity (MT) 3200 3307.2 3600 5600 Viscosity 324.8 295.8 491 302.6 444.7 Consumption before TFM (MT/day) 210.84 217.47 206.4 204.62 207.66 Percentage Fuel Savings per day after TFM 2.80% 1.98% 4.79% 1.82% 1.80% Actual fuel savings per day after TFM 3.799 4.306 4.309 3.725 3.744 Cost of Fuel $452.00 $500.00 $520.00 $600.00 Savings over 30 day voyage $51,517.15 $58,383.94 $64,635.00 $58,106.88 $67,392.00 Cost of Test and Advisory service $3,000 to $4,000
 Viscosity Consumption before TFM (MT/day) Percentage Fuel Savings per day after TFM. 2.80% 1.98% 4.79% 1.82% 1.80% Actual fuel savings per day after TFM Cost of Fuel. $ $ $ $ Savings over 30 day voyage. $51, $58, $64, $58, $67, Cost of Test and Advisory service. $3,000 to $4,000.")
43
Tests Performed On Fuel For TFM
Routine Analysis TAN/SAN GC-MS Asphaltene Stability Reserve stability number Xylene equivalent number Fuel Tech Ignition and Combustion Purifier Efficiency - Before & After - Spectroscopic And Particle Count Analyze Ship Machinery Condition With Logged Data Monitor Results After Corrections Are Implemented

44
How Does It Work Output:
Parameters derived from Combustion Pressure Trace and Rate of Heat Release (ROHR)
")
45
Case: Problem Fuel Fuel Properties According to ISO 8217
Caused extensive problems for main engine Reduced engine output Heavy knocking at part load Cylinder components needed replacement FIA testing at Fueltech shows: Bad ignition and combustion properties Indication of dumb-bell fuel Normal fuel Problem fuel Normal fuel Problem fuel

46
FIA - Curve & Glossary

47
Figures on Manipulation

48
ENERGY MANAGEMENT MODULES
FUEL MANAGEMENT SHIP ENERGY EFFICIENCY MANAGEMENT CREATING AWARENESS AND MOTIVATION AND TRAINING IN THE IMPLEMENTATION OF THE PLAN VOYAGE PLANNING OPTIMIZED SHIP HANDLING HULL MAINTENANCE

49
ONBOARD ENERGY MONITOR MEASURES THE FOLLOWING
EEOI - Energy Efficiency Operational Index TonHFO/Ton nm - Mass of HFO per nautical mile TonLFO/Ton nm - Mass of LFO per nautical mile TonCO2/nm - CO2 per nautical mile kWh/nm - Energy used per nautical mile kWh/Shaft Kw - ME efficiency TonCO2/shaft kWh - CO2 per shaft energy kn/shaft kWh - Velocity per shaft energy Ton CO2 / kWh - Generators emissions GEffi. - % Generator and efficiency Ton CO2 / kWh - Boiler emissions

50
SOME OTHER FUEL SAVING OPTIONS
TECHNOLOGY POSSIBLE SAVING Optimized Hull design and form upto 10% Weather and Voyage Routing 4% Propeller Mewis Duct 4% to 6% Fins on propeller boss nut 1% Propeller - 3 blades upto 3% Trim Adjustment 3% to 5% Wind Energy upto 50% LFC Paint upto 9% Emulsion Fuel Choosing the right lubricants 5% to 15% 해운산업에서 잠재적인 감축가능성은 신선에 대하여는 개념 설계 선체 개선 기관 및 추진 연료유 및 신재생에너지 등으로 10에서 50%(감속 전제)까지 효율적인 운항관리를 통하여 10에서 50%(감속 전제)까지 총 25에서 75%(감속 전제)까지 온실가스배출을 감축할 수 있다고 국제적으로 인식하고 있습니다.
까지. 효율적인 운항관리를 통하여 10에서 50%(감속 전제)까지. 총 25에서 75%(감속 전제)까지 온실가스배출을 감축할 수 있다고 국제적으로 인식하고 있습니다.")
51
OTHER ENERGY SAVING OPTIONS
STARISTIND GriegStarShipping firstvessel withMDinfullscale September2009 Cost around USD 200,000. Fitting time 2 days in Dry Dock Retrofitting Possible. Currently 140 on order Upto 6% energy savings 4

52
Scrubbers FUELS TIGHTER SULFUR REGULATIONS
EXPENSIVE MARINE DISTILLATE FUELS TIGHTER SULFUR REGULATIONS SRUBBERS - VIABLE ALTERNATIVE

53
53

54
MARPOL ANNEXE VI LIMITS ON SULPHUR
GLOBAL (Jan 1st) EMMISSION CONTROL AREAS ENTRY INTO FORCE DATE >= TO /25* >= 2020/25* >= 1 Jul 2010 TO < 1 Jan 2015 >= 1 Jan 2015 LIMITS 3.5% + 0.5% + 1.0% + 0.10% + * EFFECTIVE YEAR (2020 OR 2025) WILL BE DECIDED IN 2018 + ALTERNATE TECHNOLOGIES ALSO ACCEPTABLE INCLUDING EXHAUST GAS CLEANING SYSTEM
 EMMISSION CONTROL AREAS. ENTRY INTO FORCE DATE. >= 2012 TO 2020/25* >= 2020/25* >= 1 Jul TO < 1 Jan >= 1 Jan LIMITS. 3.5% + 0.5% + 1.0% % + * EFFECTIVE YEAR (2020 OR 2025) WILL BE DECIDED IN ALTERNATE TECHNOLOGIES ALSO ACCEPTABLE INCLUDING EXHAUST GAS CLEANING SYSTEM.")
55
LIMITS ON SULPHUR - European Union (eu) REQUIREMENTS and carb
0.1 % SULPHUR LIMIT(m/m) FOR MARINE FUEL INTRODUCED EFFECTIVE DATE: JANUARY 1, 2010 APPLIES TO ALL TYPES OF MACHINERY CALIFORNIA – 0.1% FROM 01 JANUARY 2014
 FOR MARINE FUEL INTRODUCED. EFFECTIVE DATE: JANUARY 1, APPLIES TO ALL TYPES OF MACHINERY. CALIFORNIA – 0.1% FROM 01 JANUARY")
56
Why Scrubbers? CASE 1 Consider a ship of 35,000 DWT consuming 25 MT per day. Based on detailed working, it is reasonable to assume that a ship will be in ECA area for at least 100 days in a year. Take the example of a ship coming from Japan/China to US West Coast. Voyage takes 30 days. In a year, at least 11 voyages. This will involve: Port stay of 11 voyages X 2 x 3 days stay = 66 days. Maneuvering time of 0.5 day X 22 times = 11 days US West Coast ECA entry will be 1 X 22 = 22 days. Total ECA time = approximately 100 days

57
Why Scrubbers? Consider the following benefits for Case 1
As ECA area increases, this 100 days can become much more thereby increasing the savings. Post 2015, the differential cost between HFO and MDO can be much more than $300 per MT. After 2020, there will be substantial benefit when the sulfur content is capped at 0.5%. Assuming the ship will be around for another 10 years, the savings will be: 265 (days) X 25 (consumption) X $220 + 34 (days) X 20 (consumption) X $220 + 66 (days) X 5 (port consumption) X $220 = $1,680,000 per year So from 2012 to 2020, savings are $ 630,000 and From 2020 to 2030, savings are $18,500,000 Up to 2030, the savings will come to $19 million
 X 25 (consumption) X $ (days) X 20 (consumption) X $ (days) X 5 (port consumption) X $220 = $1,680,000 per year. So from 2012 to 2020, savings are $ 630,000 and. From 2020 to 2030, savings are $18,500,000. Up to 2030, the savings will come to $19 million.")
58
Why Scrubbers? Other benefits are:
Not having to have more tanks and pipelines for LS fuel, The freedom to buy any sulphur fuel, Not having to go to ports with added delay and bunkering small quantities of low sulphur fuel all of which are expensive and time consuming.

59
Introducing VISWA Scrubbers
Forefront of Technological Excellence. Fully automated trouble free operation A product developed by three IIT (Indian Institute of Technology) Engineers with combined experience of over 100 years 30 years of experience, supplying pollution control equipment including scrubbers Expertise in all aspects of Ships and Marine industry through the Viswa Group
 Engineers with combined experience of over 100 years. 30 years of experience, supplying pollution control equipment including scrubbers. Expertise in all aspects of Ships and Marine industry through the Viswa Group.")
60
Features and Options VISWA Scrubbers
Single scrubber can treat exhaust gas streams from ALL combustion sources Includes main engine, auxiliary boilers and generators Scrubber capacities up to 20 MW Higher capacity scrubbers available Options for exhaust gas treatment in ports

61
A LOGICAL alternative to WET SCRUBBERS - An exclusive from Viswa Scrubbers
A new simplified low cost regulations compliant design New Design Dry scrubbers Spray Dried Absorbers Uses lime for SO2 capture Safe to handle No Centrifuges No wash water to be discharged

62
Schematic Diagram of SDA
Inlet exhaust gas From main engine, auxiliary engine and boilers Air to Atomizer Spray Dryer Lime & Water Fabric Filter Stack Waste solids (CaSO3 & CaSO4)
")
63
Advantages of SDA. Ca(OH)2 + SO2 > CaSO3 + H2O
Advantages of SDA Ca(OH)2 + SO2 > CaSO3 + H2O CaSO3 + ½ O2 > CaSO4 Removes SOx as well as particulates (upto 70%) Sox removal 98% +, Some Nox removal Low water consumption Can use waste water or lake water No wash water generation No sludge treatment Lower power consumption Safe; no corrosive materials to handle Inexpensive material selection
2 + SO2 > CaSO3 + H2O CaSO3 + ½ O2 > CaSO4. Removes SOx as well as particulates (upto 70%) Sox removal 98% +, Some Nox removal. Low water consumption. Can use waste water or lake water. No wash water generation. No sludge treatment. Lower power consumption. Safe; no corrosive materials to handle. Inexpensive material selection.")
64
CONCLUSION Substantial savings are possible through bunker quantity management Asset protection and long term savings are possible through a Holistic Management of Bunker fuels Energy Efficiency can be augmented through fuel savings and Total Fuel Management and Energy saving in Total Lube Management. Lube Management also enhances asset protection Low cost new design scrubbers help in conforming to emission regulations with maximum savings and minimum complications Additional Energy Savings ideas Viswa Lab will continuously partner, participate and contribute in realizing these goals

65
MARPOL ANNEXE VI REGULATIRY UPDATES
* MEPC 62 EEDI – 01 JAN 2013 – NEW SHIPS SEEMP 01 JAN 2013 – ALL SHIPS EEOI ( Voluntary ) MARKET BASED MEASURES DISCUSSED *MEPC 63 LARGELY UNEVENTFUL Clarifications on EEDI Discussions on ECA compliant fuels Market Based Measures Discussed
 MARKET BASED MEASURES DISCUSSED *MEPC 63 LARGELY UNEVENTFUL Clarifications on EEDI Discussions on ECA compliant fuels Market Based Measures Discussed")
66
MEPC 62 Chapter 4 Enters into Force on 01Jan 2013 All ships 400 GT and Above (Some exceptions ) Attained EEDI not to exceed Required EEDI Building Contract on or after 01 Jan 2013 No Building Contract - Keel Laid or Similar stage of construction Irrespective of above dates delivery on or after 01Jan 2015 All ships to be provided with SEEMP 30% reduction in three phases by 2025

67
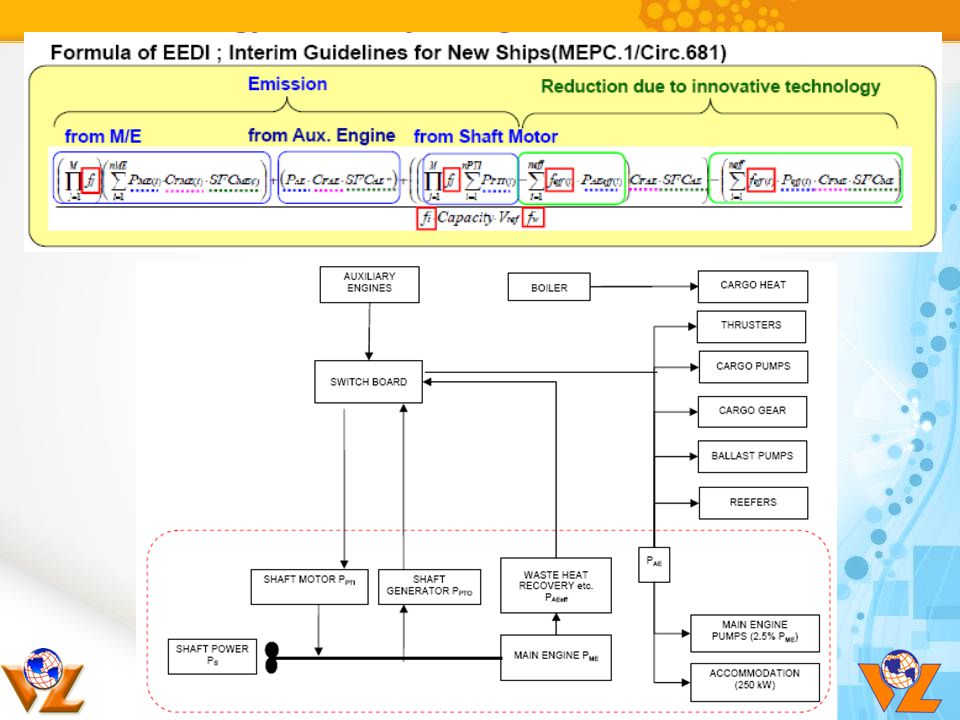
Energy Efficiency Design Index
Cost: Emissions of CO2 Benefit: Cargo capacity & transport work Complex formula to accommodate most ship types and sizes The Energy Efficiency Design Index (EEDI) provides a figure, expressed in grams of CO2 per tonne mile, that measures the attainable energy efficiency of a specific ship design. It enables the designer to optimize the various parameters at his disposal and provides an energy rating for the ship before it is built. The Index will, therefore, stimulate technical development of all the components influencing fuel efficiency. Through the application of this Index, ships in the near future will have to be designed and constructed intrinsically energy-efficient. The formulation of the Index is rather complex, in that it tries to accommodate a wide range of ship types and sizes. The formula, which I cannot show in the slide because of size and complex structure, may still suffer some modifications before it is agreed by the MEPC in July. 67 67
 provides a figure, expressed in grams of CO2 per tonne mile, that measures the attainable energy efficiency of a specific ship design. It enables the designer to optimize the various parameters at his disposal and provides an energy rating for the ship before it is built. The Index will, therefore, stimulate technical development of all the components influencing fuel efficiency. Through the application of this Index, ships in the near future will have to be designed and constructed intrinsically energy-efficient. The formulation of the Index is rather complex, in that it tries to accommodate a wide range of ship types and sizes. The formula, which I cannot show in the slide because of size and complex structure, may still suffer some modifications before it is agreed by the MEPC in July")
68
Attained Index Cost: Emission of CO2
Benefit: Cargo capacity transported a certain distance Relates to seagoing maximum condition – maximum capacity transported using maximum engine power

69
Attained Index CF: Conversion between fuel and CO2
SFC: Specific fuel consumption P, Vref and Capacity: A consistent set of engine power required to sail at a certain speed when the ship is carrying its capacity in calm weather fw: Speed reduction factor in wind and waves fi: Correction factor for any regulatory limitation on capacity

71
Benchmark Against Baseline
Different Benchmarks for different types

72
Benchmark against a baseline
From public databases (LRFP*) a baseline for the ship types in the current MEPC discussion is derived for Bulker Tanker Gas carrier Container ships General cargo ships Ro-ro passenger ships, etc. The “Required EEDI” of a new ship shall be below the Baseline EEDIRequired < EEDIBaseline
 a baseline for the ship types in the current MEPC discussion is derived for. Bulker. Tanker. Gas carrier. Container ships. General cargo ships. Ro-ro passenger ships, etc. The Required EEDI of a new ship shall be below the Baseline. EEDIRequired < EEDIBaseline.")
73
EEDI base line vs. required EEDI
EEDI base line = a x DWT–c To be determined according to “Guidelines” Reduction of EEDI (MEPC61) Required EEDI = base line x (1-(X/100)) X = reduction ratio of EEDI(%) Y Y DWT : Ship Size requiring attained EEDI to be less than required EEDI 73
 Required EEDI = base line x (1-(X/100)) X = reduction ratio of EEDI(%) Y. Y DWT : Ship Size requiring attained EEDI to be less than required EEDI. 73.")
74
Baseline Establishment
EEDI New Baseline formula agreed at MEPC 60

75
Baseline Establishment
Ship type a b c [Passenger ships [ ] ] Dry Cargo Carriers DWT Gas tankers Tankers Container Ships [Ro-Ro Ships General Cargo Ships [Ro-ro Passenger Ships Refrigerated Cargo Ships If the design of a ship makes it possible to fall into more than one of the above ship type definitions the required energy efficiency design index for the ship the most stringent energy efficiency design index.

76
Verification of EEDI

78
Energy Efficiency Operational Indicator (EEOI)
An efficiency indicator for all ships (new and existing) obtained from fuel consumption, voyage (miles) and cargo data (tonnes) Cargo Onboard x (Distance traveled) Fuel Consumption in Operation = Actual Fuel Consumption Index The Energy Efficiency Operational Indicator (EEOI) enables operators to measure the fuel efficiency of a ship in operation. Expressed in grams of CO2 per tonne mile, the indicator enables comparison between individual ships and thereby facilitates adoption of appropriate measures to reduce energy consumption. More importantly, the Indicator makes it possible for operators and crews to monitor the effectiveness of any new measures applied in accordance with the Ship Energy Management Plan. The Energy Efficiency Operational Indicator has been implemented on a trial basis since 2005 and the outcome and experience obtained from hundreds of trials will enable the MEPC in July to adopt a mature and robust tool to gage the operational efficiency of individual ships. 78 78
 obtained from fuel consumption, voyage (miles) and cargo data (tonnes) Cargo Onboard x (Distance traveled) Fuel Consumption in Operation. = Actual Fuel. Consumption. Index. The Energy Efficiency Operational Indicator (EEOI) enables operators to measure the fuel efficiency of a ship in operation. Expressed in grams of CO2 per tonne mile, the indicator enables comparison between individual ships and thereby facilitates adoption of appropriate measures to reduce energy consumption. More importantly, the Indicator makes it possible for operators and crews to monitor the effectiveness of any new measures applied in accordance with the Ship Energy Management Plan. The Energy Efficiency Operational Indicator has been implemented on a trial basis since 2005 and the outcome and experience obtained from hundreds of trials will enable the MEPC in July to adopt a mature and robust tool to gage the operational efficiency of individual ships")
79
Objective of the EEOI Measuring energy-efficiency of existing ships
Evaluation of operational performance by owners or operators Continued monitoring of individual ship Evaluation of any changes made to the ship or its operation Currently voluntary in nature MEPC has developed Guidelines for voluntary use of the ship Energy Efficiency Operational Indicator (MEPC.1/Circ.684) to establish a consistent approach for measuring ships energy-efficiency at each voyage or over a certain period of time, which will assist shipowners and ship operators in the evaluation of the operational performance of their fleet. As the amount of CO2 emitted from ships is directly related to the consumption of bunker fuel oil, the EEOI can also provide useful information on a ship’s performance with regard to fuel efficiency. The EEOI enables continued monitoring of individual ships in operation and thereby the results of any changes made to the ship or its operation. The effect of retrofitting a new and more efficient propeller would be reflected in the EEOI value and the emissions reduction could be quantified. The effect on emissions by changes in operations, such as introduction of just in time planning or a sophisticated weather routing system, will also be shown in the EEOI value.
 to establish a consistent approach for measuring ships energy-efficiency at each voyage or over a certain period of time, which will assist shipowners and ship operators in the evaluation of the operational performance of their fleet. As the amount of CO2 emitted from ships is directly related to the consumption of bunker fuel oil, the EEOI can also provide useful information on a ship’s performance with regard to fuel efficiency. The EEOI enables continued monitoring of individual ships in operation and thereby the results of any changes made to the ship or its operation. The effect of retrofitting a new and more efficient propeller would be reflected in the EEOI value and the emissions reduction could be quantified. The effect on emissions by changes in operations, such as introduction of just in time planning or a sophisticated weather routing system, will also be shown in the EEOI value.")
80
Market Based Instruments
Should MBIs be included? Reasons for MBIs Long life of ships Growth of international shipping CO2 reductions due to EEDI (new ships) = long term measure Measures on existing ships = not sufficient to meet reductions of 20% or more in the short terms (up to 2020) Which MBI? - Bunker Levy (Denmark/Japan) - Emission Trading Scheme (ETS) (Norway, Germany, U.K. & France) - US alternative – based upon EEDI - World Shipping Council (WSC) – modified US alternative - IUCN Proposal of Levy on Imported Goods - Bahama proposal of doing nothing other than Technical and Operational Measures.
 = long term measure. Measures on existing ships = not sufficient to meet reductions of 20% or more in the short terms (up to 2020) Which MBI - Bunker Levy (Denmark/Japan) - Emission Trading Scheme (ETS) (Norway, Germany, U.K. & France) - US alternative – based upon EEDI. - World Shipping Council (WSC) – modified US alternative. - IUCN Proposal of Levy on Imported Goods. - Bahama proposal of doing nothing other than Technical and Operational Measures.")
81
Work Being Done At IMO EEDI and SEEMP will come into force as a part of MARPOL Annex VI by under tacit acceptance. Many leading maritime nations (European and Asian) are testing EEDI Formula and EEDI Base formula and carrying out impact assessment and reporting back to IMO for development of regulations that are equitable and implementable.
 are testing EEDI Formula and EEDI Base formula and carrying out impact assessment and reporting back to IMO for development of regulations that are equitable and implementable.")
82
MEPC 63 SESSION 27 FEB TO 02 MARCH 2012
EEDI Formula Correction Factors AGREED Bulk carriers and Tankers built to CSR Ship Specific Structural Enhancements Containerships – 70% Deadweigtht Chemical carriers Cubic correction factor ICE Class ships ALL SHIPS - Weather correction factor option Minimum Power and Mimnimum Speed – No AGREEMENT reached – defer to MEPC 64

83
Epilogue – Crisis ; Danger or Opportunity ?
선진국 및 대형 조선소들은 현재의 논의 과정을 위기로 생각하지 않고 기회로 생각하고 있습니다. Danger Climate Change Opportunity Green Growth 83

84
Coming together is a beginning, Staying together is progress & Working together is a success - Henry Ford Viswa Lab will be happy to be your partner in these endeavors and to achieve these goals together THANK YOU

Similar presentations


/46 CFR ppm Bilge Separators 15 ppm Bilge Alarms>")


 Processes by: Dr. Attia Saad El-Din Energy.>")