Download presentation
Presentation is loading. Please wait.

1
Feed: Sourcing, Pricing and Evaluating
Bart Borg Murphy Brown LLC Ames, Iowa

2
Outline Shuanghui International purchase of Smithfield Foods
Key decision points for: Feed pricing Feed sourcing Feed quality and efficiency evaluation Wrap up

3
Transaction Overview On September 26, 2013, Smithfield became a wholly- owned subsidiary of Shuanghui International Holdings Limited, creating a leading, vertically integrated global pork enterprise Smithfield will continue to operate as Smithfield Foods and under its existing brand names

4
Who is Shuanghui? Shuanghui International Holdings Limited is a Hong Kong-based holding company, which owns a variety of businesses that include food and logistics Shuanghui International and its subsidiaries are the majority shareholders of China’s largest meat processor, Henan Shuanghui Investment & Development Co. Shuanghui began operating a single meat processing plant in Luohe City, part of Henan Province, China, in April of 1969 Shuanghui International counts among its shareholders CDH Investments, Goldman Sachs, New Horizon, Kerry Group, and Temasek, as well as Shuanghui employees and management

5
The Same Old Smithfield, But Better!
No changes expected in how Smithfield does business operationally in the U.S. and throughout the world Shuanghui is committed to maintaining Smithfield operations, staff and management: Headquarters will remain in Smithfield, VA No closures at facilities and locations Management teams and workforces will continue in place Smithfield will continue to work with the same U.S. producers and suppliers

6
Who is Shuanghui?

7
Partnership that is all about Growth
China has 1.35 billion people, many of whom are moving rapidly into the middle class and desire more and better-quality protein in their and their family’s diets Pork is by far the leading protein in the Chinese diet, representing over 60 percent of all protein consumed Chinese consume more than 20 pounds more pork per capita per year than Americans Over the last 15 years, Chinese per capita consumption has grown by 25 percent and US per capita consumption has shrunk by 10 percent Pork is the number three protein in the US, but the number one protein in China China is responsible for 50 percent of the world’s pork consumption and their demand is still growing, whereas pork demand in the US has been declining for almost 15 years

8
Improving the Agricultural Environment in US and China
Growing exports is a key strategic objective for this partnership Exports currently account for 30 percent of Smithfield’s fresh pork revenue Exports are also critical to the US industry on a whole China is the fastest-growing and largest overseas market in terms of potential demand

9
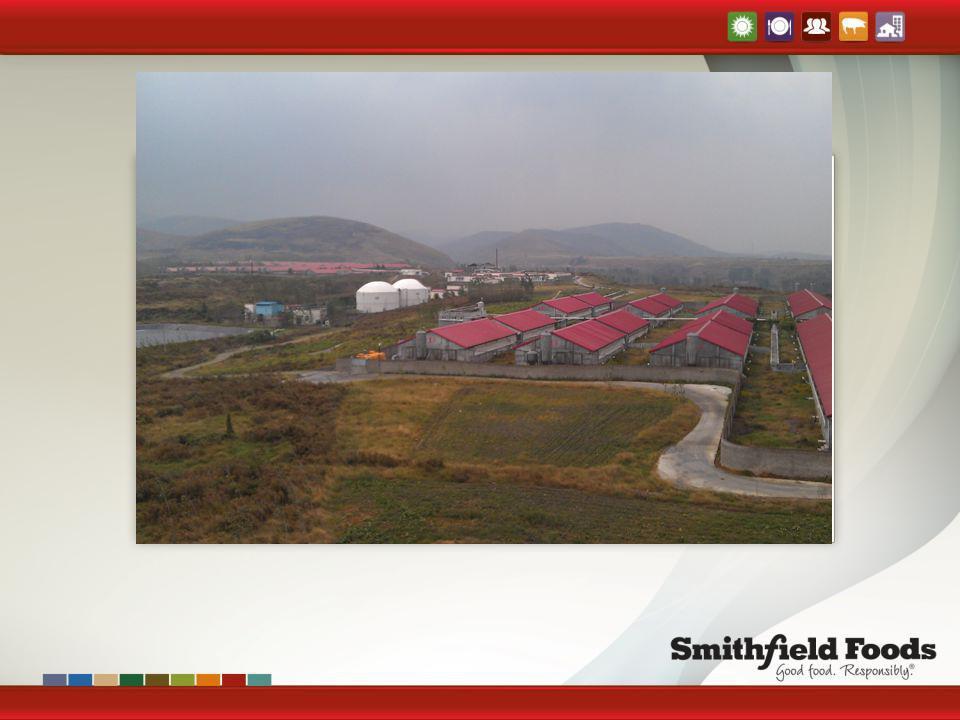
Corn Harvest in Henan Province, China

11
Feed: Largest Variable Cost
Insert your presentation title here 29 October 2004 Feed: Largest Variable Cost It is commonly understood that feed is the largest cost of production, but it is interesting to note using AgriStats data (45% US market share and 50 participating companies) shows that feed cost has increase from 60 to 70% of the total cost. Source AgriStats, 2011 Rabo
 shows that feed cost has increase from 60 to 70% of the total cost. Source AgriStats, Rabo.")
13
Sensitivity Analysis – Hog Production

14
Feed Energy Content and Cost of Production
Average Daily Gain Feed Conversion Feed milling and transport capacity Cost of Production

15
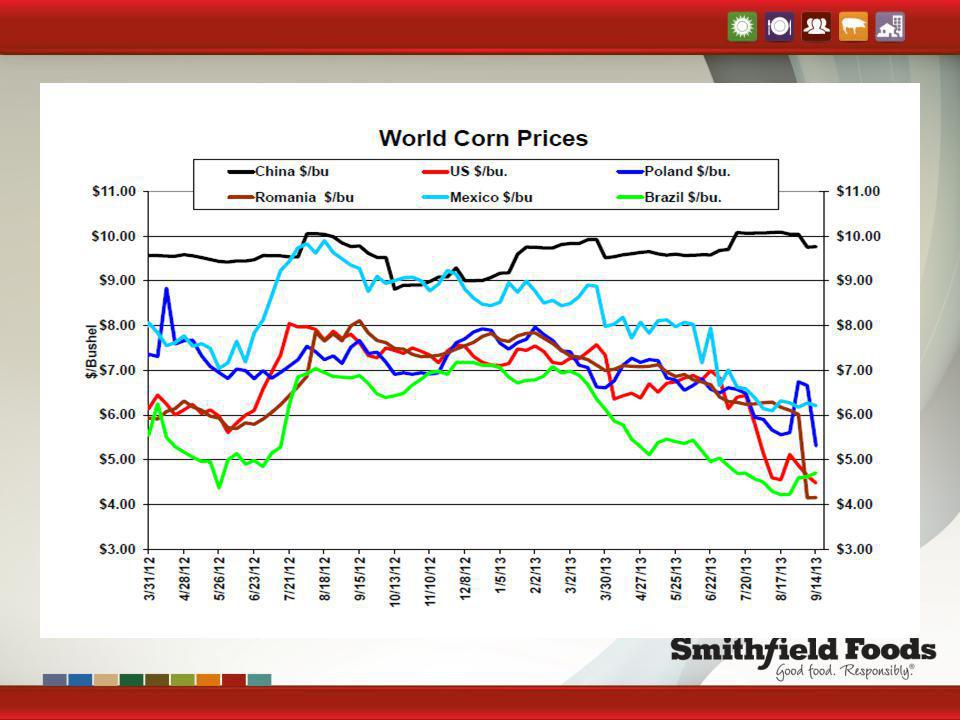
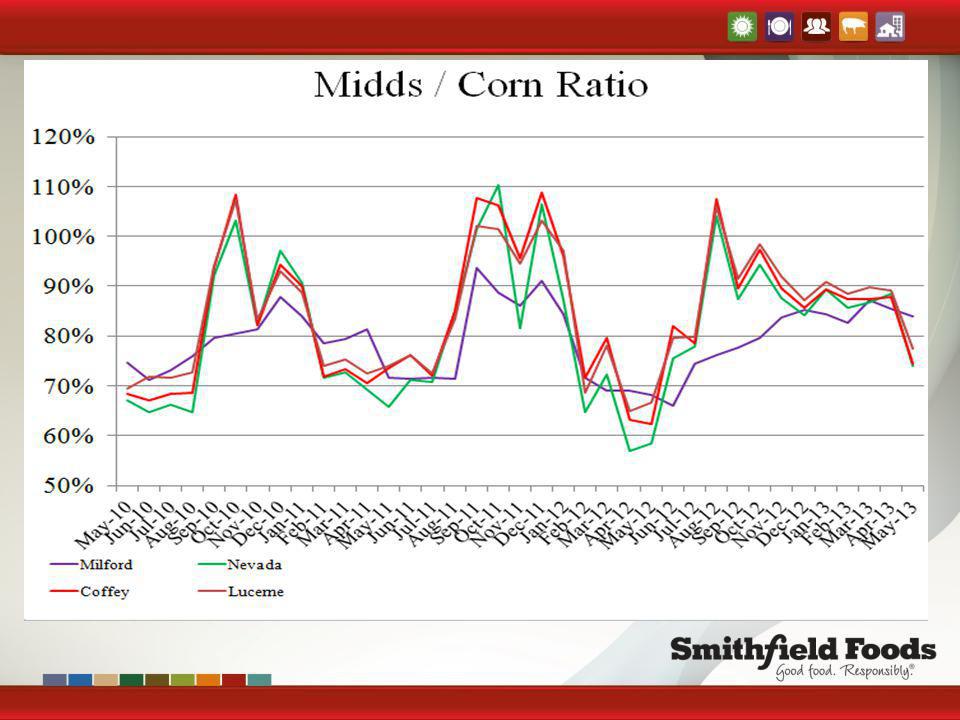
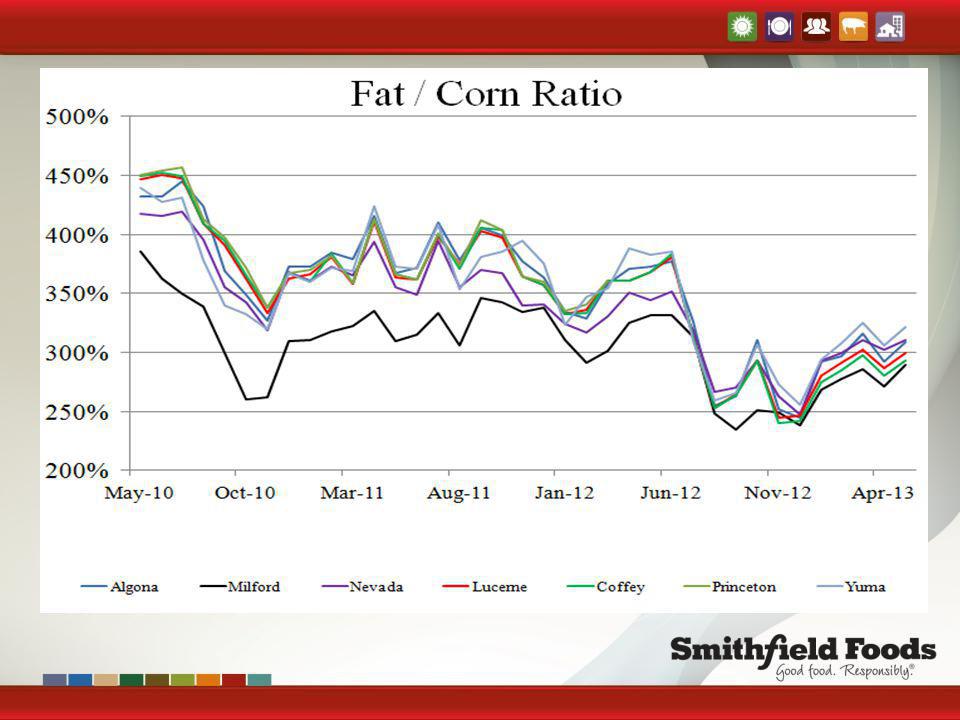
Routine Ingredient Price Monitoring
Important to bench mark alternative ingredients to a standard (i.e. corn) Three scenarios: Seasonal ingredient price flux relative to corn- midds Little flux relative to corn – DDGS Opportunities in particular regions and significant change over time - fat
 Three scenarios: Seasonal ingredient price flux relative to corn- midds. Little flux relative to corn – DDGS. Opportunities in particular regions and significant change over time - fat.")
17
Oil removal occurring across plants at a rapid rate

19
Feed Source Modeling Output

20
Feed Sourcing Considerations
Unbundle the cost of feed delivered to the farm Feed milling costs Pellets or mash; micron size of grain Feed transportation costs Feed ingredient costs Highly influenced by grain micron size Alternative ingredient opportunities The combination of the three is our eventual cost of feed at each site

21
Feed Processing Opportunities

22
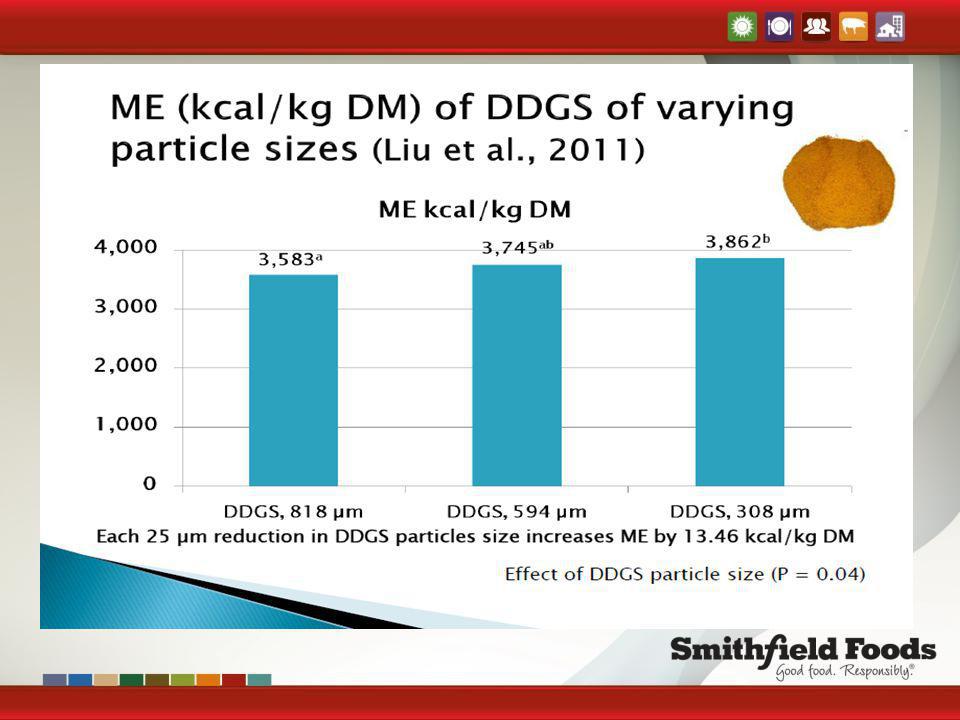
Grinding Reducing particle size of grain increases surface area
Improved digestion – improved feed conversion Reduces diet costs to achieve the same dietary energy content

23
Particle for pellets – less 300 microns
Mash – microns

24
ME Content of Corn with Differing Micron Size
5% ME difference -- U of IL/Renessen, 2008

25
Diet Cost per Ton at Various Corn Costs and Micron Sizes *
Cost/pig fed would differ by approximately $3.30/pig Corn Cost, $/bu Corn Micron Size 3.00 6.00 400 164.04 255.85 600 169.72 266.36 800 175.12 276.33 * Isocaloric diets using fat addition to standardize energy content and fat prices held at 350% of corn

26
Milling Energy and Pellet Durability Across Various Corn Micron Size
1,000 800 600 400 Pellet durability, % 78.8 79.4 82.4 86.4 Milling energy, Kwh/ton 2.66 3.06 3.81 8.09 Milling cost, $/ton .213 .244 .306 .647 Wondra et. al., 1992 Electricity at $.08/kwh

28
Evaluation of Pelleting
Production considerations; Feed conversion impact or diet cost reduction Potential for improved ADG Mortality change with some genotypes?? Opportunity to use increased amounts of ingredients that may cause bulk density or flow challenges Fine ground grain Alternative ingredients – bakery by-product, wheat midds, etc.

29
Estimated net financial value is $12-13 per ton compared to mash

30
Effect of Diet Form on Finishing Feed Conversion
$2.60/ head opportunity Controlled test at MB Poorly pelleted feeds (30-50% pellets) have comparable f/g to meal feed Working to improve pellet quality with a target 70% + SEM = .05; Quadratic response P<.008 Murphy Brown LLC, 2003
 have comparable f/g to meal feed. Working to improve pellet quality with a target 70% + SEM = .05; Quadratic response P<.008. Murphy Brown LLC,")
31
--Stark, NC State, 2011

32
Feed Evaluation Nutrient content monitoring and validation
Are you getting what you’re expecting Simple moisture, protein, fat and macro mineral analysis Mycotoxin testing and monitoring Set maximum allowable mycotoxin specification from the feed source and/or verify through periodic testing Efficiency of use (i.e. feed conversion)
")
33
Projected Feed Cost Savings, $ per market pig
Corn price, $/bushel*: Feed efficiency improvement: $5.00 $6.00 $7.00 6% $ 4.12 $ $ 5.66 8% $ 5.50 $ $ 7.55 10% $ 6.87 $ $ 9.44 *Assumes a constant price ratio of corn to SBM and fat

35
Feed Efficiency: Outcome metric not a lead indicator
Marginal metric for effective benchmarking Requires extensive standardization adjustments Mortality Dietary nutrient levels (ME and AA density) Physical form Market weight Paylean use Place weight
 Physical form. Market weight. Paylean use. Place weight.")
36
Drivers of Feed Conversion Change
Dietary energy/nutrient content Use of pellets or mash feed - Enzymes?? Grain micron size Lean deposition rate Sex - Improvest Genetics - Paylean Placement and sale weight Health status- livability When your plan for any of the above varies, the outcome based Feed/Gain expectation can vary tremendously.

37
Making Sense of Feed Conversion in a Production System

38
Example of Standardized Feed Efficiency
Plan Actual Difference better than plan Adjusted plan 2.685 Difference worse than plan Estimated cost variance $-0.36 per cwt The key is being able to define as much of the variance of adjusted plan to actual as is possible.

39
Average Daily Lactation Feed Intake

40
Weaned Pig Weight

41
Lactation Feed Conversion

42
Summary Feed sourcing decisions become much more clear when the delivered to the farm cost is unbundled into milling, delivery and ingredient costs. Monitoring key ingredients relative to corn can help in identifying opportunity purchases. Grain micron size if a key driver in overall diet digestibility and resulting costs. Many variables effect the feed conversion metric. It is important to understand their individual impacts and adjust expectations accordingly.

Similar presentations


 Agribusiness Breakfast Unilever Sustainable Sourcing Meeting 27 August 2012.>")


