Download presentation
Presentation is loading. Please wait.

2
6 Efficiency and Fairness of Markets
CHAPTER Notes and teaching tips: 5, 32, 39, 40, 41, 56, 57, 75, and 78. To view a full-screen figure during a class, click the red “expand” button. To return to the previous slide, click the red “shrink” button. To advance to the next slide, click anywhere on the full screen figure.

3
C H A P T E R C H E C K L I S T When you have completed your study of this chapter, you will be able to 1 Describe the alternative methods of allocating resources and define and explain the features of an efficient allocation. 2 Distinguish between value and price and define consumer surplus. 3 Distinguish between cost and price and define producer surplus.

4
C H A P T E R C H E C K L I S T When you have completed your study of this chapter, you will be able to 4 Evaluate the efficiency of the alternative methods of allocating scare resources. 5 Explain the main ideas about fairness and evaluate the fairness of alternative methods of allocating scarce resources

5
6.1 ALLOCATION METHODS AND EFFICIENCY
Resource Allocation Methods Scare resources might be allocated by Market price Command Majority rule Contest First-come, first-served Sharing equally Lottery Personal characteristics Force How does each method work? Make the discussion of this topic concrete and real. Come to class with something of low but positive value that you’ve going to end up giving to a student. How will the decision about who gets the object be made? Make the class debate the pros and cons of each of the methods. If you did the demand curve experiment, remind the class that market price allocated the bottles of water. The question now is does market price do a good job?

6
6.1 ALLOCATION METHODS AND EFFICIENCY
Market Price When a market allocates a scarce resource, the people who get the resource are those who are willing to pay the market price. Most of the scarce resources that you supply get allocated by market price. You sell your labor services in a market, and you buy most of what you consume in markets. For most goods and services, the market turns out to do a good job.

7
6.1 ALLOCATION METHODS AND EFFICIENCY
Command Command system allocates resources by the order (command) of someone in authority. For example, if you have a job, most likely someone tells you what to do. Your labor time is allocated to specific tasks by command. A command system works well in organizations with clear lines of authority but badly in an entire economy.
 of someone in authority. For example, if you have a job, most likely someone tells you what to do. Your labor time is allocated to specific tasks by command. A command system works well in organizations with clear lines of authority but badly in an entire economy.")
8
6.1 ALLOCATION METHODS AND EFFICIENCY
Majority Rule Majority rule allocates resources in the way that a majority of voters choose. Societies use majority rule for some of their biggest decisions. For example, tax rates that allocate resources between private and public use and tax dollars between competing uses such as defense and health care. Majority rule works well when the decision affects lots of people and self-interest must be suppressed to use resources efficiently.

9
6.1 ALLOCATION METHODS AND EFFICIENCY
Contest A contest allocates resources to a winner (or group of winners). The most obvious contests are sporting events but they occur in other arenas: For example, The Oscars are a type of contest. Contest works well when the efforts of the “players” are hard to monitor and reward directly.
. The most obvious contests are sporting events but they occur in other arenas: For example, The Oscars are a type of contest. Contest works well when the efforts of the players are hard to monitor and reward directly.")
10
6.1 ALLOCATION METHODS AND EFFICIENCY
First-Come, First-Served A first-come, first-served allocates resources to those who are first in line. Casual restaurants use first-come, first served to allocate tables. Supermarkets also uses first-come, first-served at checkout. First-come, first-served works best when scarce resources can serves just one person at a time in a sequence.

11
6.1 ALLOCATION METHODS AND EFFICIENCY
Sharing Equally When a resource is shared equally, everyone gets the same amount of it. You might use this method to share a dessert in a restaurant. To make sharing equally work, people must be in agreement about its use and implementation. It works best for small groups who share common goals and ideals.

12
6.1 ALLOCATION METHODS AND EFFICIENCY
Lottery Lotteries allocate resources to those with the winning number, draw the lucky cards, or come up lucky on some other gaming system. State lotteries and casinos reallocate millions of dollars worth of goods and services each year. But lotteries are more widespread. For example, the FAA uses lotteries to allocate landing slots at New York’s LaGuardia airport. Lotteries work well when there is no effective way to distinguish among potential users of a scarce resource.

13
6.1 ALLOCATION METHODS AND EFFICIENCY
Personal Characteristics Personal characteristics allocate resources to those with the “right” characteristics. For example, people choose marriage partners on the basis of personal characteristics. But this method gets used in unacceptable ways: allocating the best jobs to white males and discriminating against minorities and women.

14
6.1 ALLOCATION METHODS AND EFFICIENCY
Force Force plays a role in allocating resources. For example, war has played an enormous role historically in allocating resources. Theft, taking property of others without their consent, also plays a large role. But force provides an effective way of allocating resources—for the state to transfer wealth from the rich to the poor and establish the legal framework in which voluntary exchange can take place in markets.

15
6.1 ALLOCATION METHODS AND EFFICIENCY
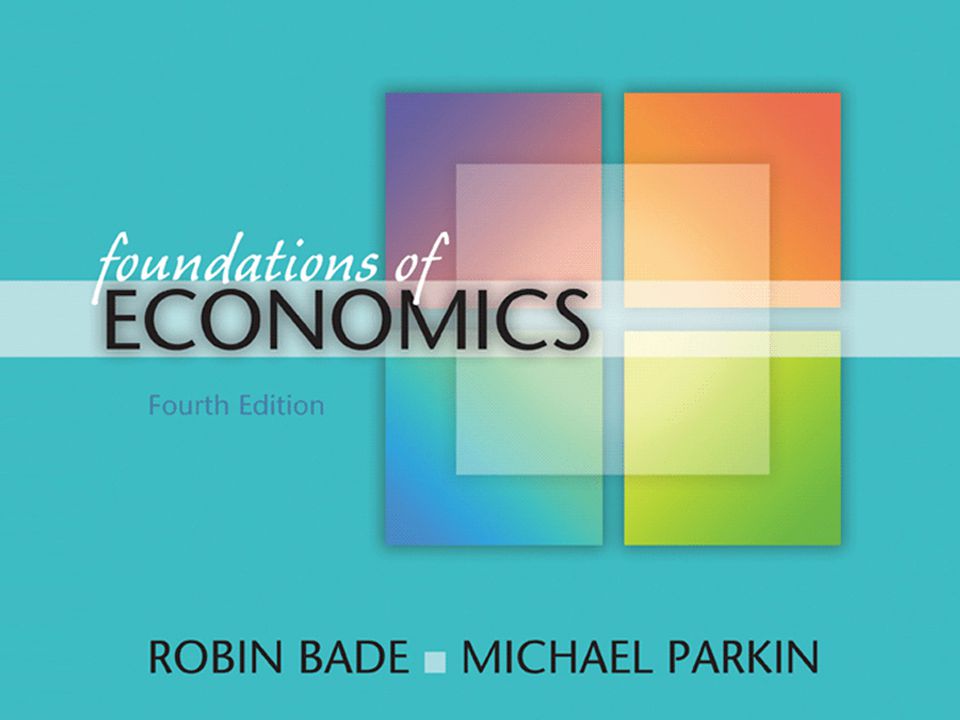
Using Resources Efficiently Allocative efficiency is a situation in which the quantities of goods and services produced are those that people value most highly. It is not possible to produce more of one good or service without producing less of something else. Allocative Efficiency and the PPF Production efficiency—producing on PPF Producing at the highest-valued point on PPF The PPF tells us what can be produced, but the PPF does not tell us about the value of what we produce.

16
6.1 ALLOCATION METHODS AND EFFICIENCY
Marginal Benefit Marginal benefit is the benefit that a person receives from consuming one more unit of a good or service. People’s preferences determine marginal benefit. The marginal benefit from a good is what people are willing to forgo to get one more unit of the good. Marginal benefit decreases as the quantity of the good increases—the principle of decreasing marginal benefit.

17
6.1 ALLOCATION METHODS AND EFFICIENCY
Possibility A and point A tell us that if we produce 2,000 pizzas a day, people are willing to give up 15 units of other goods and services up to get one more pizza.

18
6.1 ALLOCATION METHODS AND EFFICIENCY
Point B tells us that if we produce 4,000 pizzas a day, people are willing to give up 10 units of other goods and services to get one more pizza.

19
6.1 ALLOCATION METHODS AND EFFICIENCY
Point C tells us that if we produce 6,000 pizzas a day, people are willing to give up 5 units of other goods and services to get one more pizza. The line passing through points A, B, and C is the marginal benefit curve.

21
6.1 ALLOCATION METHODS AND EFFICIENCY
Marginal Cost Marginal cost is the opportunity cost of producing one more unit of a good or service and is measured by the slope of the PPF. The marginal cost of producing a good increases as more of the good is produced. The marginal cost curve shows the amount of other goods and services that we must give up to produce one more pizza.

22
6.1 ALLOCATION METHODS AND EFFICIENCY
Possibility A and point A tell us that if we produce 2,000 pizzas a day, we must give up 5 units of other goods and services to produce one more pizza.

23
6.1 ALLOCATION METHODS AND EFFICIENCY
Point B tell us that if we produce 4,000 pizzas a day, we must give up 10 units of other goods and services to produce one more pizza.

24
6.1 ALLOCATION METHODS AND EFFICIENCY
Point C tell us that if we produce 6,000 pizzas a day, we must give up 15 units of other goods and services to produce one more pizza. The line passing through points A, B, and C is the marginal cost curve.

26
6.1 ALLOCATION METHODS AND EFFICIENCY
Efficient Allocation The efficient allocation is the highest-valued allocation. That is, the allocation is efficient if it is not possible to produce more of any good without producing less of something else that is valued more highly. To find the efficient allocation, we compare marginal benefit and marginal cost. Figure 6.3 on the next slide shows the efficient quantity of pizza.

27
6.1 ALLOCATION METHODS AND EFFICIENCY
Production efficiency occurs at all points on the PPF. Allocative efficiency occurs at the intersection of the marginal benefit curve (MB) and the marginal cost curve (MC). Allocative efficiency occurs at only one point on the PPF.
 and the marginal cost curve (MC). Allocative efficiency occurs at only one point on the PPF.")
28
6.1 ALLOCATION METHODS AND EFFICIENCY
1. When 2,000 pizzas are produced, marginal benefit exceeds marginal cost, so the efficient quantity is larger. Too little pizza is being produced. Increase the quantity of pizza by moving along the PPF.

30
6.1 ALLOCATION METHODS AND EFFICIENCY
2. When 6,000 pizzas are produced, marginal cost exceeds marginal benefit, so the efficient quantity is smaller. Too much pizza is being produced. Decrease the quantity of pizza by moving along the PPF.

32
6.2 VALUE, PRICE, CONSUMER SURPLUS
Demand and Marginal Benefit Buyers distinguish between value and price. Value is what the buyer gets. Price is what the buyer pays. The value of one more unit of a good or service is its marginal benefit. Marginal benefit can be measured as the maximum price that people are willing to pay for another unit of the good or service. Draw a demand curve and emphasize its two interpretations. Use numbers for the price and quantity to make the otherwise abstract discussion more concrete.

33
6.2 VALUE, PRICE, CONSUMER SURPLUS
The consumer will buy one more unit of a good or service if its price is less than or equal to the value the consumer places on it. A demand curve is a marginal benefit curve. For example, the demand curve for pizza tells us the dollars worth of other goods and services that people are willing to forgo to consume one more pizza. That is, the demand curve for pizza shows the value the consumer places on each pizza.

34
6.2 VALUE, PRICE, CONSUMER SURPLUS
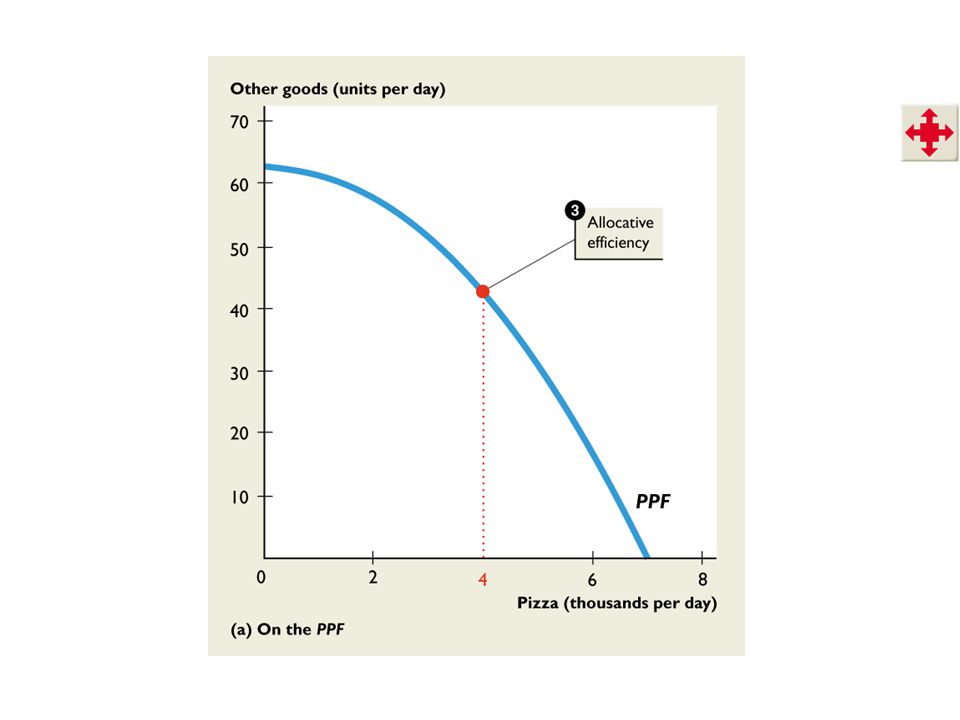
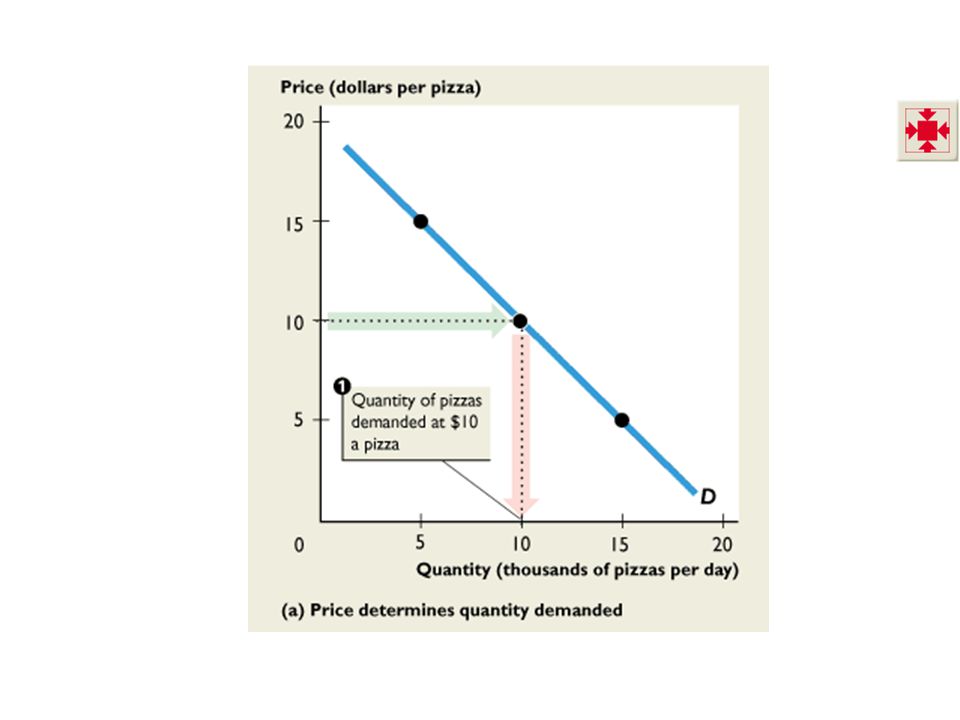
Figure 6.4 shows demand, willingness to pay, and marginal benefit. The demand curve shows: 1. The quantity demanded at each price, other things remaining the same.

36
6.2 VALUE, PRICE, CONSUMER SURPLUS
Figure 6.4 shows demand, willingness to pay, and marginal benefit. The demand curve shows: 1. The quantity demanded at each price, other things remaining the same. 2. The maximum price willingly paid for the last pizza available.

38
6.2 VALUE, PRICE, CONSUMER SURPLUS
Consumer surplus is the marginal benefit from a good or service minus the price paid for it, summed over the quantity consumed. Figure 6.5 on the next slide shows the consumer surplus from pizza.

39
6.2 VALUE, PRICE, CONSUMER SURPLUS
1. The market price of a pizza is $10. 2. People buy 10,000 pizzas a day and spend $100,000 a day on pizza. 3. But people are willing to pay $15 for the 5,000th pizza, so consumer surplus from that pizza is $5. The consumer surplus, producer surplus, and deadweight loss are all generally triangular in shape. Indeed, if you draw only linear demand and supply curves and do not make either curve vertical or horizontal, these surpluses and any deadweight loss are triangles. So, it is a good idea to remind your students of the formula for calculating the area of a triangle. Make sure to do several examples of the calculation for both consumer and producer surplus. Remind them that this area represents a dollar value. This reminder is especially useful when you quantify the deadweight losses created by monopolies, quotas, subsidies, etc. Many students just see the loss to society as a loss of jobs or less output, but you can create more intuition by putting the loss in dollar terms.

40
6.2 VALUE, PRICE, CONSUMER SURPLUS
4. Consumer surplus from the 10,000 pizzas that people buy is the area of the green triangle. Consumer surplus from pizza is $50,000. The total benefit from pizza is the $100,000 that people spend on pizza plus the $50,000 consumer surplus that they receive—$150,000. The consumer surplus, producer surplus, and deadweight loss are all generally triangular in shape. Indeed, if you draw only linear demand and supply curves and do not make either curve vertical or horizontal, these surpluses and any deadweight loss are triangles. So, it is a good idea to remind your students of the formula for calculating the area of a triangle. Make sure to do several examples of the calculation for both consumer and producer surplus. Remind them that this area represents a dollar value. This reminder is especially useful when you quantify the deadweight losses created by monopolies, quotas, subsidies, etc. Many students just see the loss to society as a loss of jobs or less output, but you can create more intuition by putting the loss in dollar terms.

41
It always helps to use colored chalk, overheads, or PowerPoint slides when dividing up the demand-supply graph into producer surplus, consumer surplus, and deadweight loss. By using colored chalk or the other techniques, you can refer to area by color. In the text and PPT slides, we use color consistently: Consumer surplus is green Producer surplus is blue Total expenditure is blue Total cost is red Deadweight loss is gray.

42
6.3 COST, PRICE, PRODUCER SURPLUS
Supply and Marginal Cost Sellers distinguish between cost and price. Cost is what a seller must give up to produce the good. Price is what a seller receives when the good is sold. The cost of producing one more unit of a good or service is its marginal cost.

43
6.3 COST, PRICE, PRODUCER SURPLUS
The seller will produce one more unit of a good or service if the price for which it can be sold exceeds or equals its marginal cost. A supply curve is a marginal cost curve. For example, the supply curve of pizza tells us the dollars worth of other goods and services that firms must forgo to produce one more pizza. That is, the supply curve of pizza shows the seller’s cost of producing each unit of pizza.

44
6.3 COST, PRICE, PRODUCER SURPLUS
Figure 6.6 shows supply, minimum supply price, and marginal cost. The supply curve shows: 1. The quantity supplied at each price, other things remaining the same.

46
6.3 COST, PRICE, PRODUCER SURPLUS
Figure 6.6 shows supply, minimum supply price, and marginal cost. The supply curve shows: 1. The quantity supplied at each price, other things remaining the same. 2. The minimum price that firms must be offered to supply a given quantity of pizza.

48
6.3 COST, PRICE, PRODUCER SURPLUS
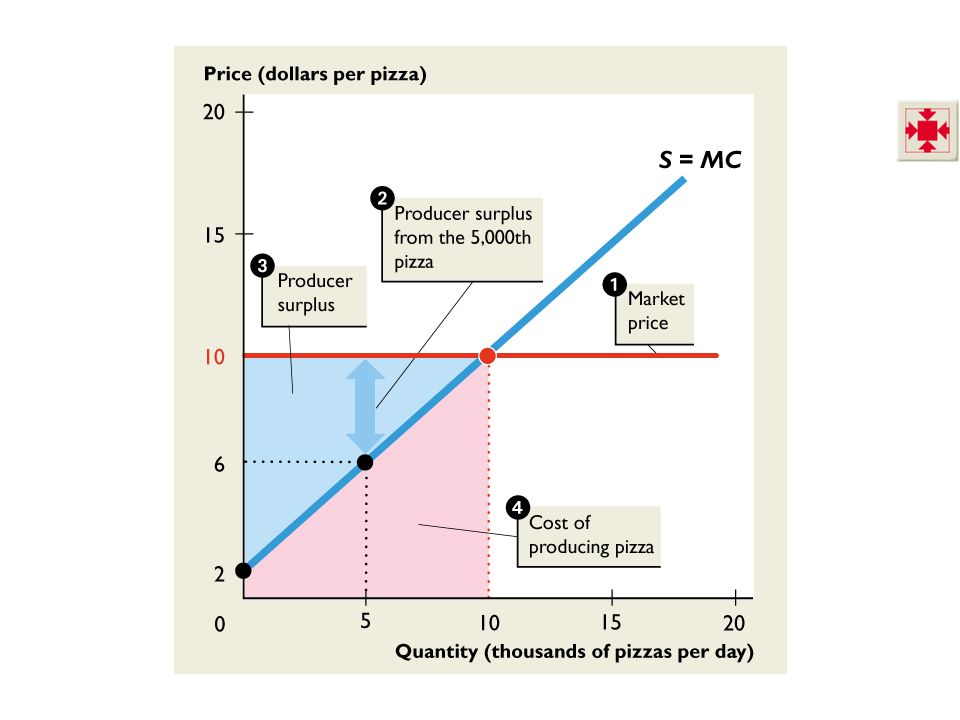
Producer surplus is the price of a good minus the opportunity cost of producing it, summed over the quantity produced. Figure 6.7 shows the producer surplus for pizza producers.

49
6.3 COST, PRICE, PRODUCER SURPLUS
1. The market price of a pizza is $10. At that price producers plan to sell 10,000 pizzas. 2. The marginal cost of producing the 5,000th pizza is $6, so the producer surplus on the 5,000th pizza is $4.

50
6.3 COST, PRICE, PRODUCER SURPLUS
3. Producer surplus from the 10,000 pizzas sold is $40,000 a day—the area of the blue triangle. 4. The cost of 10,000 pizzas a day is the red area under the marginal cost curve—total revenue of $100,000 minus the producer surplus of $40,000 and is $60,000 a day .

52
6.4 ARE MARKETS EFFICIENT? Figure 6.8 shows an efficient pizza market
1. Market equilibrium. 2. Marginal cost curve. 3. Marginal benefit curve. 4. When marginal cost equals marginal benefit, quantity is efficient. 5. Consumer surplus plus 6. Producer surplus is maximized.

54
6.4 ARE MARKETS EFFICIENT? In a competitive market:
The demand curve shows buyers’ marginal benefit. The supply curve shows the sellers’ marginal cost. So at the equilibrium in a competitive market, marginal benefit equals marginal cost. Resources allocation is efficient. So the competitive market delivers the efficient quantity.

55
Total Surplus is Maximized
6.4 ARE MARKETS EFFICIENT? Total Surplus is Maximized Total surplus is the sum of consumer surplus and producer surplus. The competitive equilibrium maximizes total surplus. Buyers seek the lowest possible price and sellers seek the highest possible price. But as buyers and sellers pursue their self-interest, the social interest is served.

56
The Invisible Hand 6.4 ARE MARKETS EFFICIENT?
Adam Smith in the Wealth of Nations (1776) suggested that competitive markets send resources to the uses in which they have the highest value. Smith believed that each participant in a competitive market is “led by an invisible hand to promote an end which was no part of his intention.” Although done just with words and a diagram, this chapter explains the astonishing so-called “first fundamental theorem of welfare economics” that under appropriate conditions, a competitive equilibrium is Pareto efficient. Though the textbook does not discuss Pareto efficiency, if you choose you can provide your students with more background to this astonishing result. It begins with Adam Smith’s invisible hand conjecture. Some progress was made by Vilfredo Pareto (1848–1923), an Italian economist (see who defined an efficient allocation as one in which it is not possible to rearrange the use of resources an make someone better off without making someone else worse off. But Adam Smith’s conjecture did not receive formal proof until the 1950s. Sir John Hicks, Kenneth Arrow, and Gerard Debreu, are credited with the major contributions to welfare economics and all received the Nobel Prize in Economic Sciences for their work (see for Sir John Hicks, and for Kenneth Arrow and Gerard Debreu. Lionel McKenzie (University of Rochester) is also credited with a major independent statement of the theorem and some economists refer to it as the Arrow-Debreu-McKenzie theorem. The A-D-M proof is deeper and more restricted that the arm waving words and diagrams of a principles text. But we do not mislead our students by being enthusiastic and amazed at the astonishing proposition. Selfish people all pursuing their own ends and making themselves as well off as possible end up allocating resources in such a way that no one can be made better off (qualified by the exceptions that we quickly note in the chapter.)
 suggested that competitive markets send resources to the uses in which they have the highest value. Smith believed that each participant in a competitive market is led by an invisible hand to promote an end which was no part of his intention. Although done just with words and a diagram, this chapter explains the astonishing so-called first fundamental theorem of welfare economics that under appropriate conditions, a competitive equilibrium is Pareto efficient. Though the textbook does not discuss Pareto efficiency, if you choose you can provide your students with more background to this astonishing result. It begins with Adam Smith’s invisible hand conjecture. Some progress was made by Vilfredo Pareto (1848–1923), an Italian economist (see who defined an efficient allocation as one in which it is not possible to rearrange the use of resources an make someone better off without making someone else worse off. But Adam Smith’s conjecture did not receive formal proof until the 1950s. Sir John Hicks, Kenneth Arrow, and Gerard Debreu, are credited with the major contributions to welfare economics and all received the Nobel Prize in Economic Sciences for their work (see for Sir John Hicks, and for Kenneth Arrow and Gerard Debreu. Lionel McKenzie (University of Rochester) is also credited with a major independent statement of the theorem and some economists refer to it as the Arrow-Debreu-McKenzie theorem. The A-D-M proof is deeper and more restricted that the arm waving words and diagrams of a principles text. But we do not mislead our students by being enthusiastic and amazed at the astonishing proposition. Selfish people all pursuing their own ends and making themselves as well off as possible end up allocating resources in such a way that no one can be made better off (qualified by the exceptions that we quickly note in the chapter.)")
57
Underproduction and Overproduction
6.4 ARE MARKETS EFFICIENT? Underproduction and Overproduction Inefficiency can occur because: Too little is produced—underproduction. Too much is produced—overproduction. Don’t get hung up on the mechanics of how the obstacles to efficiency work. Just note at this stage that they bring either underproduction or overproduction and emphasize the deadweight loss that they generate. You will go into the details in later chapters. The list is a guide to what is coming.

58
Underproduction 6.4 ARE MARKETS EFFICIENT?
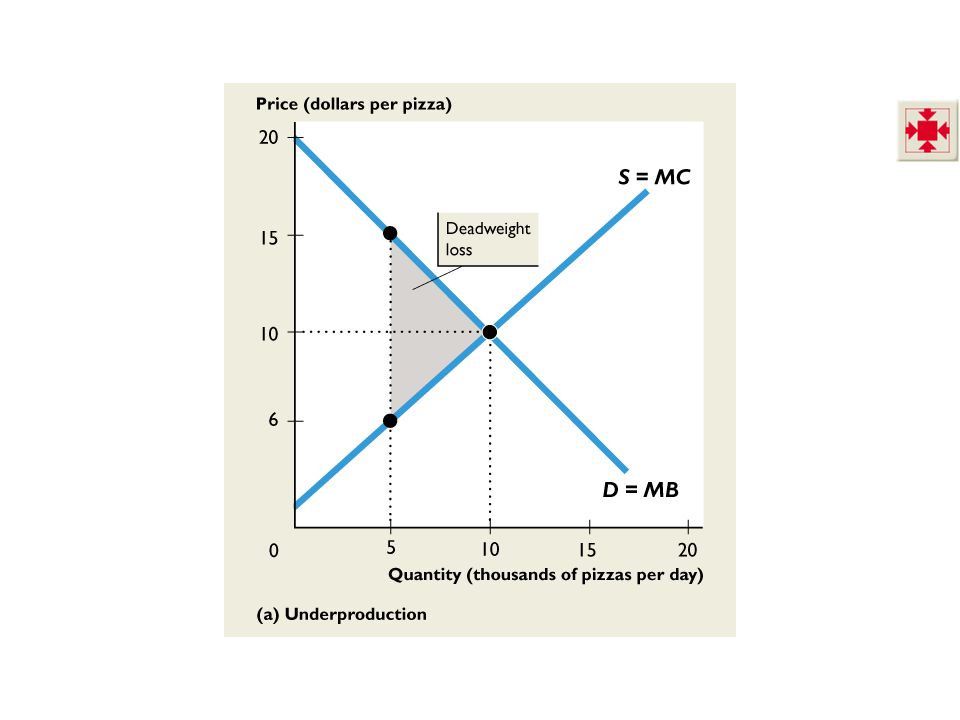
When a firm cuts production to less than the efficient quantity, a deadweight loss is created. Deadweight loss is the decrease in total surplus and that results from an inefficient underproduction or overproduction. The deadweight loss is borne by the entire society. It is a social loss.

59
6.4 ARE MARKETS EFFICIENT? Figure 6.9(a) shows the effects of underproduction. Efficient quantity is 10,000 pizzas. If production is 5,000 pizzas a day: Deadweight loss arises. Total surplus is reduced by the amount of the deadweight loss. Underproduction is inefficient.

61
Overproduction 6.4 ARE MARKETS EFFICIENT?
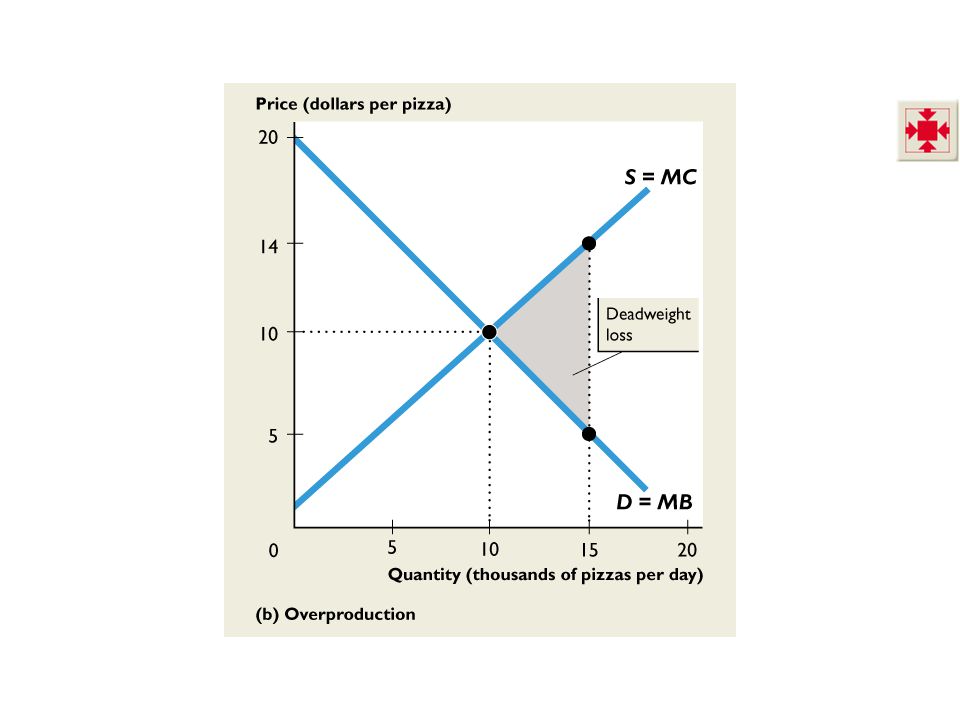
When the government pays producers a subsidy, the quantity produced exceeds the efficient quantity. A deadweight loss arises than reduces total surplus to less than its maximum.

62
6.4 ARE MARKETS EFFICIENT? Figure 6.9(b) shows the effects of overproduction. Efficient quantity is 10,000 pizzas. If production is 15,000 pizzas: A deadweight loss arises. Total surplus is reduced by the amount of the deadweight loss. Overproduction is inefficient.

64
6.4 ARE MARKETS EFFICIENT? Obstacles to Efficiency
Markets generally do a good job of sending resources to where they are most highly valued. But markets can be inefficient in the face of: • Price and quantity regulations • Taxes and subsidies • Externalities • Public goods and common resources • Monopoly High transactions costs

65
6.4 ARE MARKETS EFFICIENT? Price and Quantity Regulations
Price regulations sometimes put a block of the price adjustments and lead to underproduction. Quantity regulations that limit the amount that a farm is permitted to produce also leads to underproduction.

66
6.4 ARE MARKETS EFFICIENT? Taxes and Subsidies
Taxes increase the prices paid by buyers and lower the prices received by sellers. So taxes decrease the quantity produced and lead to underproduction. Subsidies lower the prices paid by buyers and increase the prices received by sellers. So subsidies increase the quantity produced and lead to overproduction.

67
6.4 ARE MARKETS EFFICIENT? Externalities
An externality is a cost or benefit that affects someone other than the seller or the buyer of a good. An electric utility creates an external cost by burning coal that creates acid rain. The utility doesn’t consider this cost when it chooses the quantity of power to produce. Overproduction results.

68
6.4 ARE MARKETS EFFICIENT? An apartment owner would provide an external benefit if she installed an smoke detector. But she doesn’t consider her neighbor’s marginal benefit and decides not to install the smoke detector. The result is underproduction.

69
6.4 ARE MARKETS EFFICIENT? Public Goods and Common Resources
A public good benefits everyone and no one can be excluded from its benefits. It is in everyone’s self-interest to avoid paying for a public good (called the free-rider problem), which leads to underproduction.
, which leads to underproduction.")
70
6.4 ARE MARKETS EFFICIENT? A common resource is owned by no one but used by everyone. It is in everyone’s self interest to ignore the costs of their own use of a common resource that fal on others (called tragedy of the commons), which leads to overproduction.
, which leads to overproduction.")
71
6.4 ARE MARKETS EFFICIENT? Monopoly
A monopoly is a firm that has sole provider of a good or service. The self-interest of a monopoly is to maximize its profit. To do so, a monopoly sets a price to achieve its self-interested goal. As a result, a monopoly produces too little and underproduction results.

72
6.4 ARE MARKETS EFFICIENT? High Transactions Costs Transactions costs are the opportunity costs of making trades in a market. To use market prices as the allocators of scarce resources, it must be worth bearing the opportunity cost of establishing a market. Some markets are just too costly to operate. When transactions costs are high, the market might underproduce.

73
6.4 ARE MARKETS EFFICIENT? Alternatives to the Market
No one method allocates resources efficiently. But supplemented by other methods, markets do an amazingly good job. Table 6.1 on the next slide shows some possible remedies for market inefficiencies.

74
6.4 ARE MARKETS EFFICIENT?

75
6.5 ARE MARKETS FAIR? It’s not fair if the rules aren’t fair
Two broad and generally conflicting views of fairness are: It’s not fair if the rules aren’t fair It’s not fair if the result isn’t fair. You could spend the rest of the course talking about and discussing equity, fairness, or distributive justice as it is sometimes called. The textbook contains a nice section laying out the basics needed to discuss fairness. This material is not standard and you’ll be hard pressed to find it in any other principles text. It is included here because students are very curious about what is fair. And the news media writes and talks of little else when it discusses economic issues. But make sure the students know that economists are professionals on efficiency but just like everyone else on fairness. There is a right and wrong about efficiency but not about fariness.

76
It’s Not Fair if the Rules Aren’t Fair
6.5 ARE MARKETS FAIR? It’s Not Fair if the Rules Aren’t Fair This idea translates into “equality of opportunity.” Harvard philosopher, Robert Nozick, in Anarchy, State, and Utopia, (1974) argues that the rules must be fair and must respect two principles: • The state must enforce laws that establish and protect private property. • Private property may be transferred from one person to another only by voluntary exchange.
 argues that the rules must be fair and must respect two principles: • The state must enforce laws that establish and protect private property. • Private property may be transferred from one person to another only by voluntary exchange.")
77
It’s Not Fair if the Result Isn’t Fair
6.5 ARE MARKETS FAIR? It’s Not Fair if the Result Isn’t Fair The fair rules approach is consistent with allocative efficiency, but the distribution might be “too unequal.” Most people recognize that there is no easy answer to principle to guide the amount of equality. The fair results approach conflicts with efficiency and leads to what is called the “big tradeoff.”

78
6.5 ARE MARKETS FAIR? The big tradeoff is a tradeoff between efficiency and fairness that recognizes the cost of making income transfers. The tradeoff is between the size of the economic pie and the degree of equality with which it is shared. The greater the amount of income redistribution through income taxes, the greater is the inefficiency —the smaller is the economic pie. Some years ago, Jim Tobin told Michael Parkin a nice test of whether a person is a liberal or a conservative. It also generates a good classroom discussion. Here’s how it goes. Give the students the following scenario and question: You are at an oasis in a large desert and you have some ice cream in an unmovable refrigerator. (Ice cream is the only food available). The people in the next oasis some miles away have no ice cream (and no other food) and are too old and infirm to travel. You have plenty of ice cream and you can transport it to the next oasis, but on the journey, some of it will melt. Now the question: How much of the ice cream would have to survive the journey for it to be worth transporting to the next oasis? The most liberal would transport if only the smallest percentage survived the journey. The most conservative would want a large proportion to survive before undertaking the redistribution.
. The people in the next oasis some miles away have no ice cream (and no other food) and are too old and infirm to travel. You have plenty of ice cream and you can transport it to the next oasis, but on the journey, some of it will melt. Now the question: How much of the ice cream would have to survive the journey for it to be worth transporting to the next oasis The most liberal would transport if only the smallest percentage survived the journey. The most conservative would want a large proportion to survive before undertaking the redistribution.")
79
6.5 ARE MARKETS FAIR? Taking all the costs of income transfers into account, the fair distribution of the economic pie is the one that makes the poorest person as well off as possible. The “fair results” ideas require a change in the results after the game is over. Some say that this in itself is unfair.

80
A Price Hike in a Natural Disaster
6.5 ARE MARKETS FAIR? A Price Hike in a Natural Disaster In a competitive market, the price of water jumps from $1 to $8 a bottle. Water is allocated efficiently. Nozick says the allocation is fair. But is it fair? Suppose that the government sets the price at which the shop owner can sell water at $1 a bottle and the government gives everyone an equal share.

81
6.5 ARE MARKETS FAIR? If voluntary exchange is permitted, people who value the water at less than $8 a bottle will sell their fair share, which they bought for $1 a bottle. The same people will consume the water—those who value the water at $8 a bottle. But there is a difference. The people who value the water at $8 a bottle but get it for $1 a bottle get a consumer surplus. The people who value the water for less that $8 a bottle sell the water they got for $1 a bottle for $8 and receive a producer surplus.

82
6.5 ARE MARKETS FAIR? So different people gain in the two situations.
But only in the competitive market case is there equality of opportunity. In the second case, everyone except the shop owner can sell water at the market price. This arrangement discriminates against the shop owner.

Similar presentations