Download presentation
Presentation is loading. Please wait.

1
DRG PAYMENT Dr Htin Zaw Soe MBBS, DFT, MMedSc (P & TM), PhD
Lecturer, Department of Biostatistics, University of Public Health, Yangon

2
(1) What is DRG ? (2) What is DRG Payment? (3) Historical Background (4) Impact of DRG (5) Types of DRG (6) DRG Implementation (7) Cost Estimation Methods (8) Opportunities and Challenges (9) Countries Using DRG (10) DRG and Myanmar (11) References
 DRG Implementation. (7) Cost Estimation Methods. (8) Opportunities and Challenges. (9) Countries Using DRG. (10) DRG and Myanmar. (11) References.")
3
(1) What is DRG? Diagnosis Related Group
A classification system that groups patients according to principal diagnosis, presence of a surgical procedure, age, presence or absence of significant co-morbidities or complications, and other relevant criteria (DRGs and the Medicare Program, 1983) OR A classification of hospital case types into groups that are clinically similar and are expected to have similar hospital resource use. The groupings are based on diagnoses, and may also be based on procedures, age, sex, and the presence of complications or co-morbidities (JC Langenbrunner et al, 2009) Grouping system of hospital admissions (Budi Hidayat, 2011)
 OR. A classification of hospital case types into groups that are clinically similar and are expected to have similar hospital resource use. The groupings are based on diagnoses, and may also be based on procedures, age, sex, and the presence of complications or co-morbidities (JC Langenbrunner et al, 2009) Grouping system of hospital admissions (Budi Hidayat, 2011)")
4
(2) What is DRG Payment? Any per-case hospital payment method in which differences in case-mix are taken into account using DRGs to classify case types (DRGs and the Medicare Program, 1983) DRGs - used in any hospital payment methods including retrospective cost-based reimbursement, but their importance use is as part of prospective per-case payment system (Per-case payment system: Any prospective hospital payment system with fixed rates of payment based on the hospital admission, not on the number and type of services or number of days of care provided)
 DRGs - used in any hospital payment methods including retrospective cost-based reimbursement, but their importance use is as part of prospective per-case payment system. (Per-case payment system: Any prospective hospital payment system with fixed rates of payment based on the hospital admission, not on the number and type of services or number of days of care provided)")
5
(3) Historical Background
- 1950s- Not everyone in US had health insurance - 1960s -Medicare and Medicaid was created - Late 1960s – Design and development of DRG at Yale University by Prof Robert Fetter (Founder of DRG) as an information management tool, and a devise for adjusting hospital performance for patients’ characteristics - Early 1970s – First operational set of DRG at Yale University - 1970s - A lot of distrust for the US government including lack of confidence in the American medical system - President Nixon created Managed Care Organizations (MCOs) → companies to provide health insurance for their employees
 as an information management tool, and a devise for adjusting hospital performance for patients’ characteristics. - Early 1970s – First operational set of DRG at Yale University s - A lot of distrust for the US government including lack of confidence in the American medical system. - President Nixon created Managed Care Organizations (MCOs) → companies to provide health insurance for their employees.")
6
- Late 1970s - First large scale application of DRG in New Jersey
- 1980s - Inpatient health care –reimbursed. Health care costs were out of control. No incentive to streamline costs – US Congress amended the Social Security Act - A National DRG-based Payment System used by Medicare to move reimbursement from retrospective (cost per service) to prospective (tariff per-case) to cut costs for its beneficiaries – Eventually “migrated” to other payers in the US, and to most healthcare systems in affluent countries (Social insurance and NHS-based systems)
 to prospective (tariff per-case) to cut costs for its beneficiaries. – Eventually migrated to other payers in the US, and to most healthcare systems in affluent countries (Social insurance and NHS-based systems)")
7
(4) Impact of DRG - Mainly for cost-containment: create incentives for hospitals to control/reduce the costs, to reduce the LOS of patients and to increase number of inpatient admissions, → increase efficiency • Evidence (controversial; Pauly 2001): impact in the US – Reduction in Length of Stay (up to 25%) – Lower rate of growth of hospital costs – Decrease in hospital profit margins (~ DRG tariff: rational?) – BUT: No evidence of significant impact on quality & outcome Other effects: up-coding; effects on out-patient care costs
: impact in the US. – Reduction in Length of Stay (up to 25%) – Lower rate of growth of hospital costs. – Decrease in hospital profit margins (~ DRG tariff: rational ) – BUT: No evidence of significant impact on quality & outcome. Other effects: up-coding; effects on out-patient care costs.")
8
(5) Types of DRGs 1. Medicare DRGs
2. Refined DRGs (R-DRGs): Differences in age, complications and morbidities 3. Severity DRGs (S/SR-DRGs): re-evaluate complications and morbidities 4. All Patient DRGs (AP-DRGs): not only Medicare, but add HIV and Pediatric cases 5. All Patient Refined DRGs (APR-DRGs): two groups (severity and risk of mortality)
: Differences in age, complications and morbidities. 3. Severity DRGs (S/SR-DRGs): re-evaluate complications and morbidities. 4. All Patient DRGs (AP-DRGs): not only Medicare, but add HIV and Pediatric cases. 5. All Patient Refined DRGs (APR-DRGs): two groups (severity and risk of mortality)")
9
(6) DRG Implementation • A classification of hospital admissions
– Based on data normally collected (demographic and clinical; based on the medical clinical record) – Medically reasonable and administratively manageable – Iso-resource (variance between cases in the same group kept at minimum) – Typically to each group is associated a value (tariff) or a weight Grouping • Value/weight attached to each group
 – Medically reasonable and administratively manageable. – Iso-resource (variance between cases in the same group kept at minimum) – Typically to each group is associated a value (tariff) or a weight Grouping. • Value/weight attached to each group.")
17
(7) Cost Estimation Methods
- Basic concept - DRG tariffs and costing - DRG payment formula - Costing methods

20
• Various approaches to set “tariffs” (not only cost analysis):
DRG tariffs and costing • Various approaches to set “tariffs” (not only cost analysis): – Hospital market characteristics – General rules about healthcare funding (e.g. global budget) – Policy objectives (e.g. to discourage specific interventions) – Incentives (statically and dynamically)
: – Hospital market characteristics. – General rules about healthcare funding (e.g. global budget) – Policy objectives (e.g. to discourage specific interventions) – Incentives (statically and dynamically)")
21
• European countries adopt various cost-analysis models and
discretional choices on several relevant issues (allocation of overheads, direct/indirect attribution depending of the features of the information systems) – How tariffs can/should relate to costs depend on the nature of the system (NHS versus insurance-based systems) and policy objectives – Focus on direct costs [cost directly attributable to the patient (case)]
 – How tariffs can/should relate to costs depend on the nature of the system (NHS versus insurance-based systems) and policy objectives. – Focus on direct costs [cost directly attributable to the patient (case)]")
22
DRG payment = [a × b] + [c] a = DRG relative weight
DRG payment formula DRG payment = [a × b] + [c] a = DRG relative weight b = Hospital base rate c = Outlier adjustment DRG weight, hospital base rate and outlier adjustment are updated annually. (Recalibration) (Budi Hidayat, 2011)
![DRG payment = [a × b] + [c] a = DRG relative weight](http://slideplayer.com/slide/1601084/5/images/22/DRG+payment+%3D+%5Ba+%C3%97+b%5D+%2B+%5Bc%5D+a+%3D+DRG+relative+weight.jpg "DRG payment formula. DRG payment = [a × b] + [c] a = DRG relative weight. b = Hospital base rate. c = Outlier adjustment. DRG weight, hospital base rate and outlier adjustment are updated annually. (Recalibration) (Budi Hidayat, 2011)")
23
DRG relative weight vs. HBR
- Claim “charges” converted to “cost” using cost-to-charge ratios - DRG relative weight = Average cost of discharges per DRG ÷ Average cost of all discharges (eg. $ 1,200 ÷ $ 1,000 = 1.2) . Hospital base rate A different rate is computed for each cost-related peer group Peer groups are chosen to minimize cost variation within groups and maximize variation between groups Peer group classification is updated each year based on current hospital characteristics and average costs
 . Hospital base rate. A different rate is computed for each cost-related peer group. Peer groups are chosen to minimize cost variation within groups and maximize variation between groups. Peer group classification is updated each year based on current hospital characteristics and average costs.")
24
Calculating DRG payment (in details)
DRG payment = (Standardized amount × DRG weight) + Add ons Standardized amount = (Labor component × Wage index) Non-labor component Add-ons are (i) Disproportionate share payment (ii) Indirect medical education payment (iii) Outlier (iv) Capital (v) New technology (Office of Inspector General/OEI, 2001) (Ohio Hospital Association, 2011)
 + Add- ons. Standardized amount = (Labor component × Wage index) + Non-labor component. Add-ons are (i) Disproportionate share payment. (ii) Indirect medical education payment. (iii) Outlier. (iv) Capital. (v) New technology. (Office of Inspector General/OEI, 2001) (Ohio Hospital Association, 2011)")
25
For example: - Sara, a 72 year old widow fell off her front porch. - An ambulance transported her to Generic Hospital, a Medicare-certified hospital in San Francisco. - She is diagnosed with an open fracture of the left femur requiring surgical intervention. - In addition, physician determines from her medical history that she has NIDD with associated peripheral vascular disorder.

26
Step 1. Calculating the standardized amount
Standardized amount = Labor component + Non-labor component = US $ 2, US $ 1,141.85 (San Francisco is a large urban category, so US $ 1, is used for Non-labor component) Step 2. Adjusting for the ‘wage index’ (Wage index for San Francisco is ) Standardized amount = (Labor component × Wage index) Non-labor component = (US $ 2, × ) + US $ 1,141.8 = US $ 5,128.92
 Step 2. Adjusting for the ‘wage index’ (Wage index for San Francisco is ) Standardized amount = (Labor component × Wage index) + Non-labor component. = (US $ 2, × ) + US $ 1, = US $ 5,")
27
Step 3. Adjusting for DRG weight
(Relative weight for hip and femur procedure is ) DRG payment = Standardized amount × DRG weight = US $ 5, × = US $ 9,297.71 Step 4. Adjusting for ‘disproportionate share payment’ (Generic hospital qualifies as a disproportionate share hospital. The rate is ) Therefore DRG payment = US $ 9, × ( ) = US $ 10,611.47
 DRG payment = Standardized amount × DRG weight. = US $ 5, × = US $ 9, Step 4. Adjusting for ‘disproportionate share payment’ (Generic hospital qualifies as a disproportionate share hospital. The rate is ) Therefore DRG payment = US $ 9, × ( ) = US $ 10,")
28
Step 5. Adjusting for ‘indirect medical education payment’
(Adjustment factor for indirect medical education payment is ) DRG payment = US $ 9, × ( ) = US $ 11, Therefore the hospital was paid US $ 11, by Medicare for Sara’s care. If necessary, payments for outlier, capital and new technology are to be added.
 DRG payment = US $ 9, × ( ) = US $ 11, Therefore the hospital was paid US $ 11, by Medicare for Sara’s care. If necessary, payments for outlier, capital and new technology are to be added.")
29
Costing methods What is the cost of a health care intervention? Cost of Health Care • Outside of health, most items that we purchase daily have a readily observable cost • But, not true with health care – Insurance buffers patient from true cost – Charges, payments may not equal cost

31
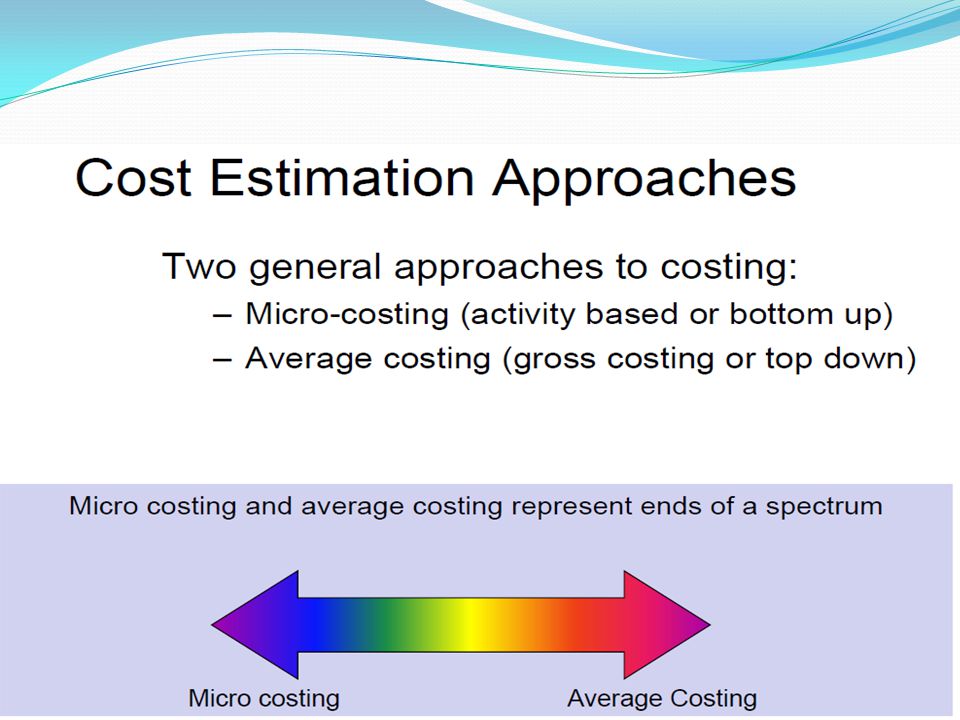
Micro- vs. Average-costing: difference?
Micro-costing • Determine each input, find its price, then sum (quantity*price) across all inputs • Gold standard, but resource intensive • Researchers use this approach in some circumstances Average-costing • Over a long period, divide total cost by total units of care provided • Less precise than micro-costing
 across all inputs. • Gold standard, but resource intensive. • Researchers use this approach in some circumstances. Average-costing. • Over a long period, divide total cost by total units of care provided. • Less precise than micro-costing.")
33
Method 1: Direct Measurement Used to the find the cost of : interventions & care unique Method: 1. Measure staff activity 2. Find labor cost 3. Find cost of supplies, capital, overhead

34
Finding Unit Cost Average cost – Total program cost divided by number of units – Assumes homogeneous products Relative Values needed for heterogeneous products – Find Relative Value of each product – Find cost per relative value unit (RVU) – Use this to find cost of each product Staff Activity Analysis Methods of finding staff activities – Track staff activity in a log – Estimate activity Need not be comprehensive; can sample activity Estimate labor cost
 – Use this to find cost of each product. Staff Activity Analysis. Methods of finding staff activities. – Track staff activity in a log. – Estimate activity. Need not be comprehensive; can sample activity. Estimate labor cost.")
35
Direct vs. Indirect vs. Overhead
1. Direct costs: costs that are tied to a particular encounter (e.g., staff time, medications) 2. Overhead: costs that cannot be tied to particular procedures (e.g., police, maintenance, food service) 3. Indirect: sometimes means overhead, and sometimes means non-salary benefits (e.g., health care, annual leave)
 2. Overhead: costs that cannot be tied to particular procedures (e.g., police, maintenance, food service) 3. Indirect: sometimes means overhead, and sometimes means non-salary benefits (e.g., health care, annual leave)")
36
Method 2: Pseudo-Bill What is a Pseudo Bill? . It is a method of assigning prices or costs to patient care encounters Typically applied to care provided by health care systems that do not normally bill patients for care. Examples: HMOs, many foreign health care systems Is an attempt to duplicate the information normally found on a provider bill for care that does not have a bill. There are two-parts to a pseudo bill: -What services were used/provided -The unit costs of each service

37
Method 3: Cost Regression Cost Function - Function is used to estimate relative value weights - Estimated from external data on cost and characteristics of stays (not from own study data) - Obtain characteristics of stay from own study - Apply function to estimate cost of stay Advantage: fewer variables than a pseudo-bill Disadvantage: could have large error for individual bills
 - Obtain characteristics of stay from own study. - Apply function to estimate cost of stay. Advantage: fewer variables than a pseudo-bill. Disadvantage: could have large error for individual bills.")
38
Cost Regression Dependent variable is charges or cost-adjusted charge (CAC) Independent variables: – Clinical information – Diagnosis Related Group – Diagnosis – Procedures – Vital status at discharge – Length of stay – Days of ICU care Cost data - frequently skewed → log transformation to make assumptions more tenable

39
Example: Medical/Surgical hospitalizations
A statistical model to estimate cost Step 1. Build a model with inpatient discharge data (Medicare) [Dependent variable is cost-adjusted charges (CAC)] CACi = β1 LOSi + β2 DRGi + β3 ICU daysi + β4 Agei +..ei Step 2. From the regression model, save the parameter estimates (βs) Step 3. Plug in our data to estimate cost Estimated cost = β1 LOSii + β2 DRGii + β3 ICU daysii + β4 Ageii
 [Dependent variable is cost-adjusted charges (CAC)] CACi = β1 LOSi + β2 DRGi + β3 ICU daysi + β4 Agei +..ei. Step 2. From the regression model, save the parameter estimates (βs) Step 3. Plug in our data to estimate cost. Estimated cost = β1 LOSii + β2 DRGii + β3 ICU daysii + β4 Ageii.")
40
Combining Methods – No single method may fill all needs, even within a single study – Hybrid method may be the best • Direct method or pseudo-bill on utilization most affected by intervention • Cost regression or Medicare payment for other utilization

41
(8) Opportunities and Challenges
Health plans Hospitals Oppor-tunities - ↑↑ Adm. efficiencies related to contracting -↑ Predictability of expenditure - Ability to benchmark hospital performance and create incentives to award high-performing hospitals - Methods to control cost - Provide clinical and quality information supporting pay for performance - Clinically meaningful to focus on efficiency and effectiveness - Grouper software (for analysis) - Full responsibility for LOS and resources - Adm. savings / reduced costs in contract negotiations - Greater predictability of expenditures - ↑↑ case-mix management - More meaningful information to physicians in their care practices - Hospitals put on level playing field to recognize best in class
 - Full responsibility for LOS and resources. - Adm. savings / reduced costs in contract negotiations. - Greater predictability of expenditures. - ↑↑ case-mix management. - More meaningful information to physicians in their care practices. - Hospitals put on level playing field to recognize best in class.")
42
(8) Opportunities and Challenges (continued)
Health plans Hospitals Challenges - Cost containment initiatives → DRG implementation slow - IT systems changes required for groupers - Infrastructure changes required for: (i) focus activities from LOS Mx to Mx of admissions, transfers, readmissions (ii) training on DRG (iii) periodic review of coding - ↑existing groupers/find another to meet the needs - Determination of outliers payment ( if failure, eroding the value of DRG) - Financial risk (on how DRG implemented) - Additional costs to buy grouper software - Coordination/communication with physicians - Small or low-volume hospitals have fewer cases → risks
 focus activities from LOS Mx to Mx of admissions, transfers, readmissions. (ii) training on DRG. (iii) periodic review of coding. - ↑existing groupers/find another to meet the needs. - Determination of outliers payment. ( if failure, eroding the value of DRG) - Financial risk (on how DRG implemented) - Additional costs to buy grouper software. - Coordination/communication with physicians. - Small or low-volume hospitals have fewer cases → risks.")
43
(9) Countries Using DRG payment
- USA - Australia - Canada - Europe: UK, Germany, France, Demark, Finland, Italy, Austria, Belgium, Netherlands, Norway, Portugal, Spain, Sweden - Asia: Thailand, Taiwan, Indonesia, Singapore, Malaysia, China - Some OECD countries: Austria, Chile, Czech Republic, Estonia, Greece, Hungary, Iceland, Ireland, Israel, Japan, Korea, Luxembourg, Mexico, Poland, Slovakia Republic, Switzerland, Turkey

44
(10) DRG and Myanmar - Too far to introduce DRG payment system - To establish it, the followings should be considered: (a) Political will for health care reform and for change of financing policy (b) Enactments including health insurance (c) Establishment of strong HIS and data libraries (d) Human resources with international exposure and experiences on health economics (e) Capacity building (f) International inputs (g) DRG Supervisory Committee (h) DRG Auditing (i) Research and Development
 Political will for health care reform and for change of financing policy. (b) Enactments including health insurance. (c) Establishment of strong HIS and data libraries. (d) Human resources with international exposure and experiences on health economics. (e) Capacity building. (f) International inputs. (g) DRG Supervisory Committee. (h) DRG Auditing. (i) Research and Development.")
45
(11) References (i) Budi Hydayat (2011). Lecture notes on ‘Diagnosis Related Groups (DRGs): Overview, Costing Methods and Empirical Evidences. Training on Health Care Financing and Payment Systems: Ensuring Efficient Universal Coverage. Sept Bali, Indonesia. (ii) Clinical Research and Documentation Departments of 3M Health Information Systems (2003). All Patient Refined DRGs (APR-DRGs). Version Methodology Overview. Willingford, Connecticut and Murray, Utah. pp 85. (iii) Donald Pardede (2011). Lecture notes on ‘DRG/CBGs Payment by Jamkesmas: Experience and Challenges. Training on Health Care Financing and Payment Systems: Ensuring Efficient Universal Coverage. Sept, Bali, Indonesia. (iv) Diagnosis Related Groups (DRGs) and the Medicare Program: Implications for Medical Technology- A Technical Memorandum, Washington, DC: US Congress, Office of Technology Assessment, OTM-TM-H-17, July pp 82. (v) Integrated Health Care Association (2009). DRG-Based Payment Assessment. Navigant Consulting Inc. California, USA. pp 9. (vi) JC Langenbrunner, C Cashin and SO’Dougherty (2009). Designing and Implementing Health Care Provider Payment Systems: How-To Manual. The International Bank for Reconstruction and Development/The World Bank 1818 H Street NW Washington DC : pp 325. (vii) Ohio Hospital Association. Internet data downloaded on 1 Nov, (website: (viii) Office of Inspector General, Office of Evaluation and Inspection, Region IX (2001). Medicare Hospital Prospective Payment System: How DRG rates are Calculated and Updated. USA. pp 18. (ix) WHO (2009). Health Financing Strategy for the Asia Pacific Region ( ). pp 43. (x) DRG. Internet data downloaded on 6 Nov (website: ebookbrowse.com/ drg-ppt-d )
 Budi Hydayat (2011). Lecture notes on ‘Diagnosis Related Groups (DRGs): Overview, Costing Methods and Empirical Evidences. Training on Health Care Financing and Payment Systems: Ensuring Efficient Universal Coverage. Sept Bali, Indonesia. (ii) Clinical Research and Documentation Departments of 3M Health Information Systems (2003). All Patient Refined DRGs (APR-DRGs). Version Methodology Overview. Willingford, Connecticut and Murray, Utah. pp 85. (iii) Donald Pardede (2011). Lecture notes on ‘DRG/CBGs Payment by Jamkesmas: Experience and Challenges. Training on Health Care Financing and Payment Systems: Ensuring Efficient Universal Coverage. Sept, Bali, Indonesia. (iv) Diagnosis Related Groups (DRGs) and the Medicare Program: Implications for Medical Technology- A Technical Memorandum, Washington, DC: US Congress, Office of Technology Assessment, OTM-TM-H-17, July pp 82. (v) Integrated Health Care Association (2009). DRG-Based Payment Assessment. Navigant Consulting Inc. California, USA. pp 9. (vi) JC Langenbrunner, C Cashin and SO’Dougherty (2009). Designing and Implementing Health Care Provider Payment Systems: How-To Manual. The International Bank for Reconstruction and Development/The World Bank 1818 H Street NW Washington DC : pp 325. (vii) Ohio Hospital Association. Internet data downloaded on 1 Nov, (website: (viii) Office of Inspector General, Office of Evaluation and Inspection, Region IX (2001). Medicare Hospital Prospective Payment System: How DRG rates are Calculated and Updated. USA. pp 18. (ix) WHO (2009). Health Financing Strategy for the Asia Pacific Region ( ). pp 43. (x) DRG. Internet data downloaded on 6 Nov (website: ebookbrowse.com/ drg-ppt-d )")
46
THANK YOU VERY MUCH

Similar presentations


:117-125,>")


