Download presentation
Presentation is loading. Please wait.

1
News coverage of political campaigns
A review and evaluation

2
What should news coverage be like?
Informative “Objective” Fair and balanced Focused on what’s important Contextualized Accurate Adequate Useful

3
Has this always been the case?
No—early newspapers were partisan in the extreme Party papers were financially supported by politicians or their supporters

4
To what extent to do people use the media?
There has been a continuing and fairly precipitous decline in newspaper reading, tv news attendance, newsmagazine circulation. The only increase is in use of the Internet for political information, but that does not nearly offset the declines elsewhere

5
Everyday news consumption (Source: Gallup)
")
6
Source: Gallup

7
Source: Gallup

8
Source: Gallup

9
Source: Gallup

10
Source: Gallup

11
Everyday news consumption (Source: Gallup)
")
12
Everyday news consumption (Source: Gallup)
")
13
How do people get their campaign news?
Television news dominates Local TV is more heavily used that network TV

14
Source: Pew Research Center for the People and the Press, “Cable and Internet Loom Large in a Fragmented Political News Universe,’’ January 11, 2004 * Survey qu.: "For each item that I read, please tell me how often, if ever, you learn something about the presidential campaign or the candidates from this source." Chart shows percent of Americans who "regularly" learn something from given outlet.

15
What can we say about news coverage?
Although we will review political knowledge in more detail later, we can certainly say that Americans have very low levels of political knowledge and understanding It’s a running joke on the Tonight Show, etc. Can we trace this to lack of interest or is it tied to news media performance?

16
News media performance
The news media can be evaluated on a number of dimensions of campaign coverage, but the most common are: The amount of information provided The nature of the presentation Bias Sensationalism

17
What do we find in the news?
The agenda of the American news media continues to narrow, not broaden. A firm grip on this is difficult but the trends seem inescapable. A comprehensive audit of coverage shows that in 2007, two overriding stories — the war in Iraq and the 2008 presidential campaign — filled more than a quarter of the newshole and seemed to consume much of the media’s energy and resources. And what wasn’t covered was in many ways as notable as what was. Other than Iraq — and to a lesser degree Pakistan and Iran — there was minimal coverage of events overseas, some of which directly involved U.S. interests, blood and treasure. At the same time, consider the list of the domestic issues that each filled less than a single percent of the newshole: education, race, religion, transportation, the legal system, housing, drug trafficking, gun control, welfare, Social Security, aging, labor, abortion and more. A related trait is a tendency to move on from stories quickly. On breaking news events — the Virginia Tech massacre or the Minneapolis bridge collapse were among the biggest — the media flooded the zone but then quickly dropped underlying story lines about school safety and infrastructure. And newer media seem to have an even narrower peripheral vision than older media. Cable news, talk radio (and also blogs) tend to seize on top stories (often polarizing ones) and amplify them. The Internet offers the promise of aggregating ever more sources, but its value still depends on what those originating sources are providing. Even as the media world has fragmented into more outlets and options, reporting resources have shrunk. Source: Project for Excellence in Journalism “State of the News Media 2008”
 tend to seize on top stories (often polarizing ones) and amplify them. The Internet offers the promise of aggregating ever more sources, but its value still depends on what those originating sources are providing. Even as the media world has fragmented into more outlets and options, reporting resources have shrunk. Source: Project for Excellence in Journalism State of the News Media 2008")
18
Local news coverage, Oct
Local news coverage, Oct. 4-10, 2004 (Source: Lear Center Local News Archive)
")
19
Campaign coverage on local TV news
Average length of a campaign story 81 seconds Nearly two-thirds contained no candidate soundbites When they did speak, it averaged 12 seconds Strategy or horserace: 45% Campaign issues: 29% Local elections: 5%

20
MNI Average 30 Minute Broadcast Significant Variance by Market
UNIVERSITY OF WISCONSIN NEWSLAB MNI Average 30 Minute Broadcast Significant Variance by Market Category – Advertising 10 min 7 sec Sports and weather 7 min 1 sec Crime 2 min 27 sec Other 2 min 18 sec Local interest 2 min 1sec Teasers, bumpers, intros 1 min 46 sec Non-campaign gov’t news 1 min 6 sec Health 1 min 4 sec Business, economy 1 min 2 sec Election coverage 36 sec Foreign policy 23 sec Unintentional injury 11 sec

21
Broadcast-Level Analysis
UNIVERSITY OF WISCONSIN NEWSLAB Broadcast-Level Analysis The breakdown by office: Gubernatorial coverage consumed a third of the airtime (34 percent) devoted to election stories. More than one out of every ten stories (11 percent) was about U.S. House candidates, almost double the coverage of U.S. Senate candidates (6 percent). Voting issue stories comprised 8 percent of election coverage. Ballot initiatives and bond issues also received 5 percent of all election coverage.
 devoted to election stories. More than one out of every ten stories (11 percent) was about U.S. House candidates, almost double the coverage of U.S. Senate candidates (6 percent). Voting issue stories comprised 8 percent of election coverage. Ballot initiatives and bond issues also received 5 percent of all election coverage.")
22
Broadcast-Level Analysis
UNIVERSITY OF WISCONSIN NEWSLAB Broadcast-Level Analysis Strategy and horserace stories vastly outweighed substantive issue coverage by a margin of almost 3 to 1 (63 to 23 percent). Roughly one out of every twenty stories (6 percent) was about former Congressman Mark Foley. In the last week of the study (Foley resigned on September 29), 19 percent of all election stories were about Foley. Also, in the last week, 42 percent of stories about the House were about Foley.
. Roughly one out of every twenty stories (6 percent) was about former Congressman Mark Foley. In the last week of the study (Foley resigned on September 29), 19 percent of all election stories were about Foley. Also, in the last week, 42 percent of stories about the House were about Foley.")
23
Broadcast-Level Analysis
UNIVERSITY OF WISCONSIN NEWSLAB Broadcast-Level Analysis Only a little over one in four (30 percent) of stories contained a candidate sound bite. When candidates were allowed to speak, the average sound bite was just under 13 seconds. Local candidates averaged slightly longer sound bites (just over 18 seconds) US House candidates received roughly 12 seconds, gubernatorial candidates received 10 seconds, and US Senate candidates received 9 seconds on average
 of stories contained a. candidate sound bite. When candidates were allowed to speak, the. average sound bite was just under 13 seconds. Local candidates averaged slightly longer sound bites (just. over 18 seconds) US House candidates received roughly 12 seconds, gubernatorial. candidates received 10 seconds, and US Senate candidates. received 9 seconds on average.")
24
On Campaign Coverage on The Nightly News
THE HESS REPORT On Campaign Coverage on The Nightly News

25
Minutes Devoted to Campaign Coverage
Note : Based on 772 stories from August 31, 1992 to November 2, 1992; 483 stories from September 2, 1996 to November 4, 1996; 462 stories from September 4, 2000 to November 6, 2000 from the ABC, CBS, and NBC evening news. Data: Center For Media And Public Affairs/Brookings

26
Minutes Devoted to Campaign Coverage: ABC, CBS, NBC
Note : Based on 772 stories from August 31, 1992 to November 2, 1992; 483 stories from September 2, 1996 to November 4, 1996; 462 stories from September 4, 2000 to November 6, 2000 from the ABC, CBS, and NBC evening news. Data: Center For Media And Public Affairs/Brookings

27
THE SHRINKING SOUNDBITE
Note: Based on 589 stories from September 5, 1988 to November 7, 1988 ; 728 stories from September 7, 1992 to November 3, 1992; 483 stories from September 2, 1996 to November 4, 1996; 462 stories from September 4, 2000 to November 6, 2000 from the ABC, CBS, and NBC evening news. Data: Center For Media And Public Affairs/Brookings

28
Horse Race as Percent of Total Campaign Coverage
Note: Horse Race stories focus on who’s ahead, who’s behind, and candidate election strategies. Statistics on the percent of stories based on total number of election stories from that particular news organization. Based on 772 stories from August 31, 1992 to November 2, 1992; 483 stories from September 2, 1996 to November 4, 1996; 462 stories from September 4, 2000 to November 6, 2000 from the ABC, CBS, and NBC evening news. Data: Center For Media And Public Affairs/Brookings

29
Horse Race as Percent of Total Campaign Coverage: ABC, CBS, NBC
Note: Horse Race stories focus on who’s ahead, who’s behind, and candidate election strategies. Statistics on the percent of stories based on total number of election stories from that particular news organization. Based on 772 stories from August 31, 1992 to November 2, 1992; 483 stories from September 2, 1996 to November 4, 1996; 462 stories from September 4, 2000 to November 6, 2000 from the ABC, CBS, and NBC evening news. Data: Center For Media And Public Affairs/Brookings

30
Horse Race as Percent of Total Campaign Coverage
Note: Horse Race stories focus on who’s ahead, who’s behind, and candidate election strategies. Statistics on the percent of stories based on total number of election stories from that particular news organization. Based on 772 stories from August 31, 1992 to November 2, 1992; 483 stories from September 2, 1996 to November 4, 1996; 462 stories from September 4, 2000 to November 6, 2000 from the ABC, CBS, and NBC evening news. Data: Center For Media And Public Affairs/Brookings

31
Negative Tone Note: Statistics on the percent of positive and negative evaluations based on total number of evaluations in the stories. Explicitly negative and positive statements by non-partisan sources were considered when judging whether coverage was negative or positive Based on 772 stories from August 31, 1992 to November 2, 1992; 483 stories from September 2, 1996 to November 4, 1996; 462 stories from September 4, 2000 to November 6, 2000 from the ABC, CBS, and NBC evening news. Data: Center For Media And Public Affairs/Brookings

32
What does the public think of press performance?
The public’s view of the press has been in decline for many years See the press as biased See the press as having few morals See news as obsessed with sensational stories, fluff

33
Project for Excellence in Journalism

34
Trend in public attitudes toward the press (Source: Project for Excellence in Journalism)
")
35
Trend in public attitudes toward the press (Source: Project for Excellence in Journalism)
")
36
Trend in public attitudes toward the press (Source: Project for Excellence in Journalism)
")
37
Believability of news media
Percent of public rating medium highly believable, Source: Pew Research Center for the People and the Press, ’’News Media’s Improved Image Proves Short-Lived,’’ August 4, 2002 Survey question: "How would you rate the believability of (item) on [a] scale of 4 to 1?"
 on [a] scale of 4 to 1")
38
Public beliefs about the press
Source: Gallup poll of 1,025 Americans, September 2003

39
Trend in public attitudes toward the press (Source: Project for Excellence in Journalism)
")
40
Trend in public attitudes toward the press (Source: Project for Excellence in Journalism)
")
41
2007 % 1985 Katie Couric 5 Dan Rather 11 Bill O’Reilly 4 Walter Cronkite 6 Charles Gibson 3 Peter Jennings 2 Tom Brokaw Brian Williams Ted Koppel Anderson Cooper Other 33 Jon Stewart None/DK/Refuse 35 24 44

42
To what extent is this due to the beliefs of the critic?

43
Percent saying press criticism does more good than harm (Source: Project for Excellence in Journalism)
")
44
Perceived bias in campaign coverage
Source: Pew Research Center for the People & the Press, “Views of Press Values and Performance: ”

45
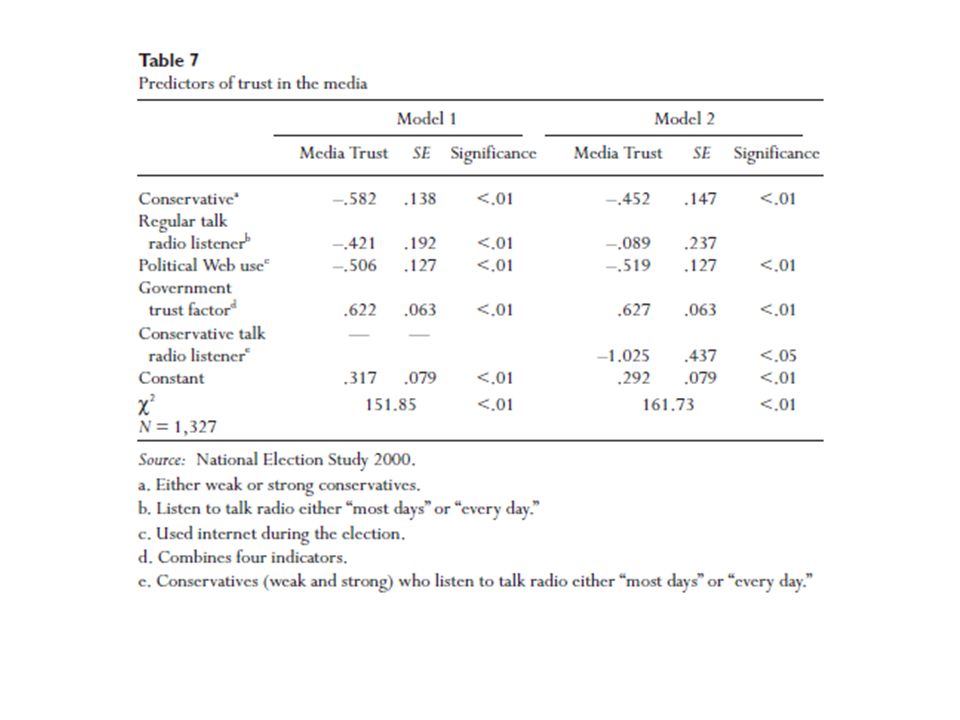
Source: David A. Jones, Why Americans Don’t Trust the Media, Press/Politics 9(7): 60-75
: 60-75")
49
Newsworthiness This is the term used by journalists and critics to describe characteristics of some topic or event that identify it as something that should be covered by the press or by a journalistic organization What are the features that make something newsworthy?

50
Newsworthiness features
Two types of values Importance Sensational value Importance relates to the impact the event or topic is likely to have on the audience Tax policy Sensational values relate to the oddity or emotional charge a story has Murder Accidents Sex Weirdness (“Lipstick on a pig”)
")
51
Why sensational values?
Simply put, journalists believe that the public is more likely to tune in to see sensational coverage than important stories They may be right

52
Audience preferences Sensationalism
People watch news in large numbers Small audiences for “serious journalism”, e.g. Newshour, opinion journals, editorial pages Screaming matches rather than debate Common focus on bizarre, conflictual, seamy, violent Look at popular culture Movies Television shows Success of more sensational news formats 60 Minutes

53
Source: Patterson, 2001

57
Horserace news is widely available for the simple reason that it attracts readers and viewers. Our evidence shows that substantial numbers of readers sought out the news reports on the horserace, even though these reports were located at the end of the CD. After taking into account the longitudinal trend in page visits, horserace stories attracted the most traffic within the CD, even more than “scandal” stories. Source: Consumer Demand for Election News: The Horserace Sells Iyengar, Norpoth, and Hahn, Journal of Politics, February 2004

59
"At the end of the day, I hope this is more about the fairness and accuracy of my reporting than about my hairstyle." -- Jennifer Eccleston

60
Can the two values work together?
The challenge, then, may be to combine the two values Emphasize sensational features of a story to draw attention while including important information that has value in the long run Does the audience better understand tax policy from the “Joe the Plumber” stories?

61
Bias The most common complaint against the news media is the charge of ideological bias It has become almost an automatic belief among conservatives Repeated regularly among radio talk hosts, pundits, party functionaries

62
He was known for attacking his opponents with unusual turns of phrase
He was known for attacking his opponents with unusual turns of phrase. Among his most famous were "nattering nabobs of negativism", and "effete corps of impudent snobs". Both expressions refer to the press corps, whom both Agnew and Nixon considered to be their ideological enemies and which ultimately played a role in Nixon's downfall. "pusillanimous pussyfoots" and "hopeless, hysterical hypochondriacs of history" Speech excerpt

64
Journalists’ self-designation
Source: Pew Center poll of print journalists

65
Print journalists’ views on bias
National Local It is a valid criticism that journalists are letting their ideological views show in their reporting too frequently 43% It is a valid criticism of the press that the distinction between reporting and commentary has seriously eroded 58% 57% Source: Pew Research Center poll of print journalists

66
Source: Lichter et al.

68
Audience preferences Right-wing populism “Patriotism”
Fox Limbaugh, etc. “Militarism of local news” (Gitlin and Hallin) Local news, especially, dropped all pretension of neutrality during Gulf War I Same appears true today
 Local news, especially, dropped all pretension of neutrality during Gulf War I. Same appears true today.")
71
Opposition: A smaller number of critics argues that the media lean right rather than left Robert Parry: “The notion of a ‘liberal’ national news media is one of the most enduring and influential political myths of modern U.S. history. Shaping the behavior of both conservatives and liberals over the past quarter century, the myth could be said to have altered the course of American democracy and led the nation into the dangerous corner it now finds itself.”

72
Survey of journalists Left 30% Right 19%
Q#22. On social issues, how would you characterize your political orientation? Q#23. On economic issues, how would you characterize your political orientation? Left 30% Left 11% Center 57% Center 64% Right 9% Right 19% Other 5%

73
Journalists and public on specific policies
Journalists appear to be left of public Journalists appear to be right of public Protecting Medicare and Social Security XX The expansion of NAFTA X Requiring employers to provide health insurance for workers Stricter environmental laws Concern over corporate power Taxing the wealthy Impact of NAFTA ‘Fast track’ trade authority Government guaranteed medical care

74
Punditry Modern journalism is heavily dependent upon sources of information Journalists often either simply quote or interview sources of information Sources are much more likely to be government officials than any other group Those who act as ‘pundits’ are significantly more likely to be conservative than liberal Think tanks, etc.

75
Number of think tank citations in media by ideology
2003 2002 Conservative or Center-Right 13,989 47% 12,249 47% Centrist 11,605 39% 10,599 41% Progressive or Center-Left 3,896 13% 3,217 12% Total 29,490 100% 26,055 100% Source: Nexis database on major newspaper and radio and TV transcripts.

76
Owners’ and managers’ attitudes
Rights of ownership Fire dissident employees Relatively rare Hire according to political tendencies Not common However, may be becoming more common “Fox phenomenon” Advancement according to acceptance of editorial policy

78
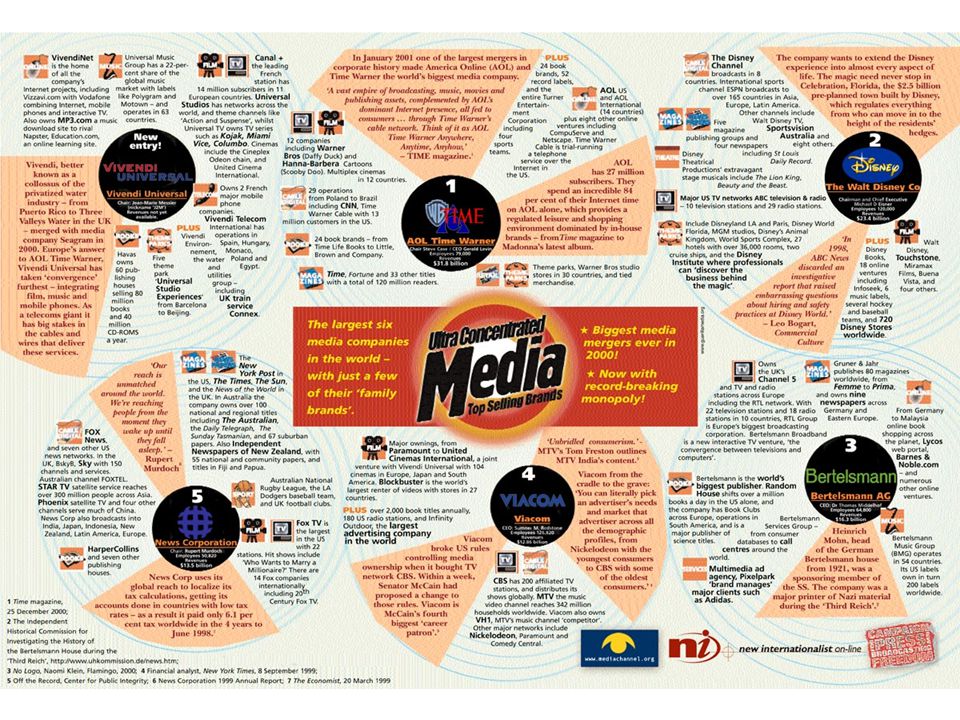
Consolidation Fewer and fewer large corporations own more and more of the media

81
Socialization of journalists
New journalists learn ‘editorial policy’ subtly through the working of the news system Editing of stories handed in Success of journalists who follow the rules Placement of stories Star reporters with perks Occasional ‘talking to’ by editors Coffee klatches Evaluation of elite press coverage Read own paper each day

82
The influence of professionalism
Journalists neither simply follow their personal political philosophy nor kowtow to their employer’s wishes Schools of journalism, etc. that help to inculcate values and expertise of the ‘profession’ Objectivity Accuracy Newsworthiness Storytelling skills

83
Objectivity as a press value
"Good reporters write balanced, rounded stories," says David Cay Johnston, a Pulitzer Prize winner now covering tax issues for The New York Times, who has lectured widely on journalism issues. "I have worked at five major newspapers and sat next to people who held political views that ranged from fascist to communist, and I would be hard pressed to find any sign of that in their work as reporters or editors. A better test than the liberal-vs.-conservative paradigm would be ideological-vs.-non-ideological, and rounded-vs.-not rounded. Source: Fairness and Accuracy in Reporting (FAIR)
")
90
Source: Survey of 101 reporters by Iyengar, McGrady and Woo reported in Nieman Reports, Fall 2005

91
Perhaps the most significant influence
Massive cutbacks at newspaper, TV news (local and network) and newsmagazines have significantly changed the approach to news Very little investigative news left Greatly increased dependence upon materials supplied by public relations specialists No cushion left for news to be insulated from economic pressures
 and newsmagazines have significantly changed the approach to news. Very little investigative news left. Greatly increased dependence upon materials supplied by public relations specialists. No cushion left for news to be insulated from economic pressures.")
92
Journalists in this survey are much less concerned than three years ago or eight years earlier about issues of quality and credibility. In earlier years the quality of the coverage was the chief concern among those surveyed. In 1999, 44% named issues of quality as the top problem facing journalism as did 41% in Now half as many, about two in ten, place these issues at the top. The same drop occurred among local journalists, falling from 33% in 2004 to 21% in 2007. Concerns about the lack of credibility declined even more, falling from 28% of national journalists and 23% of locals naming it as the top problem in 2004 to just 9% for both groups this year. Yet this does not mean that journalists are now satisfied. Less than 20% of journalists named the quality of coverage as something that journalism “is doing especially well these days.” But these concerns over quality may now be more concerned with resources than with the attitudes or professionalism of the journalist. Indeed, this concern is overwhelmingly shared. More than eight in ten journalists surveyed, a greater percentage than in 2004, agree that news organizations have cut back too much on the scope of their reporting and that too little attention is paid to complex issues. What seems to be happening instead is that other, more pressing issues have evolved — namely those of money and bottom-line pressures.

93
Ultimately: Journalists are personally liberal
Elite media more so than the rest They are not so clearly or unambiguously liberal as they are portrayed Majority are centrist Actually centrist or conservative on economic matters, liberal on social equality issues, government social action Trend has been toward a more conservative or libertarian position for journalists Definition of ‘liberal’ and ‘conservative’ have both drifted to the right ‘New news’ and non-fiction formats have been on the conservative side Editors and management are more conservative Professionalism and organizational influences run counter to a liberal news bias

94
Mostly: News is a product of a large number of influences, not just political views of the journalists themselves The greatest influence is probably the search for profit Definition of ‘liberal’ and ‘conservative’ are fluid and dependent upon the audience attitudes at least as much as the news performance

96
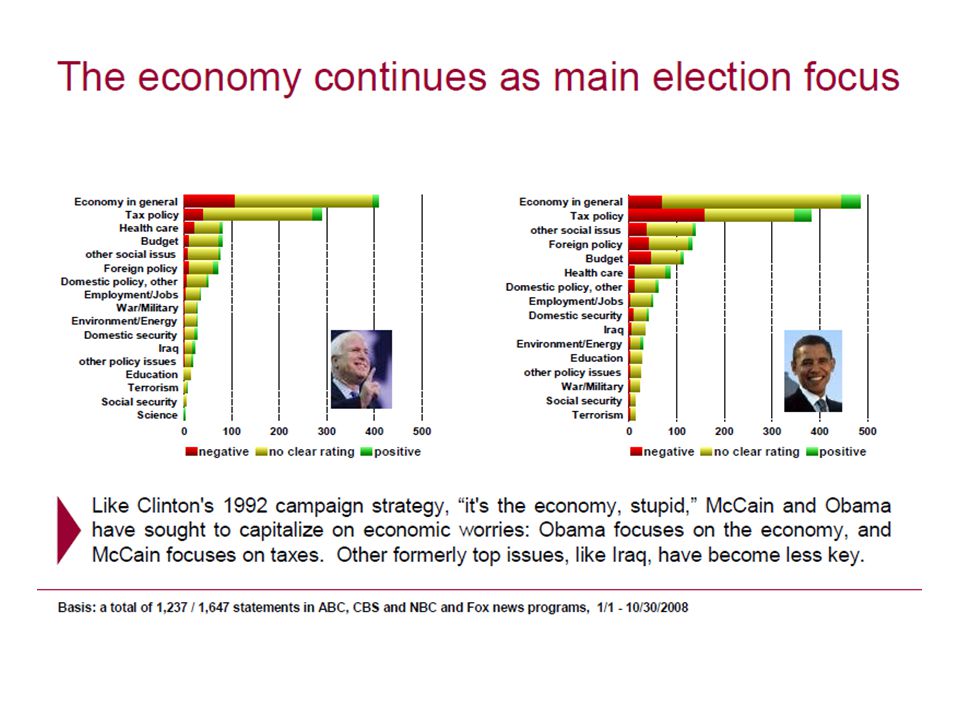
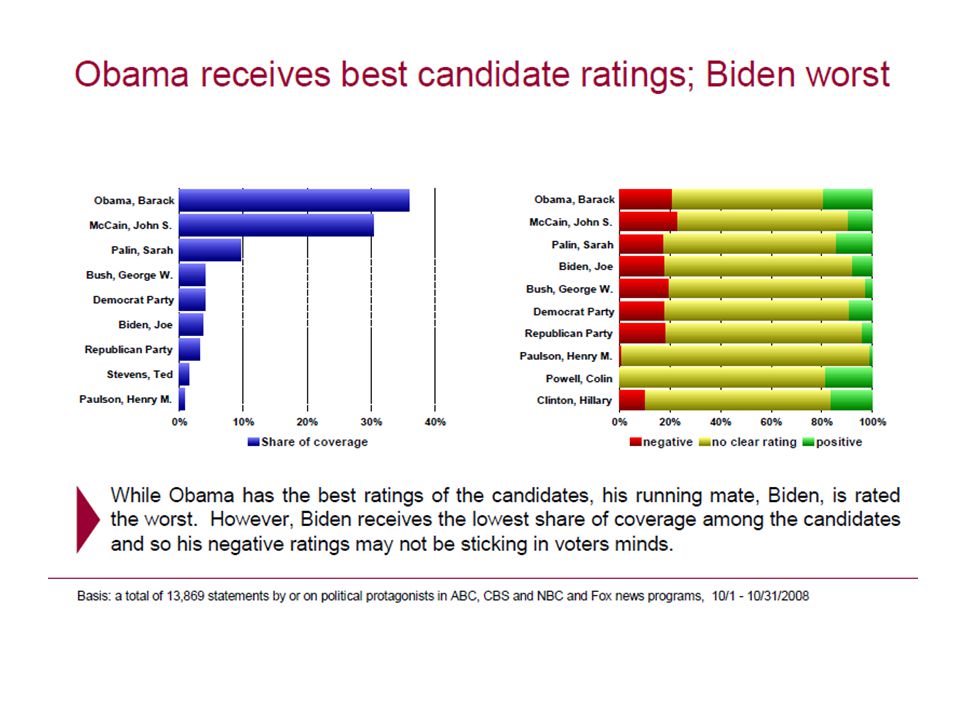
The 2008 Election

97
Source: Project for Excellence in Journalism, “Winning the media campaign:
How the press reported the 2008 presidential general election”

98
Source: Project for Excellence in Journalism

99
Source: Project for Excellence in Journalism, “Winning the media campaign:
How the press reported the 2008 presidential general election”

100
Source: Project for Excellence in Journalism

101
Source: Project for Excellence in Journalism

102
Source: Project for Excellence in Journalism, “Winning the media campaign:
How the press reported the 2008 presidential general election”

103
Source: Project for Excellence in Journalism, “Winning the media campaign: How the press reported the 2008 presidential general election”

104
Source: Project for Excellence in Journalism, “Winning the media campaign:
How the press reported the 2008 presidential general election”

105
Source: Project for Excellence in Journalism, “Winning the media campaign:
How the press reported the 2008 presidential general election”

106
Source: Project for Excellence in Journalism, “Winning the media campaign: How the press reported the 2008 presidential general election”

107
Source: Project for Excellence in Journalism, “Winning the media campaign:
How the press reported the 2008 presidential general election”

108
Source: Project for Excellence in Journalism, “Winning the media campaign:
How the press reported the 2008 presidential general election”

109
Source: Project for Excellence in Journalism, “Winning the media campaign:
How the press reported the 2008 presidential general election”

110
Source: Project for Excellence in Journalism, “Winning the media campaign:
How the press reported the 2008 presidential general election”

111
Source: Project for Excellence in Journalism, “Winning the media campaign:
How the press reported the 2008 presidential general election”

112
Source: Project for Excellence in Journalism, “Winning the media campaign:
How the press reported the 2008 presidential general election”

113
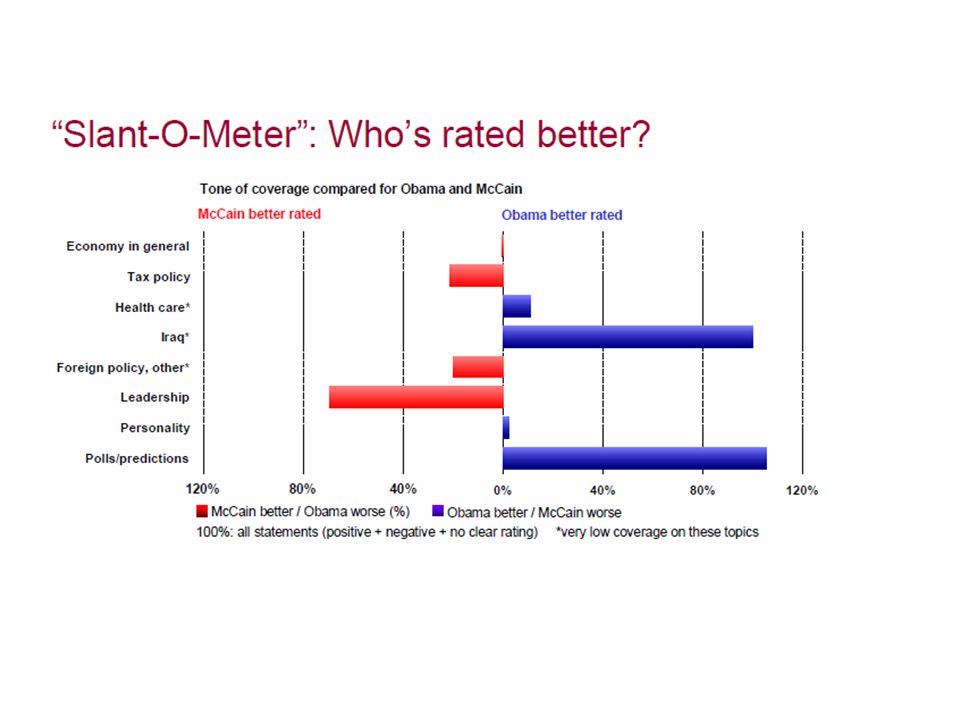
Source: MediaTenor

117
Source: Project for Excellence in Journalism, “Winning the media campaign:
How the press reported the 2008 presidential general election”

118
Source: Project for Excellence in Journalism, “Winning the media campaign:
How the press reported the 2008 presidential general election”

119
Source: Project for Excellence in Journalism, “Winning the media campaign:
How the press reported the 2008 presidential general election”

120
Source: Project for Excellence in Journalism, “Winning the media campaign:
How the press reported the 2008 presidential general election”

121
Source: Project for Excellence in Journalism, “Winning the media campaign:
How the press reported the 2008 presidential general election”

Similar presentations