Download presentation
Presentation is loading. Please wait.

1
Global Warming & Global Climate Change

3
How do we know about the temperature changes?
Past temperature changes were analyzed by: Radioisotopes in rocks & fossils (dating back 2.9 billion years) Pankton & radioisotopes in ocean sediments (dating back 20,000 – 180 million years) Pollen from lake bottoms, bogs, & volcanic ash (dating back 2 million years) Ice core samples from ancient glaciers (dating back 440,000 years) Tree rings (dating back 500 – 11,000 years) Radioisotopes in coral (dating back ,000 years) Historical records (dating back several hundred years) Actual temperature measurements (dating back 150 years)
 Pankton & radioisotopes in ocean sediments (dating back 20,000 – 180 million years) Pollen from lake bottoms, bogs, & volcanic ash (dating back 2 million. years) Ice core samples from ancient glaciers (dating back 440,000 years) Tree rings (dating back 500 – 11,000 years) Radioisotopes in coral (dating back ,000 years) Historical records (dating back several hundred years) Actual temperature measurements (dating back 150 years)")
4
What could have triggered the temperature changes?
Heinrich cycles – 61,000 years (massive discharge of icebergs from ice shelfs) Solar variability cycles – 2,200 years, 500 years, 200 years, 80 years, 22 years (dealing with the amount of solar radiation the Earth receives from the Sun) RCCI events – RCCI – Rapid Climatic Change Intervals where global cooling happens within several decades and lasts approximately 1,450 years Sunspot cycles – 11 years Milankovitch Cycles
 Solar variability cycles – 2,200 years, 500 years, 200. years, 80 years, 22 years (dealing with the amount of. solar radiation the Earth receives from the Sun) RCCI events – RCCI – Rapid Climatic Change Intervals. where global cooling happens within several decades. and lasts approximately 1,450 years. Sunspot cycles – 11 years. Milankovitch Cycles.")
5
Milankovitch Cycles Eccentricity – 100,000 years (where Earth’s orbit changes from more elliptical to circular) Obliquity – 40,000 years (where the tilt of the Earth’s axis changes) Precession – 19,000-23,000 years (where the wobble of the Earth’s axis along with the distance the Earth is from the Sun during the Equinoxes changes)
 Precession – 19,000-23,000 years (where the wobble of the Earth’s axis along with the distance the Earth is from the Sun during the Equinoxes changes)")
6
Milankovitch Cycles, Solar Variations, and Global Temperature over 1 million years

7
Ice Cores – from Greenland & Antarctica

8
What data can be extracted from Ice Cores?
Radioactive dust from Chernobyl, major dust storms or volcanic eruptions help to fix the correct time periods of glacier snow deposits. Glacier snow deposits have the same look as tree rings – their lines can be counted to determine the correct year of the deposit. This is because the snow that falls in summer produces larger and more acidic crystals than in winter time. The amount of methane – whether the methane contains a larger percentage of the isotope 14C than 12C lets scientists know that the methane came from wetlands instead of methane hydrates from the sea or from permafrost. Wetland produced methane contains more 14C. The ratio of isotopes 18O to 16O can help to determine the temperature of the time period. There is a higher amount of 18O during times of higher temperatures. The amount of sodium and calcium ions increase during colder temperatures due to greater storminess of the seas thus transporting more sea salt in the atmosphere. Increased amounts of sulfate particles (SO42-) decreased temperature due to global dimming. Older bands with high amounts of sulfates were from volcanic eruptions whereas the slight cooling effect in the 1940s and 1970s was from sulfate emissions from fossil fuel burning. This is known because there were no volcanic eruptions prior to those events so it had to come from anthropogenic sources.
 decreased temperature due to global dimming. Older bands with high amounts of sulfates were from volcanic eruptions whereas the slight cooling effect in the 1940s and 1970s was from sulfate emissions from fossil fuel burning. This is known because there were no volcanic eruptions prior to those events so it had to come from anthropogenic sources.")
9
What data can be extracted from Ice Cores? (cont.)
The amount of snowfall also decreases with decreasing temperature so the narrower the band for the year the colder the temperature. From more current records of snow fall (within the last 150 years), amount of compression from overlying layers, etc the temperature of the band can be determined mathematically. The higher presence of ammonium ions (NH4+) correlates to increased biomass. Increased biomass is due to increased photosynthesis and greater amounts of vegetation, etc. This then means that the temperature during that particular band in the ice core is from a warmer period. When the temperature gets colder there is less vegetation to hold the soil in place and so there are more dust particles found in the bands. Actual particles are a better indicator of temperature, etc. of the bands in ice cores than gases trapped in air bubbles. This is because the particles are transported and deposited during that year. The air bubbles are actually an accumulation that could be from up to 1,000 years and so can’t quite pinpoint the temperature for a given year.
, amount of compression from overlying layers, etc the temperature of the band can be determined mathematically. The higher presence of ammonium ions (NH4+) correlates to increased biomass. Increased biomass is due to increased photosynthesis and greater amounts of vegetation, etc. This then means that the temperature during that particular band in the ice core is from a warmer period. When the temperature gets colder there is less vegetation to hold the soil in place and so there are more dust particles found in the bands. Actual particles are a better indicator of temperature, etc. of the bands in ice cores than gases trapped in air bubbles. This is because the particles are transported and deposited during that year. The air bubbles are actually an accumulation that could be from up to 1,000 years and so can’t quite pinpoint the temperature for a given year.")
10
Correlation between CO2 concentration
and global temperature change oC

11
The Natural Greenhouse Effect uses water and carbon dioxide molecules to trap infrared radiation , re-emitting it as heat, to warm the earth’s atmosphere. In Global Warming additional anthropogenic (man-made) sources of carbon dioxide, methane, nitrous oxide, halons, and CFCs also trap infrared radiation to warm the atmosphere even further.
 sources of carbon dioxide, methane, nitrous oxide, halons, and CFCs also trap infrared radiation to warm the atmosphere even further.")
12
Anthropogenic Greenhouse Gases and their Relative Warming Potential
The Relative Warming Potential is based on one molecule of the greenhouse gas compared to the warming potential effect of one molecule of carbon dioxide. Although some greenhouse gases have MUCH higher relative warming potential than carbon dioxide does their concentrations in the atmosphere are a lot less. Greenhouse Gas Anthropogenic Source Avg Time in Troposphere Relative Warming Potential CO Fossil fuel burning yrs 1 x CH Rice paddies, Landfills yrs x N2O Inorganic fertilizers yrs x CFC’s Air conditioners, refrigerator yrs – 8300 x HCFC’s Replaced CFC sources yrs – 2,000 x HFC’s Replaced CFC sources yrs – 12,700 x Halons Fire Extinguishers yrs ,500 x CCl Cleaning solvents yrs ,400 x

13
The Atmospheric Window
Since H2O vapor and CO2 are natural greenhouse gases they absorb infrared radiation and reradiate it to the atmosphere as heat. However, there is a small section of the infrared spectrum (the ‘atmospheric window’) that is not ‘trapped’ by the natural greenhouse gases and so escapes the atmosphere. Since the creation and use of CFCs as refrigerants, blowing agents, etc. these anthropogenic greenhouse gases absorb infrared radiation in the atmospheric window and further increase the greenhouse effect – leading to increased global warming. CFCs were no longer manufactured in 1996 – not due to their global warming potential but because of their role in stratospheric ozone depletion.
 that is not ‘trapped’ by the natural greenhouse gases and so escapes the atmosphere. Since the creation and use of CFCs as refrigerants, blowing agents, etc. these anthropogenic greenhouse gases absorb infrared radiation in the atmospheric window and further increase the greenhouse effect – leading to increased global warming. CFCs were no longer manufactured in 1996 – not due to their global warming potential but because of their role in stratospheric ozone depletion.")
14
Anthropogenic Sources of CO2 and Global Temperature Change
Over geologic time the Earth has undergone many periods of glaciation and interglaciation. The temperature change oC between the two has only been approximately 5 oC. Within the last 150 years the average global temperature has risen 0.6 oC. Although this might be part of an interglaciation there is significant evidence that man has played a big part in increasing the temperature faster than might have otherwise have happened.

16
Evidence of Global Climate Change
Increased temperatures and melting of some glaciers in Greenland An average global sea level rise of cm (4-8 in) over the past 100 years An increased CO2 concentration greater than the past 420,000 years The 20th century was the hottest century in the past 1,000 years Northward migration of some fish, tree and other species (34 butterfly species have migrated miles further north Earlier spring arrivals and later autumn frosts in many parts of the world A decrease in frozen permafrost days (215 days down to 112 days)
 over the. past 100 years. An increased CO2 concentration greater than the past 420,000. years. The 20th century was the hottest century in the past 1,000 years. Northward migration of some fish, tree and other species (34. butterfly species have migrated miles further north. Earlier spring arrivals and later autumn frosts in many parts of. the world. A decrease in frozen permafrost days (215 days down to 112. days)")
17
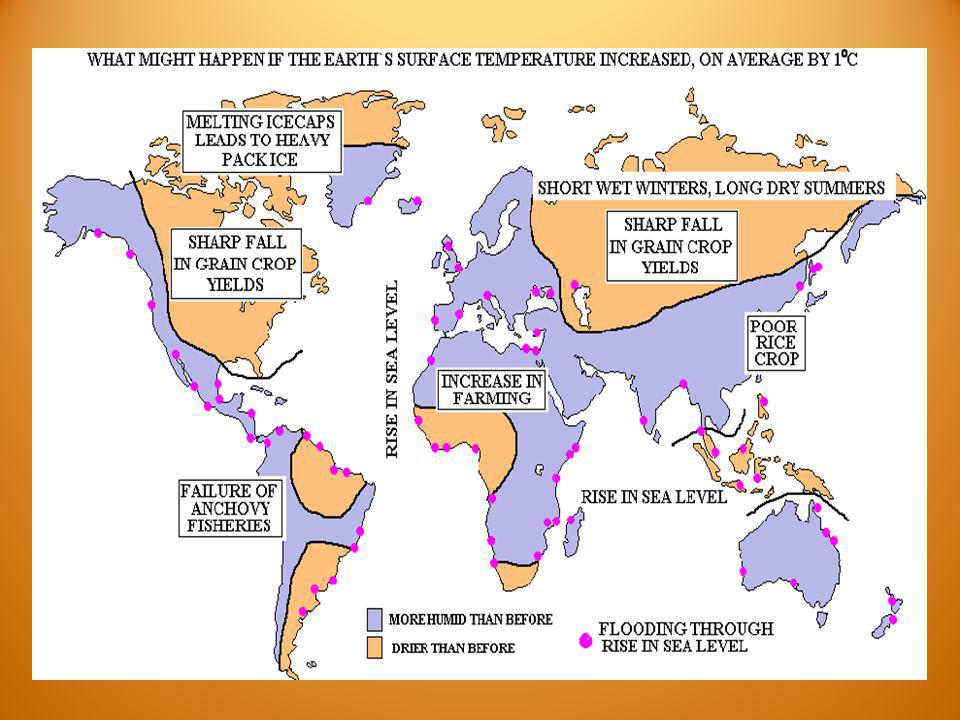
Possible Effects of Global Climate Change
Increase/decrease of precipitation in areas that receive adequate precipitation, leading to flooding or desertification Change of growing seasons – beneficial for those needing a longer growing season, detrimental for those whose cycles depend upon other growing cycles getting them off-cycle Increased growth of plants (C3 type – sedges, trees, 95% of all plants ) due to increased CO2 Decrease growth of plants (C4 type – corn, sugarcane, orchids, pineapples, cacti – adapted to tropical climates ) Increased severity of storms, drought, floods Sea level rise from melting glaciers and thermal expansion of water – displacing many of the world’s populations who inhabit coastal areas Increase of vector borne diseases (malaria, etc) from ticks, mosquitoes with increased temperature Change in growth of fish/ shellfish and migration patterns due to increased temperature Disruption of ocean currents – changing surface climates and loss of nutrient cycling from deep ocean currents Acidification of Oceans leading to corrosion of coral reefs
 due to. increased CO2. Decrease growth of plants (C4 type – corn, sugarcane, orchids, pineapples, cacti – adapted to tropical climates ) Increased severity of storms, drought, floods. Sea level rise from melting glaciers and thermal expansion of water – displacing many of the world’s populations who inhabit coastal areas. Increase of vector borne diseases (malaria, etc) from ticks, mosquitoes with. increased temperature. Change in growth of fish/ shellfish and migration patterns due to increased. temperature. Disruption of ocean currents – changing surface climates and loss of nutrient. cycling from deep ocean currents. Acidification of Oceans leading to corrosion of coral reefs.")
21
Temperature increases tend to be greater at and near the Earth’s poles than at the middle latitudes.
The Earth’s mean surface temperature will increase oC (2.5 –10.4 oF) within the next 100 years.
 within the next 100 years.")
22
While many countries of the world have attempted to unit their efforts to reduce CO2 emissions, first with the Kyoto Protocol in (where the US did NOT ratify it), and recently with the Copenhagen Agreement of 2009 (which the US did ratify it) it is still mostly left up to individual countries and the individuals, cities, states, and companies to find ways to significantly reduce the amount of CO2 that is discharged into the atmosphere.
, and recently with the Copenhagen Agreement of 2009 (which the US did ratify it) it is still mostly left up to individual countries and the individuals, cities, states, and companies to find ways to significantly reduce the amount of CO2 that is discharged into the atmosphere.")
23
Ways to remove and store CO2 to slow global warming
Plant immature but fast growing trees. (This would take a massive effort – the size of Australia to have an effect) Deep underground reservoirs Deep underwater ocean disposal Plants that naturally absorb CO2 and deposit it in soil like switchgrass and also practicing no-till agriculture
 Deep underground reservoirs. Deep underwater ocean disposal. Plants that naturally absorb CO2. and deposit it in soil like. switchgrass and also practicing. no-till agriculture.")
24
Ways to reduce the threat of climate change from anthropogenic sources
Improve energy efficiency and/or use less energy at home, in industry, in government Switchto alternative energy sources that do not emit CO2 (wind, water, solar) Switch to organic farming and sustainable agriculture that does not use inorganic fertilizers Phasing in output-based carbon taxes on each unit of CO2 emitted by fossil fuels Input-based energy taxes on each unit of fossil fuels used Implementing tax credits for uses of alternative energy Taxes linked to consumer use of energy Increase government subsidies for energy-efficiency and renewable-energy technologies and sustainable agriculture Funding the transfer of energy-efficiency and renewable-energy technologies from the developed countries to the developing countries – otherwise they will vastly increase the amount of greenhouse gases that will be emitted! Buying cars that are more fuel efficient/ use alternative fuels Use of mass transit instead of personal automobiles
 Switch to organic farming and sustainable agriculture that does not use. inorganic fertilizers. Phasing in output-based carbon taxes on each unit of CO2 emitted by fossil fuels. Input-based energy taxes on each unit of fossil fuels used. Implementing tax credits for uses of alternative energy. Taxes linked to consumer use of energy. Increase government subsidies for energy-efficiency and renewable-energy. technologies and sustainable agriculture. Funding the transfer of energy-efficiency and renewable-energy technologies. from the developed countries to the developing countries – otherwise they will. vastly increase the amount of greenhouse gases that will be emitted! Buying cars that are more fuel efficient/ use alternative fuels. Use of mass transit instead of personal automobiles.")
Similar presentations


 –Usually described in terms of average temperatures, precipitation,>")


 were naturally found in the environment before the industrial revolution.>")
