Download presentation
Presentation is loading. Please wait.

1
Electrical Engineering Department
Graduation Project II Electrical Engineering Department AGC of UAE Power System Advisor: Professor. Abdullah Ismail Done by: Awad Saleh Abdulla Al.Harthi Muhammed Usame Suzen Aadel Ahmed Al.Mehrezi

2
Outline Introduction to the Project. Automatic Generation Control.
Introduction to Power Generation Control. Introduction to AGC. Safety Ethics and Environmental Affects. Load Frequency Control. LFC model for single power system area. LFC model for two interconnected power system areas. LFC model for three interconnected power system areas. Automatic Voltage Regulator. Cost Estimation. Conclusion.

3
Project Purpose To perform measurement, modeling, analysis, and control design of voltage and frequency of UAE power systems.

4
Project Objectives Measurement and modeling of UAE power systems voltage and frequency variations. Computer modeling and analysis of the AGC including AVR and LFC functions. Design controllers for UAE power system voltage and frequency variations.

5
Project Status GPI: GPII:
LFC Model of Multi-Areas Interconnected Power System. Study the frequency behavior of each power system area. Study the power exchange between the interconnected power system areas. GPII: Design the PID controller. Automatic Voltage Regulation(AVR) of multi-areas interconnected power system.
 of multi-areas interconnected power system.")
6
Safety Ethics The safety of employees, contractors, visitors and the general public shall be the prime consideration. Continuity of supply. Security of apparatus or plant.

7
Environmental Effects
Each such system has advantages and disadvantages, but many of them pose environmental concerns. The efficiency of some of these systems can be improved by cogeneration (combined heat and power) methods.
 methods.")
8
AGC

9
Introduction to the power generation system
It is a system where the power is being generated transmitted, and distributed from the main power station through substations, to different areas using overhead or underground power lines.

10
Power Generation Station Components
Governor (Actuator). Turbine. Generator.
. Turbine. Generator.")
11
Governor A valve that controls the amount of fuel or steam running into the system. Tg: governor time constant. Kg: governor constant. ∆Pg: power generated from the governor. ∆Pc: Speed Changer. 1/R: Speed or droop Regulator.

12
Turbine A mechanical system which converts thermal energy provided by the governor to mechanical energy. Tt: Turbine time constant. Kt: Turbine constant. ∆Pg: energy input power. ∆Pt: output mechanical power.

13
Generator The generator produces electrical energy with certain voltage and frequency. Kp: Gain constant. Tp: Generator time constant. ∆Pd: load disturbance. ∆f: frequency change. ∆Pt: Power coming from the turbine.

14
WHAT DOES AGC MEAN? AGC: Automatic Generation Control.
Process that controls the limits of the frequency and voltage variations. Power system stability can be achieved by controlling the frequency and the voltage regulation.

15
Purpose of AGC To maintain power balance in the system.
Make sure that operating limits are not exceeded:- Generators limit Tie-lines limit Make sure that system frequency is constant (not change by load) [ 50 HZ in UAE]. To maintain each unit's generation at the most economic value.
 [ 50 HZ in UAE]. To maintain each unit s generation at the most economic value.")
16
AGC Advantages Power reliability. Safety.
Minimizing the cost with getting a good efficiency with a least losses.

17
AGC Parts and Connections with the Power Generation

18
Load Frequency Control

19
Load Frequency Control
Mechanical power is produced by a turbine and delivered to a synchronous generator serving different users. The frequency of the current and voltage waveforms at the output of the generator is mainly determined by the turbine steam flow. LFC is to control the real power ‘P’(MW).
.")
20
Load Frequency Control modeling methods
State Variable: It is an element of the set of variables that describe the state of dynamic systems. system state vector rate of change of state of the system the input to the system the output

21
LFC Simulation LFC system was simulated in two scenarios:
The first scenario is when the power plant doesn’t have any control system: Single power system area. Two interconnected power system areas. Three interconnected power system areas. In second scenario we applied PID controller to the plant: Models used in this problem: Model one which is a simple standard textbook model Model two which is a practical system from Um Al-Nar power station in Abu-Dhabi, UAE.

22
Model One

23
Model Two

24
PID Controller

25
Parallel PID Controller Parameters Effects

26
Simulation

27
Single Power System Area

28
Block Diagram of Model 1

29
Results of the Frequency
∆Frequency (Hz) Time (Second) As seen above in the figure the frequency response has two main problems; under-shoot, and steady-state error. These problems have been solved after we applied the suitable PID controller to the system.
 Time (Second) As seen above in the figure the frequency response has two main problems; under-shoot, and steady-state error. These problems have been solved after we applied the suitable PID controller to the system.")
30
PID Controller Design The design of the controller was based on the test and error methods where we did some iterations until we came up with the best design as shown in the figure down:

31
Model one Frequency Response
Frequency (Hz) Without PID Time (Second) Frequency (Hz) With PID Time (Second)
 Without PID. Time (Second) Frequency (Hz) With PID. Time (Second)")
32
Two Interconnected Power System Areas (M1/M1)
")
33
Input/output Configuration
System Outputs Inputs 2 Area Power System Δf1 ΔPd1 Δf2 ΔPd2 ΔPt12

34
Without PID With PID

35
Frequency Response

36
Frequency (Hz) Time (Second) Frequency (Hz) Time (Second)
Without PID Time (Second) Frequency (Hz) With PID Time (Second)
 Frequency (Hz) With PID. Time (Second)")
37
Transmission line response

38
Power (kW) Time (Second) Power (kW) Time (Second)
Without PID Time (Second) With PID Power (kW) Time (Second)
 With PID. Power (kW) Time (Second)")
39
Two Interconnected Power System Areas (M1/M2)
")
41
Frequency Response

42
Frequency (Hz) Time (Second) Frequency (Hz) Time (Second)
Without PID Time (Second) Frequency (Hz) With PID Time (Second)
 Frequency (Hz) With PID. Time (Second)")
43
Transmission line response

44
Power (kW) Time (Second) Power (kW) Time (Second)
Without PID Time (Second) Power (kW) With PID Time (Second)
 Power (kW) With PID. Time (Second)")
45
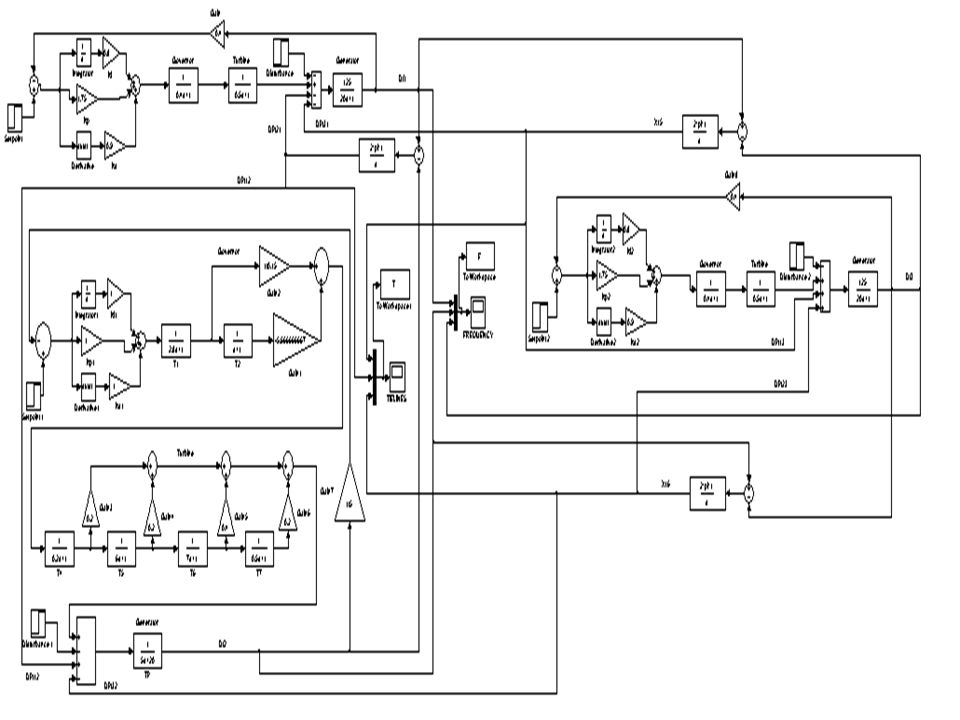
Three Interconnected Power System Areas (M1/M1)
")
46
Power Plant Configuration
M1 M1 Area3 Area1 ∆Pt31 ∆Pt12 ∆Pt23 M1 Area2

48
Frequency Response

49
Frequency (Hz) Time (Second) Frequency (Hz) Time (Second)
 Time (Second) Frequency (Hz) Time (Second)")
50
Transmission line response

51
Power (kW) Time (Second) Power (kW) Time (Second)
Without PID Time (Second) With PID Power (kW) Time (Second)
 With PID. Power (kW) Time (Second)")
52
Three Interconnected Power System Areas (M1/M2)
")
54
Frequency Response

55
Frequency (Hz) Time (Second) Frequency (Hz) Time (Second)
Without PID Time (Second) Frequency (Hz) With PID Time (Second)
 Frequency (Hz) With PID. Time (Second)")
56
Transmission line response

57
Power (kW) Time (Second) Power (kW) Time (Second)
Without PID Time (Second) With PID Power (kW) Time (Second)
 With PID. Power (kW) Time (Second)")
58
AVR (Automatic Voltage Regulator)
")
59
Introduction to AVR Reactive Power (Q) is one of the two main elements in the power system must be controlled. This reactive power is closely related to the system voltage Any voltage error in the system is sensed, measured, and transformed into reactive-power command signal. The objective of the AVR is to keep the system terminal voltage at the desired value by means of feedback control

60
Generation System and AVR
The block diagram above shows where the AVR is placed in the entire generation system.

61
AVR Simple Model KE=200 TE =0.05 KG=1 TG =0.2 KR= TR =0.05

62
AVR Simple Model with PID
Amplifier Exciter Generator Sensor

63
AVR Simulation

64
Without PID With PID

65
AVR Result Analysis: The AVR system has only one main problem when it works without any control system that: - Under-shoot. To get rid of this problem, the parallel PID controller is the best choice. The design of the PID controller was done based on the test and error method. The suitable PID controller parameter are as shown in the previous slide.

66
Voltage Response

67
Delta V (voltage change)
Without PID Delta V (voltage change) Time (Sec.) With PID Delta V (voltage change) Time (Sec.)
 Time (Sec.) With PID. Delta V (voltage change) Time (Sec.)")
68
Cost Estimation PID controller costs around 272$/generation station.
For instance, if we have 100 generation station in Abu-Dhabi: Total cost = (PID price) * (No. of generation stations) = 272($/G.S.) * 100 (G.S.) = 27200$
 * (No. of generation stations) = 272($/G.S.) * 100 (G.S.) = 27200$")
69
Conclusion AGC is a major control function within a utility’s energy control center, whose purpose is the tracking of load variations while maintaining system frequency, net tie-line interchanges, and optimal generation level close to scheduled values. Control of power systems becomes more difficult as the load increases during the time so, to solve this problem it’s recommended to design a system that controls the frequency variations using Proportional-Integral (PI) control, Robust control and Fuzzy control.
 control, Robust control and Fuzzy control.")
70
The Load Frequency Control is known as a continuous regulation of electric power systems frequency required to constantly balance the energy demanded by consumers. Changes in demand and/or supply can be observed by measuring the system's frequency. Its desired value is 50 Hz and any changes and increased demand will result in a frequency below 50 Hz and decreased demand in a frequency above 50 Hz. The LFC working in the system according to the power system load that continually undergoing change as individual loads fluctuate.

71
AGC system is affected by LFC more than AVR so if LFC system is not stable the AGC will be not stable as well. While if AVR system is not stable that doesn’t mean AGC will not be stable but it will depend on the whole system stability.

72
Abbreviations: AGC: Automatic Generation Control.
LFC: Load Frequency Control. AVR: Automatic Voltage Regulator. G.S.: Generation Station.

73
Thanks for listening. Any Questions ??

Similar presentations


>")


. HW 5 is 2.38, 6.9, 6.18, 6.30, 6.34, 6.38; do by October 6 but does not need.>")


