Download presentation
Presentation is loading. Please wait.

1
Mentor: Dr. Kathryn Chaloner Iowa Summer Institute in Biostatistics
Evaluating an Adaptive Clinical Trial with Quantitative Endpoints, Sample Size Re-estimation, Sequential Monitoring for Efficacy, and Monitoring for Futility By: Harrison Reeder Mentor: Dr. Kathryn Chaloner Iowa Summer Institute in Biostatistics

2
Outline What exactly does that title mean?
Basic Clinical Trial design Interim Monitoring for Efficacy 3 schemes for interim monitoring for efficacy Interim monitoring for futility Adaptive sample size re-estimation Simulation Study of Design Performance Conclusion KP The title describes a novel clinical trial design with several key features, so I will describe those, and present the results of the study we performed to test their utility. We will end by concluding whether this design is an improvement over a simpler traditional design.

3
Clinical Trial Design: The Basic Case
The most basic element of clinical trial design is determining an adequate sample size Calculating sample size requires specifying: approximate variance of outcomes the desired Type I error rate minimum clinically meaningful treatment effect desired power to detect that effect Code in R: power.t.test() Kamrine Elisa Poels Type I error: rejecting null when null is true (finding an effect when there is no effect) Power: probability of rejecting null given some alternative is true Taken from Introduction to Randomized Controlled Clinical Trials by John Matthews
 Kamrine Elisa Poels. Type I error: rejecting null when null is true (finding an effect when there is no effect) Power: probability of rejecting null given some alternative is true. Taken from Introduction to Randomized Controlled Clinical Trials by John Matthews.")
4
Motivating Clinical Trial Example
Treatment of insomnia in children with autism Phase II Clinical Trial Only previous study was small and on adult subjects In general, poor understanding of responses motivates need for adaptive trial Better performance with incorrect estimates?

5
Interim Monitoring for Efficacy
Why use interim monitoring? Complications of interim monitoring Interim monitoring inflates Type I error Solution: Change boundary of significance KP Taken from Introduction to Randomized Controlled Clinical Trials by John Matthews

6
Schemes for Interim Efficacy Monitoring
Pocock "constant" boundaries sets constant p-value boundary to use at every monitoring point Earlier rejection is easier, but final test is stringent O'Brien-Fleming boundaries makes rejection harder at earlier points and easier as trial progresses Fleming-Harrington-O'Brien boundaries middle-ground between above strategies KP Boundary First Interim Second Interim Third Interim Final point Pocock 0.0182 O-F 0.0039 0.0184 0.0412 F-H-O 0.0067 0.0083 0.0103 0.0403

7
Interim Monitoring for Futility
Why monitor for futility? Conditional power Estimates probability of having significant results given observed data and (design) assumptions If probability is lower than a specified threshold, then trial is stopped KP
 assumptions. If probability is lower than a specified threshold, then trial is stopped. KP.")
8
Adaptive Sample Size Recalculation
Early estimate of response variance is difficult To account for difference between estimate and true value, this design uses observed estimated variance halfway into trial to re-estimate sample size Investigators can set a maximum sample size for each group Harrison Thomas Reeder In earlier phase trials or trials of novel interventions, it may be difficult for investigators to make precise estimates of treatment effect or variance, which are key components to estimating sample size. For this reason, some "adaptive" designs reestimate the sample size needed for the trial partway through using observed variance from early responses. If, for example we had a trial that estimated 35 patients per group, we may reestimate after the first 18 patients in each group and get a new estimated sample size.

9
Research Question: How does our design perform?
Using simulation, we compare the design to designs without the features described We also compare the merits of the three interim monitoring schemes Values of interest: Bias of final treatment effect estimate True confidence of nominal 95% Confidence Interval True Type I error True power Distribution of stopping points HR So how does our design with all of these features compare to simpler designs? To find out we evaluate the performance of designs with various combinations of these features using a simulation study. In these simulations we also tested all three interim monitoring schemes (Pocock OF and FHO), and compared performance of the designs when investigator assumptions were accurate or inaccurate. We evaluated the designs based on these criteria listed.
, and compared performance of the designs when investigator assumptions were accurate or inaccurate. We evaluated the designs based on these criteria listed.")
10
Designing the Simulation
First Interim Sample Size is 9 Check for efficacy Second Interim Sample Size is 18 Check for futility Final sample size is recalculated Third Interim Sample size is 𝐹𝑖𝑛𝑎𝑙 if recalculated Without sample size recalculation, size is 28 Final Point Sample size is Final ≤ 50 if recalculated Without sample size recalculation, size is 35 Motivating Study: Effect of Sleeping Drug in Adolescents and Young Adults with Autism Spectrum Disorder Design assumptions: Mean treatment effect: 32 Response standard deviation: 36 HR For our simulation, then, we used a monitoring design similar to the one proposed for the motivating study. We had four interim monitoring periods, at sample size of 9, 18, 28 and 35 per group, or if reestimation then the last two were set in that process. Simulation seed: 42 Conditional power seed: 123

11
Comparison of Boundary Types
Pocock Highest Type I error Highest bias Lowest power Smallest sample size (i.e., best chance of finding efficacy early) O'Brien-Fleming and Fleming-Harrington-O'Brien Similar results across measures and assumptions O'Brien-Fleming boundary is more commonly used HR But first, to simplify, we will draw a simple conclusion concerning the three boundary types we simulated. We found that the Pocock constant value boundary had many features that did not suit our application, including highest type I error, highest estimate bias, and lowest power. It does offer the best chance of stopping for efficacy early, but the power diminishes as the trial continues. The other two efficacy boundaries, by contrast, performed similarly, and because the O-F boundary is somewhat more common, we opt to use that boundary for our final comparison.
 O Brien-Fleming and Fleming-Harrington-O Brien. Similar results across measures and assumptions. O Brien-Fleming boundary is more commonly used. HR. But first, to simplify, we will draw a simple conclusion concerning the three boundary types we simulated. We found that the Pocock constant value boundary had many features that did not suit our application, including highest type I error, highest estimate bias, and lowest power. It does offer the best chance of stopping for efficacy early, but the power diminishes as the trial continues. The other two efficacy boundaries, by contrast, performed similarly, and because the O-F boundary is somewhat more common, we opt to use that boundary for our final comparison.")
12
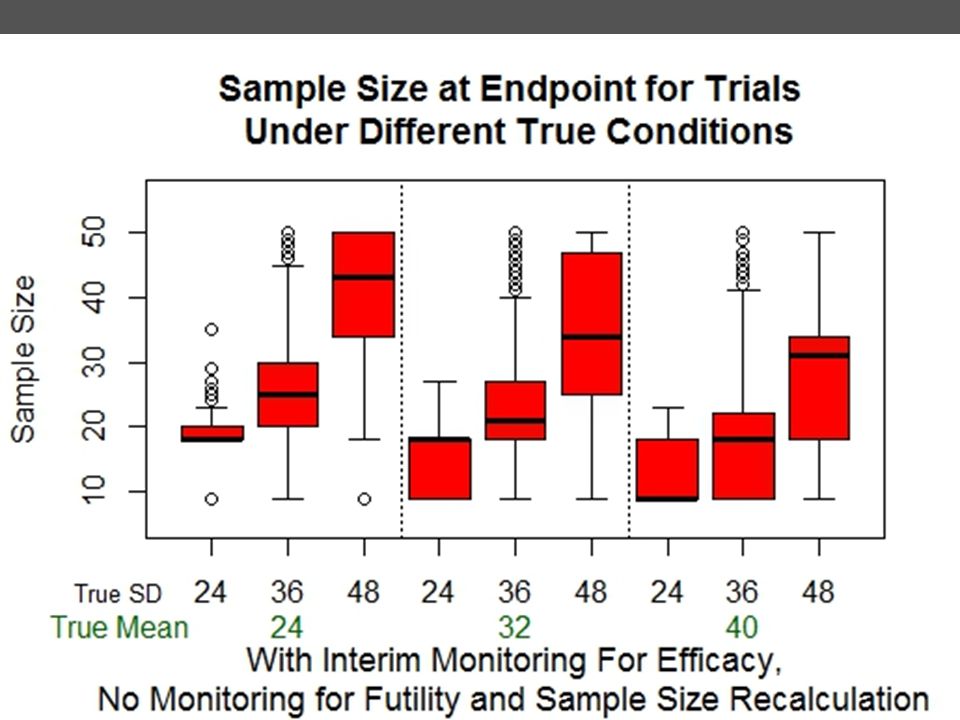
Effect of Interim Monitoring for Efficacy (Without Sample Size Re-estimation or Futility Monitoring)
Ending sample size < 35 per group because we can stop at earlier interim points when results are significant KP

13
Effects of Interim Monitoring for Futility (Without Sample Size Re-estimation)
Large drop in true Type I error from ~0.05 to ~0.01 (more opportunities to stop an ineffective trial from following through to the end and having significance by chance) Smaller stopping point sample size when response variance is larger than expected Chance of stopping early for futility, even if alternative is true, explains a slight drop in true power KP
 Smaller stopping point sample size when response variance is larger than expected. Chance of stopping early for futility, even if alternative is true, explains a slight drop in true power. KP.")
14
Effects of Interim Monitoring for Futility (Without Sample Size Re-estimation)
")
15
KP

16
KP

17
Effects of Sample Size Recalculation
If initial estimate of treatment response variance was too high, recalculation tends to decrease the ending sample size Likewise, underestimated variance leads to a larger required sample size Recalculation also maintains power of trial better even when initial estimate of variance is too low KP

18
Effects of Sample Size Re-estimation (Without Futility Monitoring)
")
19
KP

21
Overall Evaluation of Our Design
These characteristics show the design's potential value in Phase II trials: Minimizes Type I error rate Maintains power when variance estimate is too low May decrease sample size required to reach a conclusion Limitations: Sample size re-estimation potentially increases cost HR The effects of the design features that Kamrine described hint at our design's potential value in Phase II trials like the study motivating our project. futility monitoring tends to minimize type I error rate, while sample size reestimation helps to maintain the trials' power even if the initial estimate of variance is incorrect. All of these features also offer the possibility of reaching a conclusion sooner, which is especially important. So far we have seen several limitations, however, to our design: re-estimation of sample size may increase sample size needed to reach a conclusion, which potentially increases costs, and the nature of all of these design features is to induce a positive bias in the estimated treatment effect. To get a better sense of the value of our trial design, however, we will compare a few example scenarios.

22
How Does Our Design Compare to Interim Monitoring for Efficacy Alone?
If assumptions are accurate, with our design: Median ending sample size is smaller Power is slightly lower, but comparable Type I error rate is lower (important for Phase 2 trials) If assumptions are inaccurate (overestimated effect size and underestimated variance): Ending sample size tends to be larger (more expensive) Power is higher (though overall both are much lower) Type I error rate is lower HR So, with these ideas in mind we will compare our design--with efficacy and futility monitoring, as well as sample size reestimation--to a simple design with just interim monitoring for efficacy, and evaluate their performance when the initial design assumptions are correct, and when they are incorrect. I will highlight a few points to look for, and then you'll see them graphically. When the assumptions are met, our design performs at least as well or better than the simpler method: ending sample size is often lower, power is comparable, and the Type I error rate is much lower. When the assumptions are incorrect, however, our design also fares better in many respects. It maintains a somewhat higher power, and a lower type I error rate, though it tends to require a higher a larger sample size to reach a conclusion.
 If assumptions are inaccurate (overestimated effect size and underestimated variance): Ending sample size tends to be larger (more expensive) Power is higher (though overall both are much lower) Type I error rate is lower. HR. So, with these ideas in mind we will compare our design--with efficacy and futility monitoring, as well as sample size reestimation--to a simple design with just interim monitoring for efficacy, and evaluate their performance when the initial design assumptions are correct, and when they are incorrect. I will highlight a few points to look for, and then you ll see them graphically. When the assumptions are met, our design performs at least as well or better than the simpler method: ending sample size is often lower, power is comparable, and the Type I error rate is much lower. When the assumptions are incorrect, however, our design also fares better in many respects. It maintains a somewhat higher power, and a lower type I error rate, though it tends to require a higher a larger sample size to reach a conclusion.")
23
HR Here we have the results of the two designs, when the design assumptions of treatment effect and response variance are accurate. Here we see that our design tends to stop earlier, with about half stopping by the second interim monitoring point, with lower type I error rate and only a slightly lower power.

24
O'Brien-Fleming Graphs
HR Now, we compare the designs in the case that the investigator makes incorrect estimates both of the effect and the response variance. This combination would be most detrimental to the outcome of the trial, because it means the trial is trying to detect an effect that is smaller than expected, but also less predictable than expected. In this case, our design adapts by tending to reestimate higher sample sizes, as shown on the left, which keeps the true power somewhat higher than the simpler design. Furthermore, the monitoring for futility keeps the type I error very low, which is valuable in this type of trial. Of course the limitation is that over half the trials have stopping points higher than the standard of 35, and at least a quarter reaching the absolute max of 50, but .

25
Conclusion: "Is our design better for the motivating study?"
Yes! Minimizing Type I errors is important in Phase II trials, which is achieved in our design Treatment effect and response variance are not easily estimated in the motivating study Our design's ability to maintain power and keep error rates low even with inaccurate design assumptions is beneficial Limitation: Potential for higher re-estimated sample size may increase cost of trial HR

26
Acknowledgements The Iowa Summer Institute for Biostatistics program
Dr. Kathryn Chaloner and the entire University of Iowa Biostatistics department My research partner Kamrine Poels at the University of Arizona The Carleton Math Department

Similar presentations


 regarding unknown population parameter values based on sample data Elements of a hypothesis test: Null hypothesis.>")


 www.ahrq.gov.>")


